Monthly Archives: January 2014

SACMEQ data archive available for download

sacmeq

The SACMEQ data for 14 sub-Saharan African countries is now available for download for anyone who registers on the SACMEQ website (it only takes 5 minutes). This is a tremendously rich dataset and I’d encourage anyone who is interested in the quality of education in Africa to download it and explore. For some background reading I’d recommend the following:

Links I liked…

venn matters

  • As far as intellectual crushes go, I am a huge fan of Bill Easterly – listen to his EconTalk podcast on benevolent autocrats
  • The richest 300 people in the world have the same wealth as the poorest 3000,000,000 (3 billion) – absolutely illuminating and truly scary 3 minute infographic video
  • Sad day for LGBT rights in Nigeria as President Goodluck Jonathan bans same-sex marriage in the country.
  • Political prophet Alistair Sparks writes an insightful piece on what another 5 years of Zuma means for the ANC and South Africa.
  • Chart showing Africa from an LGBT rights perspective. Just another way that South African is different to the rest of Africa – it respects the rights of minorities irrespective of the size of the majority.
  • US parents are 2.5 times more likely to ask Google “Is my son gifted?” than “Is my daughter gifted” – NYT article showing the ongoing legacy of gender inequality and patriarchy.
  • Causal evidence that secular education reduces religiosity among girls in Turkey – no surprises there folks (see NBER paper here).
  • SAFM Forum at 8 – the podcast from my radio discussion on “Back to School
  • Given the jamboree around the matric 2013 results I found myself on TV a few times this month 1) School dropout in South Africa: 550,000 – eNCA, 2) Teacher content knowledge in South Africa – News24, 3) Mathematics literacy in South Africa – News24. Fun times!
  • Mweli Mathanzima (acting DDG for curriculum) wrote a response to my article (ANA results are not comparable), his article titled “No ANA mess, they’re a success.” I’m still contemplating if I want to right a reply to his reply but I think I will wait for the inspiration to hit. The main criticism I have (encapsulated in the title of my article) is that the Minister should not be claiming “improvements” using ANA changes year on year – something that Mweli does not address. The question is pretty straight-forward, does he agree or disagree with the Minister that the ANA results prove that things are improving? The short answer is that they CANNOT be used to show improvements or deterioration because they aren’t psychometrically calibrated to be compared year on year…anyways I’ll probably write a short reply sometime.
  • The DBE has called for comment on its new policy “Incremental introduction of African Languages Policy” and asked for comment. If you feel strongly about the potential upsides/downsides then the call for public comment closes on the 12th of Feb.

Education in SA – Still separate and unequal (Extended version of CityPress article)

Mud schools, no lights or electricity, overcrowded. Madelene Cronjé

[The article below is an extended version of my article published in CityPress on the 12th of January 2014]

When the matric results were released on Monday this week, the Deputy Minister of Education Enver Surty chastised us in academia for “denigrating” the schooling system, claiming that now is not the time for pessimistic criticism but rather for celebration and “inspiring hope”. The Deputy Minister will have to forgive me because I find it incredibly difficut to celebrate when no one is really acknowledging the 550,000 students who started school 12 years ago but have been silently excluded from the schooling system, dropping out before matric. To be specific, of 100 students that started school 12 years ago, only 51 made it to matric in 2013, 40 passed and 16 qualified to go to university. These youth that drop out before matric are completely marginalized and pushed to the fringe of society, forgotten amidst the hype of those who passed. Minister Motshekga is no exception. In her 5000 word speech, she devoted all of 10 words to discussing the issue: “The sector needs to urgently reduce repetition and dropout  drastically.” That’s it. Two strong adjectives and a hat tip?

I’ve been told  by some that now is not the right time to talk about this. But when is the right time to talk about it? June? September? It’s never comfortable or convenient to talk about half a million children dropping out of school and facing unemployment or menial work – something that happens year in and year out.

By not addressing drop out and repetition Minister Motshekga did a disservice to the country, but perhaps even more disturbing were the sweeping statements that fly in the face of hundreds of research reports on South African education. In discussing the results the Minister claimed that: “Contrary to what some would like the nation and the public to believe – that our results hide inequalities, the facts and evidence show that the two top provinces (Free State and North West) are rural and poor…The truth is in terms of learning outcomes in the sector, education remains an equalizer between poor and rich.”

To address the second part of this statement first, if South Africa’s education is an “equalizer” between poor and rich, why is it that South Africa’s income inequality has increased since the transition? While it is certainly true that if quality education is offered to rich and poor alike it will lead to a situation of increased social mobility, this is not the case in South Africa. In South Africa we have two public schooling systems: one which is functional, wealthy, and able to educate students (about 25% of public schools); with the other being poor, dysfunctional, and unable to equip students with the necessary knowledge and skills they should be acquiring in their schooling career (roughly 75% of public schools).

Apart from a small minority, most black children continue to receive an education which condemns them to the underclass of South African society, where poverty and unemployment are the norm, not the exception. This substandard education does not develop their talents and abilities or expand their economic opportunities, but instead denies them dignified employment and undermines their own sense of self-worth. In short, poor school performance in South Africa reinforces social inequality and leads to a situation where children inherit the social station of their parents, irrespective of their motivation or ability. That is how income inequality increases.

The second part of her statement – that matric results do not hide inequalities – is also patently untrue. The matric results, like every other educational data set in South Africa, hide enormous inequalities that sometimes aren’t immediately apparent. Before getting to the matric 2013 results, let me summarize some of the findings from the numerous studies highlighting South Africa’s ongoing educational inequalities: 1) The SACMEQ study of 2007 showed that there are huge geographic inequalities in the country with 41% of rural Grade 6 children being functionally illiterate compared to only 13% of urban grade 6 children. The prePIRLS study of 2011 showed the large linguistic inequalities exist: Of those children whose home language was Xitsonga, Tshivenda or Sepedi, one in two (50%) could not read by the end of Grade 4 compared to one in ten (11%) for English and Afrikaans children, and 3) The General Household Survey of 2011 showed that there are large racial inequalities in matric attainment: only 44% of Black and Coloured youth aged 23-24 had attained matric compared to 83% of Indian youth and 88% of White youth. We could also look at the TIMSS study of 2011 or the NSES study of 2009 or any of the Annual National Assessments or a host of others – they all show the same thing – systemic inequalities and underperformance.

But if we take a closer look at the matric results for 2013 we will see that they too hide severe inequalities. When allocating funding to schools, the Department classifies them into one of five categories called quintiles. Each quintile is meant to have 20% of schools ranging from Quintile 1 (the poorest 20% of schools) all the way up to Quintile 5 (the richest 20% of schools). The funding allocations are pro-poor with Quintile 1 schools receiving R905 per learner and higher quintiles receiving progressively less funding all the way up to Quintile 5 schools which receive R156 per learner. On the surface the differences between the matric pass rate by quintile are not too large with 70% of matrics from Quintile 1 passing and 92% of matrics from Quintile 5 passing. But this hides the fact that pre-matric dropout is twice as high in Quintile 1 compared to Quintile 5. If we looked at the number of enrolments in Grade 8 in 2009 (i.e. when the matric 2013 class was in Grade 8) there were 206,031 students in Quintile 1 schools and 141,905 students in Quintile 5 schools (the numbers are not equal between quintiles because schools prefer to be classified in lower quintiles to receive higher subsidies). But by the time they got to matric there were only 105,954 Quintile 1 matrics and 104,344 Quintile 5 matrics. That is to say that 49% of Quintile 1 students dropped out between Grade 8 and Grade 12 but only 26% of Quintile 5 students dropped out between Grade 8 and Grade 12. So if we rather calculate the matric pass rate as a percentage of those enrolled in Grade 8 four years earlier the figures change drastically being 36% in Quintile 1 and 68% in Quintile 5, i.e. of 100 Grade 8 Quintile 1 students, only 36 made it to matric and passed. Of 100 Grade 8 Quintile 5 students, 68 made it to matric and passed. Similarly, the proportion receiving bachelor passes by quintile is only 36% for Quintile 1 matrics and 68% for Quintile 5 matrics But if we calculate it as a percentage of Grade 8 enrolments four years earlier the figures drop to an abysmal 10% for Quintile 1 and 39% for Quintile 5. As a proportion, the number of Quintile 5 students in Grade 8 that will go on to pass matric with a bachelor’s pass is four times higher than that for Quintile 1 students. These shocking results are not limited only to Quintile 1 – the graph shows that the results are very similar in Quintiles 2, 3 and 4.

quintile

In highlighting these results it is not my intention to be the prophet of doom of South African education. I actually do think things are improving and we should give praise where it is due. Minister Motshekga has presided over a number of very important reforms including the introduction of the Annual National Assessments (ANAs), the implementation of Curriculum Assessment Policy Statement (CAPS), the roll out of the workbooks and the establishment of NEEDU. By focussing on the basics the Minister has laid the foundation for improvement and I agree that we are beginning to see the fruits of these efforts. Because of this I also happen to think she is the best  Minister of Education we have had to date. But to claim that the results do not hide inequalities is absolutely unforgiveable. If there is one thing that is clear from the local and international research on South African education it is that our schooling system is egregiously unequal. That finding is simply not up for debate.

While the low-level equilibrium that South Africa finds itself in has its roots in the apartheid regime of institutionalised inequality, this fact does not absolve the current administration from its responsibility to provide a quality education to every South African child, not only the rich. Until such a time as the Department of Basic Education and the ruling administration are willing to seriously address the underlying issues in South African education, at whatever political or economic cost, the existing patterns of underperformance and inequality will remain unabated.

Nic Spaull is an education researcher in the Economics Department at Stellenbosch University. He blogs about education research at www.nicspaull.com and he can be followed on Twitter @NicSpaull

Additional reading:

Matric is failing SA’s lost children (M&G article)

matric


[This article first appeared in the Mail & Guardian on the 10th of January and is available on their website here]

Although the matric exams are an important institution in South Africa, they should not be used as the primary indicator of school-system performance.

When speaking about the state of education in South Africa it is both conventional and convenient to talk about the matric pass rate. This figure is easy to understand; it is published every year in all national media – and it is very misleading.

Although the matric exams are an important institution in South Africa – notably because they are quality assured by an independent body, Umalusi – they should not be used as the primary indicator of school-system performance. Matric results provide useful information for those  who reach and write matric, but tell us nothing about the more than 500 000 pupils who started school in 2002 but never reached matric, let alone passed.

The tale of the matric results is a story half-told.

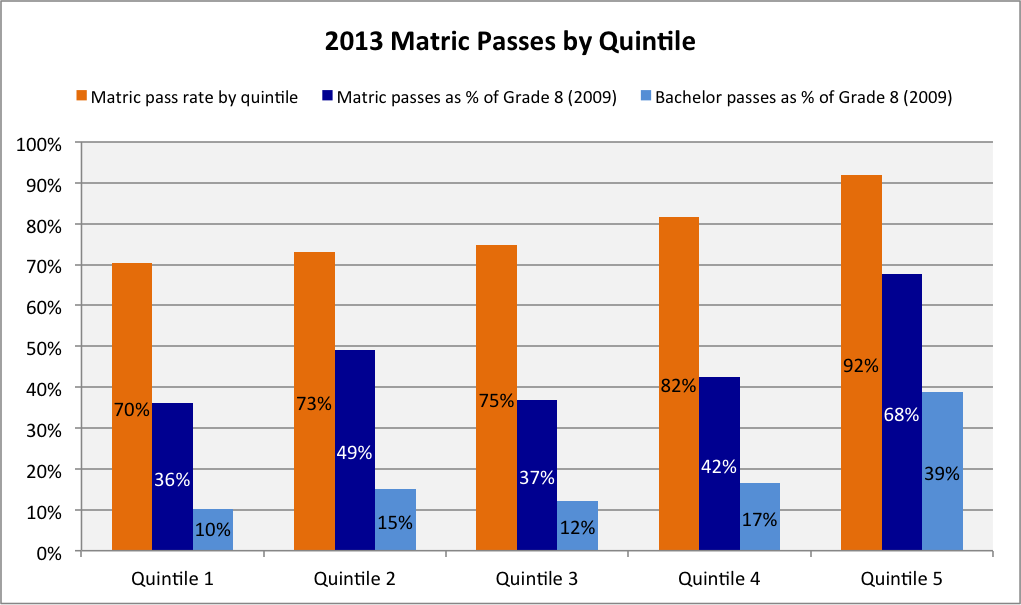
If we look at the matric class of 2013, there were 562 112 full-time candidates, of whom 439 779 passed, yielding a matric pass rate of 78.2%. But how many pupils were there to begin with? If we look at the 2013 grade 12 cohort, we see that there were as many as 1 111 858 pupils in grade two (in 2003), 1 094 189 in grade 10 (in 2011) – but only 562 112 in grade 12 (in 2013). What happened to the other 549 746 that never made it to matric? Most dropped out in grade 10 and 11.

Rather than calculate the matric pass rate as the number who pass matric divided by those who wrote matric (that is, 439 779 divided by 562 112), what would the 2013 figure be if we instead calculated the number who pass matric divided by those who started school 12 years earlier (439 779 divided by 1 111 858). I use grade two figures rather than grade one because grade two is a better indication of the true size of the cohort, given the excess repetition we have in grade one.

The calculation I am suggesting we do yields a truly shocking cohort matric pass rate: 40%! That is to say, of every 100 pupils who started school, only 51 made it to matric in 2013, 40 passed and 16 qualified to attend university.

This analysis shows how the normal way of calculating the pass rate, which as we know yielded 78.2%, shrouds the reality that half of the cohort never reached matric, let alone passed.

Discussing the matric pass rate without also mentioning that hundreds of thousands of pupils drop out in grades 10 and 11, and thus never make it to matric, is disingenuous, misleading and disregards those children marginalised by the schooling system.

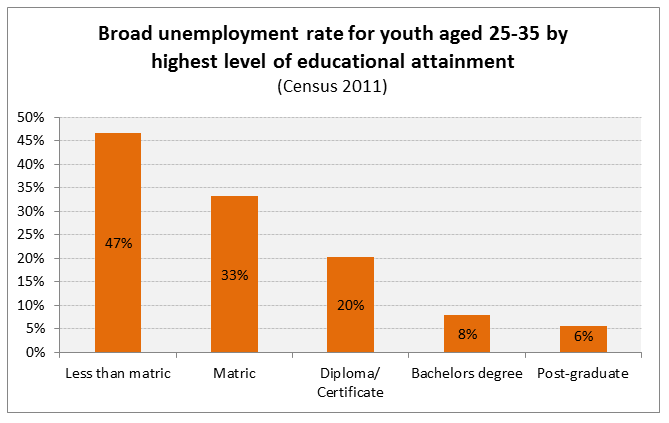
Although I would like to celebrate with the pupils who passed their matric exams, I find myself asking: “Who is going to speak up for the 550 000 children who started school 12 years ago, but have been silently excluded because of drop out? Given that we have no reliable pre-matric exam, what educational qualification do these children have?” Absolutely nothing. They are the first ones to fill the ranks of the unemployed, leading to a staggering unemployment rate of 50% – twice the national average – among youth (those from 18 to 24 years old).

Relative to other developing countries, South Africa actually has a higher than average proportion of pupils entering upper secondary school and an average proportion entering the last grade (grade 12). Yet the proportion that successfully completes secondary school is well below average for similar developing countries.

In South Africa only 40% of a cohort will graduate from upper secondary school, compared with much higher figures in Turkey (53%), Brazil (67%) and Chile (72%). This also explains why South Africa has comparatively few youth who reach and complete post-school education. Fewer than 10% of youths in South Africa attain 15 years of education (completion of a three-year degree, for example), compared with at least 15% in Columbia and Peru and 24% in the Philippines and Egypt.

Similar findings have previously been published, and numerous researchers have provided convincing explanations for the South African dilemma, particularly the analyses of Stellenbosch University academic Martin Gustafsson. His research points to four major factors: the low quality of primary and secondary education, financial constraints, teenage pregnancy and the lack of vocational opportunities.

The department of basic education has already begun to implement policies aimed at addressing these problems. These include:

  • Introducing an externally evaluated grade 9 exam over the next three years;
  • Implementation of the standardised Annual National Assessments, which test grades one to six and nine in numeracy and literacy (introducing these assessments has been a truly historic achievement, even though they do still have many problems);
  • Almost universal (99%) delivery of textbooks for this year;
  • The creation, publication and distribution of workbooks to all schools; and
  • Basic Education Minister Angie Motshekga’s finalising late last year of sensible minimum norms and standards for school infrastructure and her wisely chosen phased-in approach for their implementation.

We often overlook these quiet achievements when we are confronted with the shocking and unrelenting statistics of abysmal underperformance. The foundations are being laid for improvement and progress, but much, much more needs to be done if we are to achieve even our least ambitious goals.

I think there are three main points that summarise the concerns identified here and point the way forward:

  1. Placing excess attention on the matric pass rate is politically expedient, but educationally unsound; the real focus needs to be on the universal acquisition of basic skills in primary school and the quality of secondary schooling;
  2. The lack of any trustworthy pre-matric qualification means that most youths have no widely recognised proof of their educational status; and
  3. Pushing students through the schooling system in the absence of meaningful learning and external standardised assessments is detrimental to the students concerned and to the education system more generally.

We need to move beyond a single-minded and shortsighted focus on the matric pass rate and instead start focusing on the quality of primary and secondary schooling.

Looking more broadly, as we approach general elections this year, we can only hope that those in the corridors of power prioritise service delivery to the poor over patronage of the elite, accountability over cadre leniency and, perhaps most importantly, new and innovative ways of raising the quality of the teaching force. As research has shown time and again, no education system can exceed the quality of its teachers.

Nic Spaull is a researcher in the economics department at Stellenbosch University. His education-focused research can be found at nicspaull.com/research, and he can be followed on Twitter

The economic value of matric and the potential of further education colleges [My Africa Check article]

See below for a copy of my article published on Africa Check on the 10th of January (see here).

africa check

By Nic Spaull | 10th January 2014 (GMT)

Aiming for 100% matric pass rate would be truly misguided, argues economics and education researcher Nic Spaull. Rather, we should look to Further Education and Training Colleges to play a key role in educating and providing meaningful employment to millions of South Africans.

The school-leaving matriculation exam is one of the characteristic features of the South African education system. It would be rare to find a single South African citizen who did not know what the matric exam is, or be able to explain why people think it is important.

On Monday this past week, Basic Education Minister Angie Motshekga announced that of the 560,000 full-time students that wrote matric in 2013, approximately 440,000 passed, yielding a pass rate of 78%. This was up from 74% in 2012.

But the statistic can be misleading since it completely ignores the 550,000 students that started school 12 years ago and then dropped out of the schooling system, mostly in Grade 10 and 11. To be specific, of every 100 students that started school 12 years ago, 51 made it to matric in 2013, 40 passed and only 16 qualified to go to university.

Matric and labour market prospects

Dropping out of school or failing matric has serious labour market consequences.

Given that there is no pre-matric qualification that is widely acknowledged or accepted, a student who does not reach, write and pass matric, will have no proof of their educational status. Employers will not accept school reports since these are not nationally standardised and are thus unreliable indicators of achievement.

This can be seen when looking at the data from the 2011 National Census. The unemployment rate for 25 to 35 year olds who have “less than matric” was 47% in 2011, much higher than those 25 to 35 year olds that had a matric (33%), a diploma or certificate (20%), and about six times higher than for those with a bachelor’s degree or higher.

Clearly there are economic returns to passing matric, particularly because doing so provides access to further education and training which drastically improves one’s labour market prospects.

In addition to the labour-market importance of having a matric, it is also widely used by universities when determining who gets into what programs. However, many South African universities are now also using the results of the National Benchmarking Tests (NBTs) in their admissions criteria.

Assessing literacy and maths abilities of students

The NBTs were first introduced in 2005 by Higher Education South Africa as a way of assessing the extent to which students were ready for the academic demands of university courses. There are two NBTs, the first one is the Academic and Quantitative Literacy Test and the second is the Mathematics Test. Both tests are three hours in duration, written on the same day and are exclusively multiple-choice. They can be written at numerous times during the year.

Some courses require that students only write the Academic and Quantitative Literacy Test while others require that students write both tests. For example, if a student is applying to do engineering at the University of Cape Town, the matric results count for only half of their admissions points, with the Benchmarking Tests making up the other half.

In light of the above, you might think that the best outcome would be a 100% school retention rate and a 100% matric pass rate. That is both unattainable and undesirable. Such an approach ignores the potential value of an effective vocational education system or a pre-matric qualification that is a reliable indicator of achievement, both of which South Africa currently lacks.

Developing an effective vocational education system is necessary both for individuals whose talents, abilities and aptitudes are more suited to vocational careers, but also to fill the demand from industry for these professions. Even in advanced economies like the United States and the United Kingdom, the secondary school graduation rates are 77% and 87% respectively. One of the problems in South Africa is that there are few real options available to those who do not pass matric.

If we look at youths who do not hold a matric certificate, only 1% held some other non-Grade 12 school certificate of diploma issued by a Further Education and Training (FET) college for example.

Innovative thinking needed

Government’s National Development Plan (NDP) also highlights some of the other problems with the FET system: “Approximately 65 percent of college students are unable to find work experience, which is a requirement for completing National Technical Diplomas popularly known as N diplomas. The college sector is intended as a pathway for those who do not follow an academic path, but it suffers from a poor reputation due to the low rate of employment of college graduates.”

The problems inherent in a matric-or-nothing system are not going away anytime soon. The Department of Basic Education should begin to design and implement an externally evaluated Grade 9 exam and ensure that it does so in such a way that the exam has the trust and respect of the private sector and the public more generally.

While we certainly need to reduce grade repetition and dropout, to aim for universal matriculation would be truly misguided. The problems that face the vocational training sector in South Africa will only be solved with innovative thinking, experimentation and political will.

The aim of educating South Africa’s youth is to enable them to develop their talents and abilities and to lead the sorts of lives they have reason to value. To think that the only way to do this is through formal academic high school is short sighted and dismisses the potential for the FET sector to provide meaningful employment to millions of South Africa’s youth.

Nic Spaull is a researcher in the Economics Department at Stellenbosch University. His blog about education research at www.nicspaull.com and he can be followed on Twitter @NicSpaull

– See more at: http://africacheck.org/2014/01/10/the-economic-value-of-matric-and-the-potential-of-further-education-colleges/#sthash.okKjoERq.dpuf

The importance of matric/degrees for employment in SA

Census 2011 25-35 years olds

The above table was calculated from the Census 2011 data (thanks Hendrik Van Broekhuizen for his supercross skills) and reflects the employment status of those aged 25-35 years old in 2011. From the table it’s clear that those with higher levels of education are more likely to participate, more likely to be employed, and less likely to be discouraged. Only 39% of those who do not obtain matric were employed compared to 82% of those with a degree. It’s important to remember that the vast majority of the youth do not have degrees. For every one 25-35 year old that had a degree there were 11 who did not even have a matric. Given that this is for the 25-35 year old cohort (as at 2011), it’s not clear what the picture will be for the matrics of 2013. What we do know is that there have been worsening labour market prospects for those with matric, combined with a situation where more and more youth have a matric certificate. Consequently, it is understandable that many South African universities are now supplementing the NSC results with NBT test results when determining who gets into what programs. To get into UCT Engineering, for example, the admission points from the NBTs and those from the NSC are weighted equally. Even a cursory glance at the media coverage of the 2013 matric results would lead one to think that the days of blind faith in the quality of the matric certificate are rapidly coming to an end.

broad unempl