Category Archives: Matric

My Sunday Times article on Matric 2017

space

(This article first appeared in the Sunday Times on the 14th of January 2018).

The real matric pass rate and the real site of failure in education

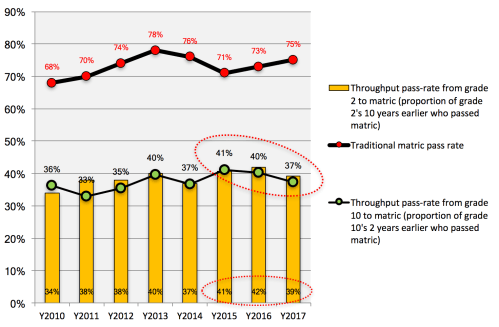
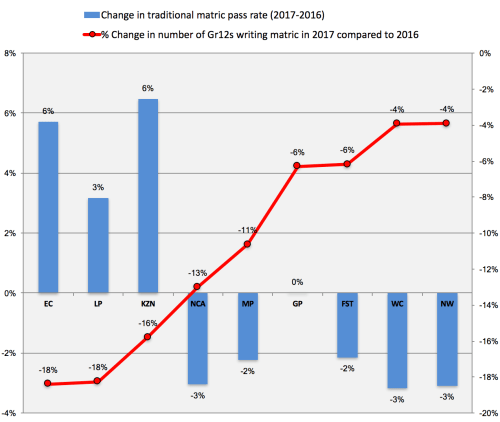
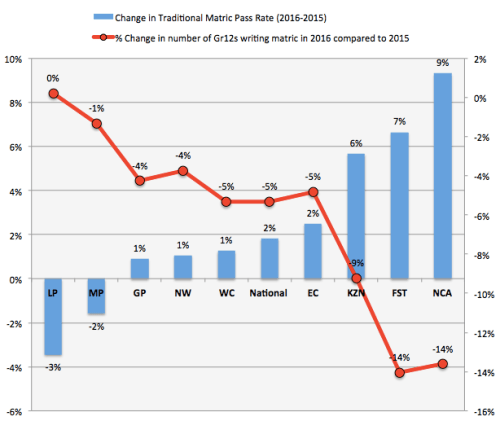
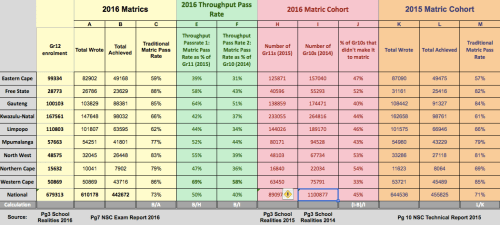
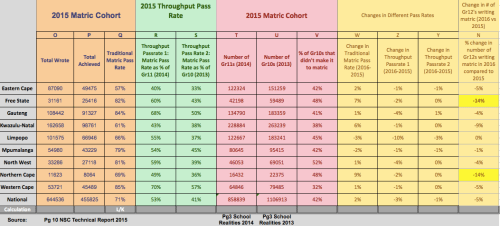
Every year the matric results come out and the whole country goes ballistic. Matric is on the front page of every newspaper and swamping the radio waves and TV stations of our country. And suddenly everyone has an opinion about what’s going on in education. “The Free State is the best province”, “We should ban the IEB and have one exam”, “The rising pass rate shows our interventions are working”. No. No. No. None of this is true. Firstly, the rising pass rate – from 73% in 2016 to 75% in 2017 is purely a function of more students being held back and dropping out. In 2017 there were only 401,435 passes compared to 442,672 in 2016 – that’s a 9% decline in one year. So why were there 40,000 fewer matric passes? It’s not because the population dropped by 9% in one year (it did go down but only by about 4%). It’s not because more candidates moved to writing their matric part-time (and therefore aren’t included in the ‘official’ pass rate); there were only 11,462 additional part-timers in 2017 compared to 2016. And it’s definitely not because there are fewer progressed learners (there were 108,742 in 2016 and 107,430 in 2017, basically the same). So we know it’s not the cohort, it’s not part-timers, and it’s not progressed learners, so what is it? Basically more kids are dropping out or being held back than in 2016. It’s also no surprise that the only provinces with increasing matric pass rates (Eastern Cape +6%, Limpopo +3% and KwaZulu-Natal +6%) were also the provinces with the largest declines in the numbers writing matric (-18%, -18% and -16% respectively). So the high-level take-home is that the more you ‘cull’ and ‘gate-keep’ the more your matric pass rate increases. It also means we have 5% fewer Mathematics and 10% fewer Physical Science passes in 2017 compared to 2016.

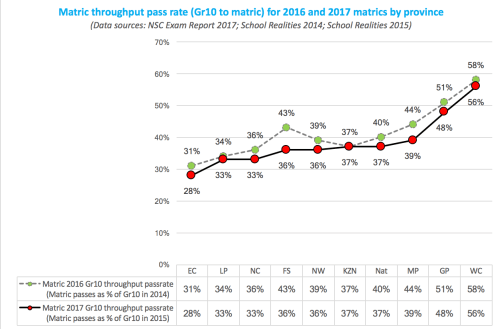
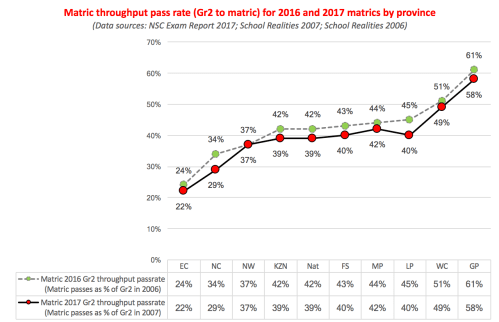
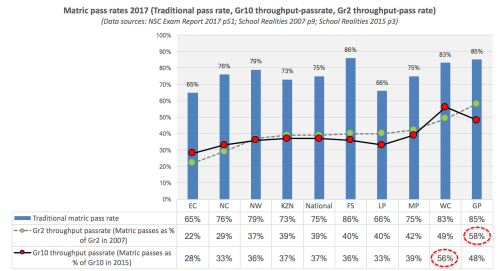
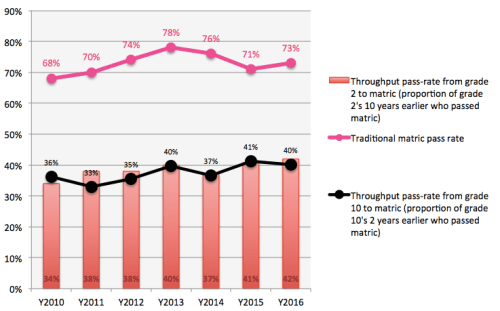
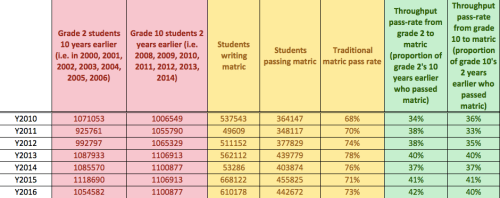
So what is the ‘real’ matric pass-rate. A lot of people have been asking this question, including myself, and it turns out it’s a little more complicated than one thinks. Occasionally we calculate ‘throughput pass rates’ (matric passes divided by grade 10 enrolments 2 years earlier or Grade 2 enrolments 10 years earlier), yielding figures around 39% for the 2017 Grade 10 throughput pass rate. This is the incorrect figure. The problem is that at least 20% of Grade 10 enrolments are actually ‘repeaters’ and not part of the original cohort. There are also the complications of those writing supplementary exams, getting part-time passes, or Independent schools writing the NSC exams. The most authoritative research done on this is by one of my colleagues at Stellenbosch University, Dr Martin Gustafsson, and according to his calculations the ‘true’ matric pass rate is about 55% and the province with the highest achievement is Gauteng. I believe that. While this is not as bad as the crude and incorrect figure of 39%, it is also not as high as the crude and incorrect figure of 75%. If one adds in youth who get some kind of non-matric qualification (i.e. through a technical or vocational college) the figure rises marginally to about 57%. So, 43% of youth in South Africa still get no qualification whatsoever. Not matric, not TVET, not university. Nothing. They enter the labour-market ill-prepared and inherit lives of chronic poverty and sustained unemployment. Is it any wonder that since 2002 more than 40% of 18-24 year olds in South Africa are ‘NEET’; Not-Employed-or-in-Education-or-Training?

So where do the wheels come off in the education system? The answer is long before matric. When children don’t learn to read for meaning in Grades 1-3 they fall further and further behind the curriculum even as they are promoted into higher grades.  Last month the 2016 Progress in International Reading and Literacy (PIRLS) results were announced and they showed that 78% of South African Grade 4 children could not read for meaning in any language (all 11 languages were tested). And if children don’t grasp the number concept, place-value or the four operations by the time they hit Grade 4 they are on a one-way ticket to failure. The 2015 Trends in International Mathematics and Science Study (TIMSS) showed that 61% of Grade 5 students could not do basic mathematics.

I know that for those writing and passing matric it is a momentous and important occasion. It’s the culmination of our schooling cycle and (unfortunately) a rite of passage into middle class life (note: necessary but not sufficient for said passage). But as a country I feel like we need to take active steps to de-emphasize the matric results and instead focus on the ailing primary school system, the ugly step-child in our national saga. We don’t even have national assessments in primary school anymore. If the wheels come off by Grade 4 then that’s where we need to be intervening. Prevention is better than cure. A stitch in time saves nine. A matric obsessed country misprioritizes its political and economic resources.

//

The DBE’s 2017 NSC Exam Report can be found here.


Explaining the matric results in 7 GIFs

*11pm 5/01/18: New addendum added. Note that the throughput pass rates or comparison rates discussed here are not the ‘real’ pass rate. It is not 37% but about 55% (the former is a crude approximation and underestimates the true pass rate by about 15-18 percentage points primarily because the denominator has repeaters) See Martin Gustafsson’s comment at the end of the post. 

worked up

Every year the matric results come out and the whole country goes ballistic. Front pages of the newspapers, every radio, every TV station. And suddenly everyone has an opinion about what’s going on. All the people. so. many. opinions. “The Free State is the best province”, “We should ban the IEB and have one exam”, “The rising pass rate shows our interventions are working”. No. No. No.

dulp2


  I was determined that this year I was going to stay out of the #MatricResults2017 morass and instead focus on our program to teach Foundation Phase teachers how to teach reading, because 78% of kids in SA can’t read. But no one seems to be reading the 97-page 2017 NSC Examination Report which has loads of information. Spend an hour or two analysing the data and it’s pretty easy to see what the trends are and what’s going on. So here are some of my take home points:

(1) The matric pass rate is one (very incomplete) measure of the education system and it’s a bad idea to focus on it in isolation.

got any other bad ideas (stark)

The matric pass rate is calculated as the numbers passing divided by the numbers writing. It can go up if either the numerator goes up or the denominator goes down (or both).  Nick Taylor argued this in 2011 and I’ve discussed this in 2015 and 2016. The gist of it is that it’s possible to artificially raise the matric pass rate by letting fewer weaker students write the exam (in SA this is referred to as culling or gate-keeping). So to get around this we calculate a ‘throughput pass rate’ where we divide the total number of passes by the Gr10 enrolment two years earlier or by the Grade 2 enrolment 10 years earlier. This is a VERY crude measure and does not take into account grade repetition in Gr2 and Gr10, migration, mortality etc (see Martin Gustafsson’s comment at the end of this post for a fuller discussion). So what do the trends look like in the “Traditional” matric pass rate and the “Throughput comparison rate? Basically, while the traditional pass rate has been rising the Gr10 throughput comparison rate has been declining for three years now and the Gr2 throughput comparison rate has been declining for two years. Note the ‘real’ matric pass rate is closer to 55% not 75%, but also not as low as 37%. Basically the ‘real’ pass rate is 15-18 percentage points higher than these crude estimates once you take into account repeaters and some other factors (again, see Martin’s comment at the end).

Screen Shot 2018-01-05 at 6.22.49 PM

(2) The provinces with the largest increases in matric pass rate have the largest declines in numbers writing matric

ram and cow

Basically what happens is that provinces (via principals and teachers) let fewer students reach and write matric (usually the weaker ones) which artificially lowers their denominator and raises their traditional pass rate. So the three provinces that have higher pass rates in 2017 compared to 2016 (EC, LP and KZN) also had the largest declines in the number of Gr12s writing matric between 2016 and 2017.

Screen Shot 2018-01-05 at 7.59.39 PM

(3) The Free State is NOT the best performing province in the country. Some people think that. They are wrong. 

entitled to your wrong opinion

As mentioned in point (1) above, the traditional pass rate can be very misleading. This is especially the case with the Free State. While it has the highest traditional pass rate (86%), it also has the largest decline in Gr10 throughput comparison rate between 2016 and 2017 (from 43% to 36%). What does that mean? Basically that the change between 2016 and 2017 for the Free State seems to be driven by the fact that they are letting fewer of their (weaker) Gr10’s reach matric in the first place.

Screen Shot 2018-01-05 at 6.19.30 PM

If one looks at the Grade 2 throughput comparison rate then Limpopo and the Northern Cape seem to doing quite a bit worse than they were in 2016.

Screen Shot 2018-01-05 at 6.15.27 PM

(4) So if we use the throughput pass rate who does better, the Western Cape or Gauteng?

excited

For those who follow education statistics it’s pretty clear that the WC and GP are always the top two provinces in the country. Sometimes it’s WC (PIRLS Literacy 2016, TIMSS-N 2015), sometimes it’s GP (TIMSS-Gr9 2015). So if the Free State suddenly pops up as number 1 you’ve got to look into the data a little. And what do we find? Surprise, surprise, if you use either the Gr2 throughput comparison rate or the Gr10 throughput comparison rate then the FS is fifth. And who’s first? Gauteng and the Western Cape, kind of both. You see if you take the Gr2 throughput comparison rate then it’s GP but if you take the Gr10 throughput comparison rate then it’s WC. You usually see GP ahead if you use Gr8 throughput as well. The reason is usually because the dropout that does occur in the WC usually happens before Gr10 so their Gr10 numbers are artificially low.

Screen Shot 2018-01-05 at 5.46.42 PM

But you might then ask: why not just use the Grade 2 throughput rate instead because it’s more reflective of the whole education system? Well, it’s mainly because there is likely some inter-provincial migration between Grade 2 and Grade 12 and this is most likely from poorer provinces towards WC and GP. So the WC and GP throughput comparison rates are always slightly inflated, and the Gr2 throughput rate is the most inflated.

(5) There are other things to focus on instead of the matric pass rate

I know that for those writing and passing matric it’s a momentous and important occasion. It’s the culmination of our schooling cycle and (unfortunately for some) a rite of passage into middle class life (note: necessary but not sufficient for said passage). But as a country I feel like we need to take active steps to de-emphasise the matric results and instead focus on the ailing primary school system that seems to drop off the radar after a week of new results being released. 78% of our Grade 4 kids cannot read for meaning in any language. 66% of our Grade 9’s can’t do basic maths or basic science. Perhaps because 79% of our Grade 6 maths teachers can’t pass Grade 6 maths tests? We need to get back to basics and ensure that every child learns to read for meaning and understand the concepts of number and numeracy. If the wheels come off by Grade 4 then that’s where we need to be intervening. Prevention is better than cure. A stitch in time saves nine. A matric obsessed country misprioritizes its resources.

Transmission ends.

convo over

Addendum: Important comment from the ever-wise Martin Gustafsson (I agree with all of his points here, including that the ‘real’ matric pass rate is best estimated as 55%.

“Nic, whilst I absolutely agree with the thrust of this, I don’t agree with the 37 to 39% figure. The problem with dividing Grade 12 passes with Grade 2 enrolment 10 years ago is that there are many repeaters in Grade 2. We have relatively good data for recent years pointing to around 10% of Grade 2 learners being repeaters. We don’t know with certainty what the situation was in 2007, but the figure then was probably higher. Counting NON-repeaters only in your denominator would give you a better idea of who should proceed to Grade 12. But there are other issues: mortality, migration (e.g. across provinces if you want to look at provincial ratios), enrolment in TVET colleges, supplementary examination results, part-time Matriculants, IEB. Once you take all of this into account you get around 55%, not the 37 to 39% you refer to. The DBE has published the calculations (done by me) behind the 55%. It’s at http://www.education.gov.za/Portals/0/Documents/Reports/Education%20Sector%20review%202015%20-%202016.pdf.

PS: for those who want to review the numbers and do their own calculations the Excel file and references for all the stats are available here

My take on Matric 2016…

screen-shot-2017-01-06-at-10-29-18-am

screen-shot-2017-01-06-at-10-29-36-am

Every year there is a big song and dance about the matric exams and if the pass rate went up or down, which province came out on top etc. etc. Thankfully some organisations like Equal Education are directing our attention to where the root issue is: the weak foundations students get in primary schooling. There is ample evidence of this in maths and reading as the foundational bell-weather subjects that pretty much everything else is built on.

Throughput pass rates

As I’ve mentioned before we need to move beyond our myopic obsession with the matric pass rate and start seeing the results in light of other statistics, notably the throughput pass rate. Rather than calculating the number of students passing matric divided by the number of students writing matric (the traditional matric pass rate) we should also be calculating the number of students who pass matric relative to the number of students in grade 10 two years earlier and those in grade 2 ten years earlier (throughput pass rates). This gives us an idea of how many kids are dropping out along the way and if this is increasing or decreasing over time. (Note that this is also affected by the changing number of students repeating Grade 10. Because we don’t know the number of non-repeating students we have to use the total number of students enrolled in Grade 10).

From the above graph and table we can see the following:

  • The throughput pass rate and the traditional matric pass rate do not always move in tandem. For example, between 2014 and 2015 the traditional matric pass rate went down while the throughput pass rate went up, indicative of the much larger cohort of students who did worse on average but because there were so many more students this meant a higher throughput pass rate (as I ‘ve discussed here and Nick Taylor has made the same argument in 2011).
  • The throughput pass rate has been steadily increasing over time, which is a good thing.
  • Less than half of the cohort (whether Grade 2 or Grade 10) actually pass matric. In our system about 60% of South African youth leave the schooling system without any proof of their educational status.

Standardisation and grade inflation

Secondly there is the issue of standardisation and adjustment. The quality-assurance body Umalusi is tasked with standardising the matric results so that no one year is disadvantaged relative to another. If the exams are more difficult/easy then Umalusi is allowed to adjust the marks upwards/downwards (by a maximum of 10 percentage points). As I discussed last year the presence of an extra 120,000 matrics in 2015 made the process of standardisation much more complicated than it had been in the past. We know these are weaker students and thus would have dragged down average performance, yet the decline in average performance in 2015 was attributed to more difficult papers.

“Was the test really so much more difficult than previous years? (This is the only reason why one is allowed to adjust the marks at all.) Why did the internal and external moderators not pick up the huge increase in difficulty? Is it not more plausible that the massive drop in pre-adjusted performance was actually due to the additional 112,000 weaker pupils who would have otherwise dropped out? If so, Umalusi shouldn’t have adjusted. (from here)”

In my view the standardisation of raw marks should be done without progressed learners included and then applied to progressed learners after the fact. You cannot compare the 2015 and 2016 cohorts (and to some extent the 2014 cohort) with earlier cohorts because they did not have progressed learners. I think this remains an open question and I am quite anxious about the very large adjustments that Umalusi is making, assuming that the tests are getting much more difficult when the most plausible explanation is the inclusion of many more weaker students that typically would have dropped out in the past. (In 2015 the number of students passing maths literacy increased from 38% to 71% and there were similarly large adjustments in 2016).  If I am right about this, and there is essentially a lot of grade-inflation going on, then we are likely to see universities increasing their NSC points entrance criteria and – something which we have already seen over the last 6 years – the use of other criteria like the National Benchmarking Tests.

Provincial performance and sample selection

Every year the media likes to highlight which province has done the best in the matric exams. The competition is usually between our two wealthiest provinces (surprise surprise!), which are Gauteng and the Western Cape. In 2016 the Free State had the highest matric pass rate of 88% and so MEC’s and bureaucrats were all commending the Free State for their achievement. But if we dig a little deeper there are a few thorny questions here…

In 2011 Nick Taylor argued that changes in the matric pass rate can be driven by many things, including the difficulty of the exams, subject combinations and the number of students that actually make it to matric. This later point is the one I want to highlight here – the practice of not letting weaker students get to matric, sometimes referred to as gate-keeping or — and I hate this term — ‘culling’).

When I heard that the Free State and the Northern Cape had increased their matric pass rates significantly (7 and 9 percentage points respectively), my first question was “But did they hold back more students than last year?” So let’s see what the numbers say. Does there seem to be a relationship between the number of Grade 12s writing matric between 2015 and 2016 and a change in the pass rate over the two years? Let’s see…

screen-shot-2017-01-06-at-11-24-36-am

So, the three provinces with the largest increases in their matric pass rate also had the biggest declines in the percentage of students writing matric. That’s pretty strange. So if we do a similar analysis to the throughput pass rate above but at a provincial level what do we see? The Free State is no longer first but 4th of the provinces with the Western Cape and Gauteng at the top. And the Northern Cape and KZN are now only marginally better than Limpopo – the second worst performing province.

screen-shot-2017-01-06-at-11-15-04-am

screen-shot-2017-01-06-at-11-15-19-am

There may well be a legitimate explanation for this but our first port of call when seeing a big change like this is a change in the underlying sample. Before we start asking what interventions the Free State implemented we should be asking if the ‘increase’ is legitimate. At least at face value there seems to be a lot more sample selection in the provinces with the highest increases in matric pass rates. And judging from the Grade 10 (2014) and Grade 11 (2015) cohorts it doesn’t look like there was a population decline in these provinces.

So to sum up the above I’d say the following:

  1. We shouldn’t be obsessing about the matric pass rate in isolation or as much as we do.
  2. The biggest problems that should occupy our time, energy and resources are getting the foundations right in primary school.
  3. At least part of the reason why the Free State, the Northern Cape and KZN did better in 2016 than in 2015 is that they held back a higher proportion of their Grade 10 and Grade 11 students than the other provinces.
  4. I think there are still big question marks about the way Umalusi is treating progressed learners in the standardisation process and we may be witnessing quite significant grade inflation.
  5. Universities are likely to feel the brunt of this when their first years are not as well-equipped to succeed as their grades seem to indicate.

So now, I need to get back to Foundation Phase reading research 🙂

The excel file with the above tables/graphs/figures is here in case anyone wants to do their own calculations/graphs.