Monthly Archives: September 2016

Important research inputs on #FeesMustFall

fees

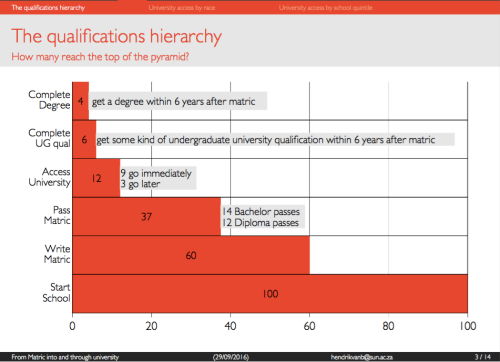
I have been meaning to blog about some new research on access to higher education that was published earlier this week: “Higher Education Access and Outcomes for the 2008 Matric Cohort” (Van Broekhuizen, Van der Berg & Hofmeyr, 2016). I will only highlight some of the key points from the 122-page Working Paper which is really worth reading in its entirety. Essentially the researchers used the matric data from 2008 and followed these students (using their ID numbers) into the higher education system using data from the Higher Education Management Information System (HEMIS). Perhaps the most striking feature is that of the 100 students that started school, only 12 ever access university (9 immediately after matric and 3 later), 6 get some kind of qualification within 6 years and only 4 get a degree within 6 years.

Screen Shot 2016-09-28 at 3.10.39 PM.png

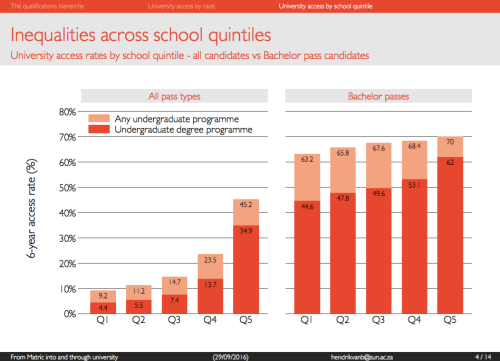
Secondly, that matrics that attend quintile 5 schools (almost all of which charge fees) are four times as likely to access university than those from the poorest 60% of schools (quintiles 1-3), all of which are no-fee schools. However, it’s encouraging to note that of those quintile 1-3 student that do qualify with a bachelor’s pass, more than 63-68% do actually access university, compared to 70% among quintile 5 students.

screen-shot-2016-09-28-at-3-12-11-pm

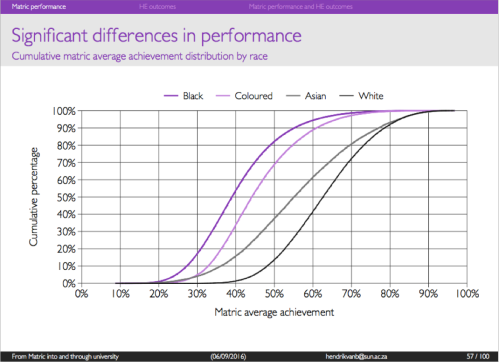
Much of the paper points to that fact that unequal access to university is rooted in a highly unequal schooling system where access to high-quality schooling largely depends on a family’s ability to pay school fees. If one looks at the cumulative matric average achievement by race one still finds enormous differentials. While 60% of White matric students achieved 60% or more in matric, only 5% of Black African matrics score at or above 60%. And this is only among the students that actually made it to matric which is only slightly more than half the cohort (see this paper).

screen-shot-2016-09-28-at-3-16-05-pm

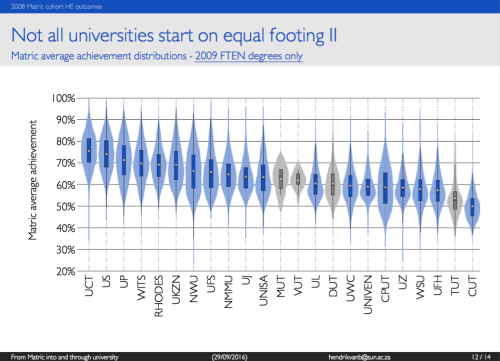
The last piece of their research that I want to highlight is that the student intake at different universities is vastly different. If one looks at the matric marks of the typical student entering UCT, Stellenbosch, UP or Wits one can see below that they scored 70% or above on average. This is in stark contrast to those students entering TUT, Fort Hare, Uni-Zulu, Walter Sisulu, UWC etc., all of whom have incoming students whose average matric mark is less than 60%. At the Central University of Technology (CUT, in Free State) the average entrant scored 50% in matric.

screen-shot-2016-09-28-at-3-01-54-pm

At the beginning of last year Professor Servaas van der Berg gave a Brown-Bag Lunch Seminar at Stellenbosch University  on “The Distributional Implications of Student Fees.” I include some notable excerpts and graphs below:

“Education has a number of properties which make the analysis of the demand for it both interesting and complex. … (Education is) …a consumption good and a capital good, i.e., although much of the expenditure is justified in terms of the effects on the individual’s income in the future, many of the activities of educational institutions are primarily justifiable in terms of their immediate consumption benefits. Moreover, education affects individuals’ future incomes.” – (Stiglitz 1974: 349)
screen-shot-2016-09-29-at-1-16-04-pm

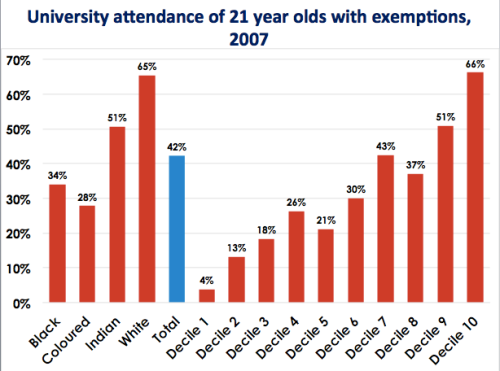
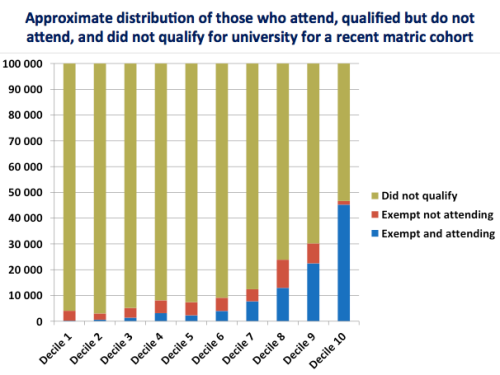
Perhaps most striking are Van der Berg’s estimates of who actually makes it to university and where they come from in the income distribution. According to these estimates, there are more students attending university from the richest 10% of the income distribution (Decile 10) than from the poorest 80% of the income distribution (Deciles 1-8 combined).
screen-shot-2016-09-29-at-1-48-06-pm

screen-shot-2016-09-29-at-1-33-47-pm

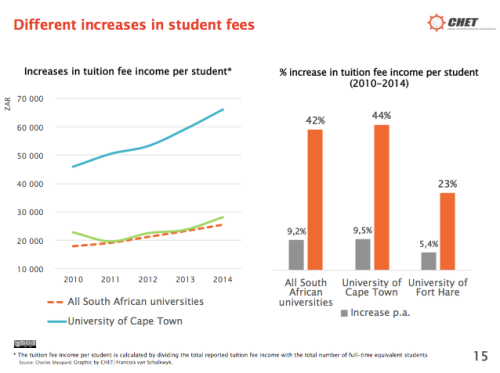
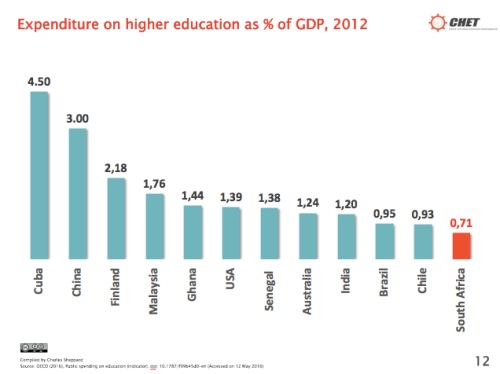
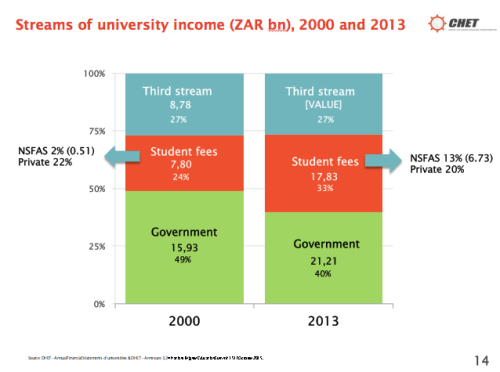
Last month Nico Cloete (from CHET) gave a lecture at SALDRU (UCT) titled: “University Fees in SA: A Story from Evidence.” I include some relevant slides from his presentation:
screen-shot-2016-09-29-at-1-47-00-pm

screen-shot-2016-09-29-at-1-47-23-pm

screen-shot-2016-09-29-at-1-47-40-pm

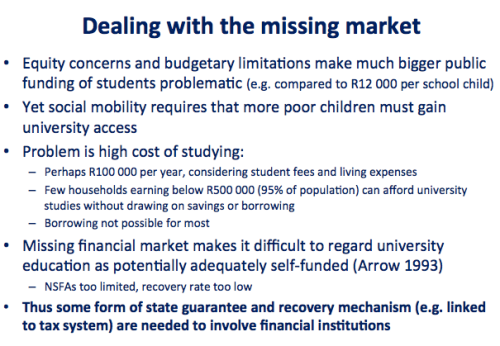
Anyone who wants to contribute to the debate about university fees needs to grapple with the realities presented by these three papers/presentations. At the end of the day we need to be able to answer the question of where the money will come from. A Graduate tax? Debt? The Education or Health budgets?

The most reasonable (and probably workable) solution that I have heard is that proposed by Prof Van der Berg who suggests that we should use the existing financial services infrastructure (banks) who could provide government-backed grant-loans (my terminology not SVDB’s) to students that qualify for university. It would be a grant that converts into a loan if a student successfully completes their degree and starts earning a decent income. It would still require a huge amount of government finance to provide the surety to banks for students who come from households that earn less than R500,000 (or some threshold). But, unlike with totally ‘free’ education, the students that do successfully complete their degrees would ‘pay-it-forward’ and contribute to the fund used to finance future students. boom

Also, as a side-issue, the Fees Commission needs to get a fast-tracked timetable and told to release at least a preliminary report and recommendations before the end of the year. We cannot wait until June next year. The political hot-potato would have been passed along one too many times from VCs to DHET to Treasury and eventually it will just explode. A stitch in time saves nine.

(If you have any additional research suggestions please send me an email and I’ll include them in this post)

Additional inputs from readers: 

Between the Devil and Deep Blue Sea? The Financing of Higher Education” 3×3 article by Philippe Burger – Sept 2016 (Thanks Marisa!).

Abstract: “Higher-than-inflation increases in student fees since 2009 often are blamed on declining government subsidies to universities. This is not entirely correct, if one considers real per-student subsidies. Fee increases resulted mainly from cost pressures faced by universities due to growing student numbers and a weakening rand. These pressures will not disappear. Eliminating government wastage is not a durable solution and difficult choices cannot be avoided. So, who should pay for increasing costs, students or government – or which combination of these?”

Kagisano Number 10 – Student Funding” – CHE (April 2016)

Description: The tenth issue of the CHE’s journal, Kagisano, brings together a number of papers that were presented at a CHE colloquium on student funding that was held in December 2013. The colloquium took as its point of departure the Funding chapter of South African Higher Education Reviewed, and the various papers, presented by experts who responded to a call for papers, all address in different ways the student funding crisis that reached a head with the #feesmustfall campaign in late 2015, and that continues to underlie student unrest in higher education. Different ideas on how to restructure student funding are presented, and the solutions range from the philosophical to the practical. This issue aims to contribute to the ongoing conversations, negotiations and policy-making aimed at ameliorating the intractable challenge of how to fund increasing access to higher education while ensuring that students receive a quality higher education experience.

Shaky data skews literacy results (M&G article on SACMEQ IV)

screen-shot-2016-09-25-at-11-26-28-am

(The article below was published by the Mail & Guardian on the 23rd of September 2016)

Every few years South Africa participates in international tests of reading, mathematics and science in an attempt to see what our students know and can do, and how this is changing over time. These tests are independently set and usually comparable over time. Every 4 or 5 years we test our Grade 9 students in maths and science (Timss) and our Grade 4/5 students in reading (Pirls), and every 6 years we test our Grade 6 students in reading and mathematics (Sacmeq). 2016 happens to be the year when all the results of these assessments are released to the public. The 2015 Timss and Pirls results will be released in November/December this year and the 2013 Sacmeq results were presented to Parliament earlier this month, which is what I will focus on here.

In what would have been the biggest news of the post-apartheid period – at least if it were true – Parliament heard that South Africa’s primary education system improved faster than any other education system in the history of international testing, i.e. since 1967. Our alleged improvement was more than twice as large as the fastest improving country in the world, Brazil. To be specific, South African Grade 6 students’ test scores improved by more than 0.9 standard deviations between 2007 and 2013 or the equivalent of an extra 3 full years worth of learning. To put this in perspective, this is the same as taking Thailand- or Mexico’s education system and making it equal to Finland’s or Canada’s in 6 years. It makes for a great story or a wish from a Fairy Godmother, but not for plausible results from a psychometrically-rigorous international test. Note that it is not only South Africa that experienced these colossal ‘gains’, but all Sacmeq countries, which is even more suspicious. A big part of the alleged Sacmeq improvements actually arise from different methodologies employed in 2007 and 2013, making them incomparable until they are properly equated.

The results presented to Parliament compare data from 2007 and 2013, yet the way these results were calculated in each period was not the same, and I should I know. I was appointed by Sacmeq itself earlier this year to analyse the results for the international Sacmeq report. After analysing the data I raised a number of serious technical concerns about the data that significantly affect the comparability and validity of the findings, and especially the fact that the weaker students had been excluded from the final analysis. I advised the Sacmeq Secretariat to address these concerns before any publication of the results since doing so would be misleading. Based on the subsequent response from the SACMEQ Secretariat indicating that this would not happen I explained that I could not in good conscience continue with the analysis and chose to resign on technical grounds in August this year. The issues I raised have not been addressed since the results presented to Parliament were the same as those that I identified as problematic. At the same time this was going on I emailed the Department flagging my concerns and cautioning against publishing the results.

The Department of Basic Education itself was shocked by the unprecedented improvements. In the presentation to Parliament they explain: “Given the significant improvements, the South African national research team requested SACMEQ to double check the results and were subsequently reassured on their accuracy.” This is simply not good enough.

The lack of comparability between 2007 and 2013 is so glaringly obvious one doesn’t need inside knowledge of the data to see how implausible the results are. At the same time that the student reading scores soared (rising by 0.9 standard deviations), the teacher reading scores plummeted (dropping by 0.8 standard deviations), which is extremely peculiar. If we are to believe the results, by 2013 basically all South African students could read, with illiteracy rates dropping from 27% in 2007 to 3% in 2013. This is totally at odds with the other main international test we do, Pirls in 2011, which showed that 29% of Grade 4 students were reading-illiterate and 58% could not read for meaning, confirming a host of smaller studies showing the same thing.

If we dig a little deeper, the Department’s presentation to Parliament apparently showed that the biggest improvers were Limpopo and the Eastern Cape. Go figure. These are the very same provinces that were placed under administration (Section 100) in 2011 because they were so utterly dysfunctional. To use the Minister’s own words, these are the education system’s “pockets of disaster” whose 2015 matric results were a “national catastrophe.” Yet Sacmeq would have us believe that illiteracy in Limpopo has been totally eradicated, dropping from 49% in 2007 to 5% in 2013. In stark contrast, our other major international test (Prepirls) showed that of the more than 2900 Grade 4 students that were tested in Limpopo in 2011, 50% were reading-illiterate and 83% could not read for meaning.

For those unfamiliar with the norms of psychometrics and testing, it is perhaps helpful to explain by analogy. The scale of the ‘improvements’ in test scores shown in SACMEQ 2013 is tantamount to saying that Usain Bolt and all the other athletes in the race ran the 100m in 5 seconds without ever wondering whether there was something wrong with the stopwatch. The sad thing about all of this is that it does seem that South Africa is really improving – other reliable evidence points to this – but not nearly as fast as the SACMEQ IV test scores would have us believe. According to the presentation, the Sacmeq questionnaire data also encouragingly shows that students’ access to their own textbooks increased substantially over the period from 45% to 66% for reading textbooks and from 36% to 66% for maths textbooks. This is good news.

In the latest turn of events the Department explained that apparently the results presented to Parliament were in fact “preliminary”, that an “extensive verification process” is currently underway, and that it is “fully aware of the issues raised in this regard.” Yet why then did it choose to go ahead and present questionable results to Parliament? Apparently researchers – AKA me – have “mislead the public” and my motives are “unclear.” There is nothing unclear about my motives; there is a major technical concern and the public should not be mislead into trusting these results presented to Parliament. There is also no uncertainty about whether the Sacmeq IV results should have been presented to Parliament. They should not have been presented while there is still so much uncertainty around the comparability of the results, end of story. The Department has been aware of the serious technical concerns around the results for some time now, since I emailed a number of members of the Department’s own research team many months ago drawing attention to these problems and cautioning against publishing any results until they could be rectified.

What I do not understand is why the Department would undermine their own technical credibility by presenting obviously questionable results to Parliament. Personally I would also not be surprised if the Sacmeq data – once comparable – did show an improvement in line with those of other studies. Soon we will also have the Pirls results of 2015 as another data point to verify what is going on. In South African education there is probably already a good story to tell, why muddy the waters by reporting such obviously impossible improvements based on dodgy data? The Department and Sacmeq must make sure the results of Sacmeq 2007 and 2013 are strictly comparable before reporting any further results and causing additional confusion.


Serious technical concerns about SACMEQ IV results presented to parliament

 On the 12th of September the Department of Basic Education (DBE) presented a briefing to the Basic Education Portfolio Committee on the SACMEQ IV (2013) results. This was the first time that these results were presented in a public forum, and the first time that the national average SACMEQ IV reading score (558) and the national average SACMEQ IV mathematics score (587) were presented. The presentation is publicly available here.

I have an intimate knowledge of the SACMEQ IV data given that I was appointed by the SACMEQ Secretariat to analyse the SACMEQ IV data for the international report (date of appointment: 19 April 2016, Purchase Order Number UB-P02016001112, University of Botswana). After analysing the data I raised a number of serious technical concerns arising from the data  that significantly affect the comparability and validity of the findings and advised the SACMEQ Secretariat to address these concerns before any publication of the results (letter dated 26 May 2016). I also emailed the SACMEQ Technical Advisory Committee (9 June 2016) outlining the technical issues. Only one member responded and indicated that the item-response-theory (IRT) analysis should be redone with two independent verification checks. Based on the subsequent response from the SACMEQ Secretariat indicating that this would not happen I explained that I could not in good conscience continue with the analysis and chose to resign on technical grounds (resignation letter dated 7 August 2016).

The principal grounds for my technical concerns and subsequent resignation was the non-comparability of the results between SACMEQ III and SACMEQ IV because of the different methodologies employed when calculating test scores between SACMEQ III and SACMEQ IV, and particularly the fact that weaker students had been excluded from the final results in the process. This does not seem to have been addressed since the results presented to Parliament were the same as those that I identified as problematic.

Unfortunately, the contract that I have signed with SACMEQ prevents me from publishing any results that are based on that data until the international report has been publicly released, at which time I will provide a full account of my technical concerns and reasons for the non-comparability. I have also subsequently deleted the data on SACMEQ’s request.

The Department of Basic Education is already aware of all of my concerns since I emailed a number of members of the Department’s research team drawing attention to these problems and cautioning against publishing any results until they could be rectified. It would seem that the Department has chosen to push ahead and report these problematic results to Parliament in spite of these numerous concerns.

Comments on the SACMEQ IV presentation to parliament:

  • The gains in the SACMEQ reading and mathematics scores between 2007 and 2013 are so unbelievably large that they would make South Africa the fastest improving education system in the world, together with Country 2 and Country 7 (names of other countries were excluded in the presentation to parliament. These countries improved by more than 0.9 standard deviations or 0,13 standard deviations per year. The improvement from 495 to 587 is an 18,5% improvement in test scores (or 2,7% improvement per year). A 2012 study looking at how fast education systems can improve points to Brazil which is the fastest improving education system in any testing system. Yet the SACMEQ IV results presented to parliament would have us believe that South Africa (and Country 2 and Country 7) improved at least twice as fast as Brazil, the fastest improving country. This is extremely extremely unlikely. (It is also unlikely that the teacher test scores have dropped so drastically). We know from other data (such as TIMSS 2003 and 2011) that South Africa has improved in Grade 9 mathematics but this improvement was only half as large as that reported by SACMEQ IV. South Africa’s scores may well have improved between 2007 and 2013 but we cannot say if they have improved or decreased until the results are actually comparable.
  • The fact that teacher test scores plummeted at the same time that student test scores soared should already make us very curious about the technical procedures that might lead to such a situation.

I think the best way forward is for the Department of Basic Education to issue a statement explaining whether they believe the SACMEQ III and IV results are comparable and why and whether these results were based on an earlier version of the data, one which has subsequently changed. And secondly for us to wait for the SACMEQ IV Technical report to be released by SACMEQ so that the procedures, methods and assumptions underlying the SACMEQ IV results can be scrutinised by researchers around the world. This is the reason that the TIMSS, PIRLS and PISA results are all only released at the same time as the full international report.

SACMEQ is an extremely important indicator of changes in reading and mathematics achievement over time. It’s reputation and technical credibility must be upheld for it to retain its position as the main cross-national testing system in the region. To do so, the methods and analysis must be above reproach and open to scrutiny by independent researchers.


Do you know an outlier township/rural school in KZN, LP or GP??

Color pencils representing the concept of Standing out from the crowd


So I have finally taken to crowd-sourcing in my research and I need your help!

Do you know of any ‘outlier’ or exceptional township or rural primary schools in either KZN, Limpopo or Gauteng? Schools that manage to succeed against the odds and achieve great learning outcomes.

In a new ESRC/DFID study we want to understand how these schools manage to get the results they do, and specifically to understand the school leadership and management characteristics in these schools. But first we need to identify these outlier schools. We’re trying a number of different approaches to identifying these schools and then triangulating the results.

So word or mouth or your first-hand experience with an exceptional township/rural school could really help us. If you have any suggestions please send me an email at NicholasSpaull[at]gmail.com with the name of the primary school and why you think it’s an outlier school and any contact info if you have it!

Looking forward to hearing from you!!

Nic