Today we launched a report we have been working on for the last 18 months: The Race between Teacher Wages and the Budget: The Case of South Africa 2008-2018 which I wrote with one of my doctoral students (Adaiah Lilenstein) and long time collaborator (David Carel). I include the abstract and executive summary below.
Abstract
In South Africa the wages of school-based personnel (teachers and teacher-managers) make up 3.5% of GDP, the largest single line item in the government budget. In this paper, we analyze a decade’s worth of publicly available data on expenditure, collective bargaining agreements, teacher demographics, and learner enrolment. We show that discounting historical educational expenditures using CPI is naïve when wages make up approximately 80% of the education ‘price basket’ purchased by government. To remedy this we create a sector-specific Basic Education Price Index (BEPI) for South Africa that is weighted by the real cost drivers in education (i.e. ~80% wages and ~20% CPI). Using BEPI we find that there has been a -2.3% decline in real per-learner expenditure over the period 2009-2018 with much larger declines seen in the Free State (-13%), Limpopo (-13%) and the North West (-11%).


Despite a rise in fertility and subsequent enrolment over the period we show that only 30% of the decline is due to the rise in enrolment while 70% is due to the rise in wages. The two main impacts of this real decline in purchasing power is that class sizes have increased and hiring freezes have been implemented. Analysis of government payroll extracts from 2012 and 2016 shows that nationally there were fewer teachers employed (-2%), fewer principals employed (-9%), fewer deputy-principals employed (-8%) and fewer Heads of Department (HODs) employed (-7%), despite there being only -2% fewer schools in 2016 compared to 2012. In Limpopo alone, there were -23% fewer deputy principals in 2016 compared to 2012.
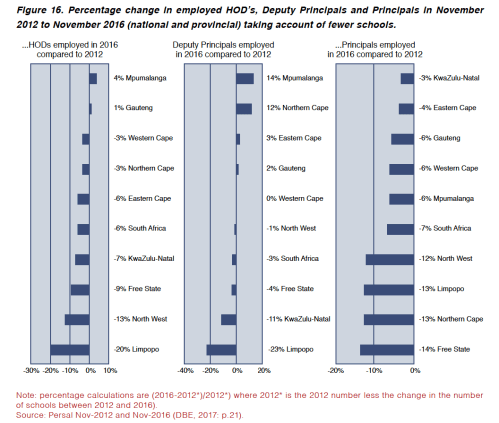
It is uncanny how similar the declines are in per-learner spending between 2009 and 2018 to the declines in the number of principals employed between 2012 and 2016 (the years for which we have PERSAL data). In the Free State per-learner spending declined by -13%, principal posts declined by -14%. In Limpopo per-learner spending declined by -13%, principal posts declined by -13%. In the North West per-learner spending declined by -11%, principal posts declined by -12%.
We conclude by making the case for BEPI being used when analyzing expenditure trends and projections in education. The argument presented throughout the paper is not that educator salaries should not have increased, but rather that there has been a disconnect between government budget allocations and wage and benefit agreements. The longer that wage and benefit increases outpace overall budget increases, the greater the consequences for the education system. Wages must be contained, or educational expenditures must rise, but the status quo is not sustainable for the long-term health of the education system.
Executive Summary
The aim of the present analysis is to determine how the real resources available to the average child in South Africa have changed over the period 2008 to 2018. In order to do so the paper makes the argument that existing measures of discounting educational expenditures, notably using the Consumer Price Index (CPI) are inadequate, and in our view, incorrect. They drastically over-estimate the rise in real spending on education and do not take into account the overall rise in enrolments resulting from an unusual birth-spike in 2005. Furthermore, such an approach cannot explain why there has been a simultaneous rise in “real spending” coinciding with the widespread implementation of hiring-freezes, a well-known cost-cutting measure implemented by provinces.
To remedy this, we develop the Basic Education Price Index (BEPI) which uses the prices of the real cost drivers of education in South Africa and weights them in the same proportion as that which makes up actual expenditures in the budget (Estimates of Provincial Expenditure and Revenue). Because educator wages – that is, teachers, school managers and administrators – make up approximately 80% of the education budget, changes in educator wages should be used when discounting historical educational expenditures. Put simply, we ask how much it costs to employ 100 teachers in 2008 and 100 teachers in 2018, rather than how the prices of an average basket of consumer goods (CPI) changed over the period (CPI). We argue for a method that uses the actual cost drivers in education and weights the price-basket in the same proportions as they are found in the budget, approximately 80% personnel and 20% non-personnel. Using this new and more appropriate measure, shows that real per-learner spending in South Africa has shrunk by -2,3% between 2009 and 2018, with much higher figures in some provinces.
The five main findings of the paper can be summarized as follows:
- Clear evidence of a fiscal squeeze: Provinces are clearly facing a ‘fiscal squeeze’ where increases in teacher salaries have outpaced increases in budget allocations to education. While this has led to declines in real per learner spending of -2.3% nationally, this is considerably higher in the Free State (-13%), Limpopo (-12,5%) and the North West (-11%) between 2009 and 2018.
- Provinces coping using hiring freezes: Provinces seem to be ‘coping’ with this squeeze by implementing cost-saving measures such as hiring freezes and leaving vacant posts unfilled. Unsurprisingly these hiring freezes are largest where the real per-learner declines are greatest. Importantly, hiring freezes are disproportionately affecting school management posts rather than regular teaching posts, although there has been a decline in the latter as well. It is uncanny how similar the declines are in per-learner spending between 2009 and 2018 to the declines in the number of principals employed between 2012 and 2016 (the years for which we have PERSAL data). In the Free State per-learner spending declined by -13%, principal posts declined by -14%. In Limpopo per-learner spending declined by -13%, principal posts declined by -13%. In the North West per-learner spending declined by -11%, principal posts declined by -12%.
- Historical overestimation of spending on education: We show that any historical analysis that uses CPI to discount educational expenditures overestimates the real spending on education since the real cost drivers have, especially teacher salaries, have been increasing much faster than CPI. In South Africa a traditional approach of using CPI as the discount rate leads one to conclude that ‘real’ aggregate educational expenditures have increased by 42% between 2008 and 2018, when in fact they have only increased by 8% when using the correct discount rate. Furthermore, when comparing 2009 and 2018 using CPI-discounted figures the aggregate increase was 30% when in actual fact it was only 3% when using the correct discount rate. This is primarily because the vast majority of additional educational spending over this period has simply been on paying existing teachers more, rather than hiring more teachers or buying more non-personnel resources.
- Per-learner figures vs aggregate figures: Much of the existing literature and government reporting is at the aggregate level. Yet the meaningful unit of analysis is the child – what is available to the average child in South Africa? While this may not matter if a population is stable over time, a situation of rising births (as in South Africa) means that resources are being spread over a larger number of children than before. This makes a considerable difference to the conclusion. Between 2009 and 2018 real expenditure on education rose by 3% when looking at the aggregate level and fell by -2.3% when looking at the per-learner level (both using real cost drivers). While there was slightly more money (+3%) being spent on education in 2018 compared to 2009 when looking in the aggregate, for the average child there was slightly less money being spent on them in 2018 compared to 2009.
- Significant inter-provincial variation in spending per child: It is clear that some provinces spend more public money per child than others, despite alleged equal funding per child in the national funding formulas. For example, Gauteng spent R2,500 more per child per year compared to KwaZulu-Natal or Limpopo (R20,037 in Gauteng compared to R17,563 in KwaZulu-Natal and R17,503 in Limpopo in 2018).
Finally, we argue that the national government has agreed to higher teacher wages and benefits without budgeting for those increases, and in the process undermined the education system. This has led to a host of unintended consequences. Provincial departments experiencing salary increases that have outpaced their budget increases have attempted to deal with the subsequent fiscal squeeze by implementing hiring freezes and allowing class sizes to rise. Payroll data shows that even after accounting for a small decline in the number of schools, there are -7% fewer principals employed in 2016 compared to 2012. In the three most severely affected provinces the declines in employed Principals, Deputy Principals and HODs range from -13% to -23% when comparing 2012 and 2016.
The main contribution of the paper, to both the research literature on South African education, and also to policymakers, is to help explain the conundrum of the co-existence of widespread hiring freezes and the alleged rising per-learner spending on education (using CPI as a deflator). The answer to this conundrum is that CPI is the wrong deflator for education – both in South Africa and internationally. When using the correct deflator (the Basic Education Price Index) there is a logical explanation behind both increases in class sizes and the implementation of hiring freezes. The provincially devolved nature of South African spending provides further corroborating evidence. Provincial disaggregation of spending trends and hiring freezes shows quite clearly that those provinces experiencing the largest declines in real per learner spending are also the ones who have the highest number of vacancies. This is not a coincidence. For those researchers who are unconvinced that BEPI is the correct discount rate, and instead believe that real education expenditures have been increasing monotonically for the last decade, we ask the following question: If real educational expenditures per learner have been rising over this period, why is it that provinces are implementing hiring freezes?
Finally, we argue that government officials from the National Treasury and the Department of Basic Education need to take account of the dynamics presented in this paper when entering wage negotiation agreements with teacher unions. While many of the choices made in such negotiations are necessarily political, it is fair to ask government to acknowledge the trade-offs and costs in their decisions and to make those trade-offs and decisions public.
The full paper is available here.