Category Archives: Education

“SA education is not the worst in the world” – BD op-ed

Is SA’s schooling system the “worst in the world”? Earlier in 2023 the Centre for Development and Enterprise (CDE) released a series of reports claiming that it was. It argued that “we are either last or in the bottom three countries” and that we have “one of the worst-performing education systems in the world.” This is simply not true.

There are 193 countries in the world and SA — to its credit — is one of the few that chooses to participate in global assessments such as the Progress in International Reading Literacy Study (Pirls grade 4) or the Trends in International Mathematics and Science Study (TIMSS grade 5 and 9). The CDE report was quick to claim that we came “last” but slow to acknowledge that only 40 countries wrote the test and only 13 were middle-income countries.

So, of the 193 countries of the world, only 20% wrote the Pirls test, with 150-odd countries not participating. It is true that we perform worse than some poorer African countries such as Kenya, Mauritius and the Seychelles, but 75% of African countries do not participate in that assessment (Seacmeq: the Southern and Eastern Africa Consortium for Monitoring Educational Quality), and judging by other education data, SA would almost certainly perform better than most of these, as it should.

We love to compare SA to Kenya or Zimbabwe, lamenting how bad our education system is compared to theirs. But we need some perspective.

In 2018 less than 10% of Zimbabwean children completed high school, with about 40% in Kenya and 50% in SA. By 2022 that figure was 62% in SA. We won’t talk about the Seychelles because it has only 100,000 people. That is the population of Kroonstad. When it comes to higher education there is no contest, with the top five universities on the continent all in SA (the universities of Cape Town, Stellenbosch, the Witwatersrand, Johannesburg and Pretoria).

A lot of people rightly point to the superficiality of rankings. So how have we done historically on the most important indicator — learning outcomes?

The Human Sciences Research Council has shown that SA’s improvement in maths and science at grade 9 level between 2003 and 2015 was the largest of all participating countries in TIMSS over that period. Similarly in reading, between 2011 and 2016 SA was the fastest improver among Pirls countries, with similar gains in Sacmeq.

Of course, SA is starting from a low base, yet this is nevertheless an impressive achievement. For a decade we were one of the fastest-improving countries among those who measure their systems. The pandemic was a major setback for this trajectory of improvement, and the losses cannot be overstated. Without targeted catch-up interventions to remediate these learning losses, we will see a “lost generation”.’

Most South Africans also do not know that we have the second-most comprehensive school feeding system in the world. Only Brazil feeds a higher proportion of its schoolchildren. Every weekday 9-million children in SA receive a free meal at school. This achievement is notwithstanding the KwaZulu-Natal school feeding scandal earlier in 2023.

This lasted for less than one month. At the start of the school term on 12 April 2023 it was clear there was a problem, with widespread media coverage and public outrage. Before the end of April the problem was resolved and the dodgy tender was terminated. Of course, it would have been better had there been no lapse in the first place, but this looks a lot like working institutions in a functioning democracy.

It is important to highlight that when the government sets its mind to something — as the minister did with universalising free learner Workbooks or free school meals —  it can successfully implement bold programmes that reach into every school and improve learning outcomes. When 50% of children in no-fee schools do not know the letters of the alphabet by the end of grade 1, and 81% of grade 4s cannot read for meaning in any language, it’s clear to me that we need a laser focus on reading in the early grades.

Pretending there is nothing good to work from in SA leads to energy-sapping despair. Yes, we are far below where we should be given our level of economic development and spending on education. We also perform worse than many comparator countries, yet claims that we are the “worst in the world” are misleading, incorrect and unhelpful.

• Nic Spaull is an associate professor of economics at Stellenbosch University

This article first appeared in the Business Day on the 28th of July 2023.

Carte Blanche episode on SA’s Reading Crisis

This 13min Carte Blanche episode was aired on 30 April 2023.

10 Main Findings from PIRLS 2021 South Africa

On Tuesday the 16th of May 2023 the Progress in International Reading Literacy Study (PIRLS) released the findings from their 2021 survey. South Africa was one of 57 countries and regions that participated. is an independently administered, nationally representative assessment of reading comprehension among a sample of Grade 4 learners in South Africa. In 2021 the survey included 321 primary schools and tested 12,426 Grade 4 students between August to November 2021. South Africa has participated in PIRLS four times (2006, 2011, 2016 and 2021). The tests are set by the International Association for the Evaluation of Educational Achievement (IEA) and implemented in South Africa by the Center for Evaluation and Assessment (CEA) at the University of Pretoria. The tests are comparable over time and across countries, with all tests translated into the official languages of each country. In South Africa all 11 languages are tested. Children are tested in Grade 4 in whatever the language of instruction is from Grades 1-3 in the school (i.e. an isiZulu learner in an isiZulu school in KZN would write the test in isiZulu).  The SA 2021 Highlights Report is available here and the International 2021 Report is available here.

Here are the 10 main findings in my opinion (also in PDF here):

(1) In 2021 81% of Grade 4 learners cannot read for meaning in any language, up from 78% in 2016.

This means that only 19% of South African Grade 4 children could read for meaning in any language in 2021 (all 11 languages were assessed). Because PIRLS is a nationally-representative sample, of the 1,127,877 Grade 4 students in 2021, 914,000 could not read for meaning in any language. SA’s PIRLS score dropped from 320 (2016) to 288 (2021), approximately 0,8 years of learning.

(2) We have lost a decade of progress.

Between 2006 and 2016 the percentage of children that could not read declined from 87% (2006) to 82% (2011) to 78% (2016), but has now increased back to 81% (2021), wiping out a decade of slow progress and taking us back to 2011 levels of achievement.

(3) SA came last of all 57 countries, with the largest decline between 2016 & 2021.

South Africa had the lowest average Grade 4 test score of all participating countries. Of the 57 countries/regions, 33 had trend data from 2016 to 2021. Of those with trend data, South Africa experienced the largest decline in learning outcomes between 2016 and 2021.

(4) The average Gr4 child in SA in 2021 was 80% of a year behind their counterpart in 2016

SA’s PIRLS score dropped from 320 (2016) to 288 (2021). Given that approximately 40 points is equal to one year of learning, this is approximately 0,8 years of learning that we’ve lost on average.

(5) Northern rural provinces experienced the largest declines in reading.

Four provinces experienced declines of more than a full year of learning between 2016 and 2021. Given that 40 points amounts to one year of learning, this was as follows: North West (-2,4yrs), Free State (-1,6yrs), Mpumalanga (-1,2yrs) and Limpopo (-1yr). The three coastal provinces (WC, KZN and EC) experienced the smallest declines with WC showing the smallest decline (-0,4yrs).

(6) English and Afrikaans schools did not experience a decline between 2016 and 2021.

In comparison, most African language schools did decline, highlighting that the pandemic increased inequality between no-fee and fee-charging schools. (Note that the marginal increase in average scores for English and Afrikaans LOLT schools between 2016 and 2021 is not statistically significant. We do not yet have the standard errors for provincial averages since the DBE has not released the full South Africa PIRLS 2021 report (despite having access to it).

(7) Brazilian Grade 4’s are 3 years ahead of South African Grade 4’s.

The average score in Brazil was 419 points in 2021 compared to South Africa’s 288 points. The average Grade 4 child in South Africa is 3,3 years behind the average Brazilian Grade 4 child. In Brazil 61% of Grade 4’s could read at a basic level in 2021 compared to 19% in South Africa. Note that Brazil and South Africa have roughly the same GDP/capita ($7000/capita). See my Business Day op-ed on what we can learn from Brazil here.

(8) SA had the largest gender gap (pro-girl) of all 57 participating countries/regions, with SA girls 1,5 years ahead of SA boys.

The average Grade 4 girl in South Africa scored 57 points higher than the average Grade 4 boy, placing them about 1,5 years of learning ahead of their male counterparts. While girls outperform boys in all countries, the South African gap is more than twice the international average gap between boys and girls.

(9) SA does not currently have a credible or budgeted plan to catch up learning losses, despite experiencing the largest decline between 2016 and 2021.

It should be noted that PIRLS 2021 is the first nationally representative indication of learning losses to dateTo quote a recent research report reviewing DBE’s interventions relating to COVID-19 “There has been no attempt to recoup time in order to remediate learning losses, apart from very recent attempts in one province. The insistence on a largely business-as-usual approach to curriculum implementation fails to recognise and address the severe educational impact of the pandemic, especially on learners in the poorest communities (Hoadley, 2023: p.1). By contrast, many countries have multi-billion rand catch-up programs, for example Colombia’s PROMISE program (R3,5-billion), the Indian state of Gujarat’s GOAL initiative (R9,5-billion),  the Recovering Learning Losses program in northern Brazil (R4,8-billion), or the R7,3-billion ‘2023 Plan de Ractivación Educativa’ in Chile announced last month, acknowledging it will take at least four years to catch up the learning losses from COVID-19. Only one province (WC) has so far announced a budgeted plan for catching up learning losses (WCED’s R1,2bn ‘Back on Track’ program).

(10) A ‘generational catastrophe’

The new PIRLS 2021 reveal what can arguably be referred to as a ‘generational catastrophe.’ More than 4-million children in primary school have experienced more than half their schooling career in a disrupted state (either school closures or rotational timetables). Research on school closures from natural disasters like earthquakes in Pakistan and the Ebola crisis in West Africa all show that there are long term consequences to short term crises. These include lower educational attainment, lower earnings, higher unemployment and being more likely to be in lower skilled occupations in adulthood. This effect might even carry over to the children of the children affected by school closures, as happened with school closures in Argentina.

What can be done?

Evidence-based interventions to catch up learning losses. South Africa has the benefit of numerous interventions that have been proven to raise learning outcomes, even in no fee schools and in poorer provinces. These have been summarized in a recent book published by Oxford University Press (Spaull & Taylor, 2022)

(1)   Recruiting, training and equipping youth to be Teacher Assistants. Teaching assistants help teachers deal with large classes and different learning levels of children. A successful program in Limpopo selected youth using numeracy and literacy tests, trained them for four days face-to-face per term, equipped them with workbooks to use and monitored and supported them with TA-mentors (see Makaluza & Mpeta, 2022). This resulted in substantial improvements to literacy and numeracy equivalent to more than 1 additional year of learning. The government’s Presidential Youth Employment Initiative (PYEI) Basic Education Employment Initiative (BEEI) has established the organizational, political and financial feasibility of operating a teacher assistant programme at scale. The Limpopo programme demonstrates that it is also feasible to meaningfully impact learning outcomes and provides a model for recruitment, training and mentoring to achieve that. Subsequent iterations of the PYEI / Jobs Fund program could incorporate these learnings to catch up learning losses.

(2)    Rolling out anthologies of graded readers to all grade 1-3 children. Most children do not have basic texts needed to learn how to read in their home language at school or at home. This can be remedied using low cost anthologies of graded readers that cost R15/book/child.  For a brief period of 2 years (2019 and 2020) the Eastern Cape Department of Basic Education rolled out anthologies of graded readers – essentially a set of about 20 sequenced stories aimed at teaching children to read in their home language. The program was evaluated and shown to improve reading outcomes in isiXhosa for the children who received them compared to previous cohorts in the same schools who did not (see Ardington & Spaull, 2022).

(3)   Training teachers face-to-face and equipping them with comprehensive workbooks and teacher guides: (Ardington, 2023). Research in Limpopo shows that equipping learners with workbooks and teachers with teacher guides, in addition to four days of face-to-face training per term led to a 60% of a year of learning increase compared to business-as-usual schools.

(4)   Using teacher-coaches to support teachers on how to teach reading. The DBE’s Early Grade Reading Study (EGRS) shows that reading outcomes of Grade 1-3 learners improve after at least 2 years of an expert reading coach supporting and visiting teachers in the schools.

//

PDF of the above is available here.

My Business Day article today on PIRLS 2021: “Look to Brazil”

About 2,000 years ago Stoic philosopher Seneca was tutoring a Roman emperor and offered him the following advice: “If a man knows not to which port he sails, no wind is favourable.” The lesson here concerns the importance of planning and having a goal to know where you’re going. Unfortunately, when it comes to early grade reading in SA we are a ship at sea without a port in sight or plan in hand.  

On Tuesday we learnt that in 2021 81% of SA grade 4s couldn’t read a few simple paragraphs in their home language and answer basic literal questions. This is according to the Progress in International Reading Literacy Study (Pirls), a grade 4 test that was administered in all 11 languages in SA (SA highlights report here, international report here).

It’s not as if this was just a pandemic thing — the SA illiteracy rate in the last Pirls (2016) was 78%. This high rate of grade 4 illiteracy is unique to SA, at least among middle-income countries. The latest survey showed far lower rates in countries such as Egypt (55%), Jordan (53%) and Brazil (49%), all of which wrote the same test, at the same time, in their own languages.

Another shocking finding was that grade 4s in SA were three years behind grade 4s in Brazil, a country we like to compare ourselves to, perhaps optimistically. Brazil is an interesting case. Under former president Jair Bolsonaro the education budget was slashed, and he scrapped a successful national literacy programme.

When Lula da Silva was re-elected president earlier in 2023, his first move was to reverse the budget cuts in education and appoint Camilo Santana as education minister. Santana was the governor of Ceará, one of the poorest states in Brazil, but also the fastest-improving state on reading outcomes over the past 20 years. Ceará moved from poverty pariah to poster child, with countries now sending delegations to understand how they managed to get 84% of grade 3s reading for meaning.

Just two decades before, 40% of grade 3s in the state couldn’t read a single word. Going further, three months ago Lula created a new presidential secretariat dedicated specifically to books and literacy. For us in SA this is a parable of what’s possible with a president who follows words with actions, and who appoints ministers who are relentless about well-defined goals. 

You will recall that in 2019 President Cyril Ramaphosa announced in his state of the nation address that early grade reading was one of his administration’s “top five priorities” and that “within the next 10 years … every 10-year-old will be able to read for meaning”.

This was then codified in the medium-term strategic framework as one of “five fundamental goals”, alongside halving violent crime, increasing employment, eliminating hunger and promoting economic growth. But a goal is not a plan. Four years on from those lofty words, where are we on reading?

There is still no national reading plan, and if anything things have got worse. We have no plan to retrain our teachers, eliminate extreme class sizes, or resource classrooms with the specific books and tools teachers need to teach reading (graded readers, story books, alphabet friezes, etc). Instead, we have a patchwork document that saw the light of day only in May, and then only in response to Carte Blanche’s Promotion of Access to Information Act request.

We have no plan to retrain our teachers, eliminate extreme class sizes, or resource classrooms with the specific books and tools teachers need to teach reading.

This shambolic document is a laundry list of 47 activities. There are a few good ideas, but most are random fluff, including my favourite: “Partnerships with big business to include reading materials in food packages (eg ‘Did you know?’ messages in Chappies).” You can’t make this stuff up.

The plan lists targets for each year from 2019-2024, none of which has been reached. This Reworked National Reading Sector Implementation Plan 2019-2024 was released (under duress) only  in May 2023, a year before it will expire. 

A credible plan comes with credible milestones, a credible budget, a credible team and accountable reporting to political superiors. We have none of those things. Much of the department of basic education’s work on reading is outsourced to the National Education Collaboration Trust (NECT), a quasi-governmental project management office reporting to the director-general and minister. In part this is because the department itself is too slow or unable to execute the wishes of the minister.

The NECT has some good people working for it, but is under-capacitated and under-budgeted for the mandate it seems to have acquired. You cannot retrain 120,000 grade R to grade 3 teachers with a R37m budget, or even a R370m budget for that matter. To provide a sense of scale, we are spending R294bn on basic education in 2023, about 5% of GDP.

One province by itself, the Western Cape, is spending R400m in 2023 on Covid catch-up alone. The NECT, by contrast, is tasked with doing everything under the sun, including technology, maths, science, matric, reading, primary schools, high schools and Covid catch-up. 

Coming back to our stoic philosopher, it would seem as if the department has reframed the quote to be more palatable: “If a man knows not what harbour he seeks, any wind is favourable.” So, any activities, big or small, we’re here for you. Chappies partnerships, working with 150 schools here, 1,000 school libraries there, mobilising “Read to Lead” and encouraging teachers to “Drop all And Read”.

The problem with all this chatter is that it lacks prioritisation, it lacks accountability and it lacks budget. The presidency has been loath to hold ministers accountable for tangible, objectively verifiable progress towards a limited number of goals.  

We should heed the advice of history. That emperor was Nero, and he ignored Seneca’s advice. In fact, Nero forced him to commit suicide and went on to kill his own mother before burning the city of Rome. It’s where we get the expression “Fiddling while Rome burns”.

This feels especially apt when looking at the mess of 81% of grade 4s being unable to read for meaning, with no plan and no political will to get us out of it. And so, all I can say is: where’s the plan, minister Motshekga? And President Ramaphosa, are you a man of action like Lula, or does your word mean nothing?

This article first appeared in the Business Day on 18 May 2023.

Progress is possible! The Funda Wande Limpopo RCT Results (Feb’23)

Last week Funda Wande released the midline evaluation of their Limpopo Randomised Control Trial, evaluated by Prof Cally Ardington from UCT. In essence the intervention is 120 schools split into 3 arms of 40 schools each: a control arm, a Materials+training arm, and Materials+training+Teacher-Assistant arm (each teacher received a full-time Teacher Assistant). Although the graphic says “Materials only” – the report shows that actually there was also centralised teacher training (of 4 days per term – 2 for literacy and 2 for numeracy).

The intervention is both a literacy intervention (Funda Wande) and a numeracy intervention (Bala Wande) with the same learners, teachers and schools. The results are incredibly encouraging with a 0,5 standard deviation increase in both reading and mathematics after two years of intervention in the Materials+Training+TA arm. That means that this intervention represents the largest gains we’ve seen in foundational literacy and numeracy in South Africa to date. We can see the gains in terms of standard deviations. But in their presentation to the 2030 Reading Panel, Prof Ardington and Dr Makaluza show the changes in outcomes realtive to the DBE’s new language-specific and grade-specific reading benchmarks.

While the 39-page evaluation report is rich in detail, one of the areas that really stood out to me was the increase in workbook coverage in both the LTSM+Training arm and the LTSM+Training+TA arms:

This intervention shows that unemployed youth, when they are recruited properly (literacy and numeracy tests among other things), trained properly, and supported properly (they have TA mentors), they can have a big impact on reading outcomes in the classroom.

For those interested in what components of reading and mathematics were tested, and how large the impacts were across the treatment arms, these are also in the report and included below:

We have a lot of shit going on in South Africa at the moment. We have ministers coming and going. The power is coming and going. The political winds seem to be more like a series of squalls rather than anything predictable or helpful. And this is all before the 2024 election when everything will get even more uncertain. Yet even in these turbulent times, it is encouraging to note that there are schools and teachers and youth that can pull together and with the right support, training and materials can lead to large improvements in reading outcomes for the young children in their charge.

Congratulations to Dr Nwabisa Makaluza and the entire Limpopo Funda Wande team who ran and implemented this intervention, and to Prof Cally Ardington who has conducted an incredibly useful evaluation of the intervention.

“The arc of the moral universe is long, but it bends towards justice.” – MLKJ

2023 Reading Panel


On the 7th of February we held the second 2030 Reading Panel meeting. The Panel is comprised of 18 respected South Africans who meet annually to review progress towards the Presidential goal of “All South African children being able to read for meaning by age 10 by 2030”, and provides implementable systemic recommendations to government.

Key findings from the 2023 Background Report launched on 7 February 2023:

  1. 82% of SA Grade 4 kids can’t read, up from 78% pre-pandemic: Before the pandemic it was estimated that 78% of Grade 4 learners could read for meaning (PIRLS 2016), new research based on learning losses in the Western Cape suggests that this has risen to 82% as a result of COVID-19 school closures and rotational timetables.
  1. It will take SA 86 years on our current trajectory to reach 95% of children reading for meaning, i.e. the year 2108.
  1. Pandemic has erased a decade of progress, sending us back to 2011. In 2016 22% of Grade 4 children could read for meaning in SA according to PIRLS. Due to COVID-19 it is estimated that now only 18% can read for meaning, the same level as in 2011, erasing a decade of progress in reading outcomes.
  1. 50% of children in no-fee schools do not learn the letters of the alphabet by the end of Grade 1. New research from Limpopo, the Eastern Cape and the North West published in December 2022 shows that less than 50% of children in no-fee schools learn all the letters of the alphabet by the end of Grade 1.
  1. There is currently no National Reading Plan and no national budget for reading. Although the Director General has made reference to a ‘National Reading Plan’ in parliament, no such document exists in the public domain or has been seen by stakeholders. There is also no national budget for improving home-language reading.
  1. Western Cape & Gauteng are both spending more than R100-million over three years to improve reading, the only provinces to do so. The Western Cape is investing in a Reading for Meaning program for Grades 1-3 (2023-2025, R111mil) and Gauteng in their Grade R Program (2022-2024, R107-mil). These are the only provinces to allocate significant budgets to reading (although the Gauteng intervention is 80% donor funded).
  1. Government has spent over R25-billion on PYEI, including Educator Assistants (EA), 10% of which are Reading Champions. As part of its COVID response the Presidency Youth Employment Initiative (PYEI) has employed over 850,000 youth on temporary contracts. It is estimated that 250,000 youth will be appointed in 2023 & approximately 30,000 will be Reading Champions. Although this is a welcome addition, there is currently no face-to-face training for these youth and the only requirement is that they must have passed matric.
  1. Twice as many children learnt to read in Limpopo after a 2-year intervention with trained teacher assistant and new reading workbooks. A new evaluation of the ‘Funda Wande’ intervention in Limpopo (2021-2022) showed that twice as many children learnt to read in the intervention schools (34%) compared to children in comparable schools who did not receive the intervention (18%), the largest gains seen in SA to date. (Full Feb’23 evaluation report here).

The panel found that almost no progress had been made on the 2022 recommendations and therefore reiterated the four recommendations from 2022 and added two more:

  1. Measuring what matters: implementing a universal standardized assessment of reading at the primary school level
  2. Moving from slogans to budgets: allocating meaningful budgets to reading resources and reading interventions not only talking about them
  3. Providing a minimum set of reading resources to all Foundation Phase classrooms (Grade R-3) as a matter of urgency.
  4. A university audit of pre-service teacher education programs.
  5. To publish a National Reading Plan and the budget for its implementation
  6. To improve the implementation of the Presidential Youth Employment Initiative

The full 2023 Background Report is available on the Reading Panel here and advisory notes on the reading panel website: https://www.readingpanel.co.za/resources

This week we published 3 Open Access books on Early Grade Reading, Mathematics and Interventions in SA :)

There are lots of things that are wrong with South Africa at the moment. As I type this our parliament is in the process of deciding whether President Ramaphosa should be subject to an impeachment inquiry. But even when things are dark (literally), and the prospects for improvement are dim, South Africa still has a lot of things going for it. I’ll mention just one of them: a thriving community of scholars who give a shit about the country, who want to do impactful research, and who really care about improving the life chances of poor kids. Not many people know that before COVID hit, South Africa’s learning outcomes were improving quickly. That is to say they were both improving and terrible at the same time – they are not mutually exclusive. This week Oxford University Press published three volumes on (1) Early Grade Reading, (2) Early Grade Mathematics, and (3) Early Grade Reading and Mathematics Interventions. A few years ago a few of us were discussing progress in reading and mathematics outcomes and we all agreed that we know so much more today than we did in 2010. In some areas (TVET and housing, for example) we know almost nothing more in 2022 than we did in 2010. Things are bad and we don’t really know how to improve them at scale. In early grade reading and mathematics things are different. We have much more data now, we have a whole wave of new research and (excitingly) new researchers. We decided that we should write a book to try and document what we now know at the end of the first decade. We quickly realised that it wouldn’t fit into one volume, and so now we have three! Although I suppose I was the chief cat-herder across the volumes, the entire series was a collaborative effort. The folk at Oxford University Press (Megan, Marisa, Ashley and the copy-editors) were efficient, professional, flexible and passionate about the project. Our excellent editorial assistant (Jess Qvist) made sure that no ball remained dropped for too long. My co-editors Lilli, Stephen, Hamsa and Nicky were exactly what you want in academic colleagues – smart, funny, friendly, punctual, and always ready to call you on your bullshit. It’s such a nice way to close off the year to see the books in print, and also as Open Access ePDFs which are free to download. Of course nothing is ever the final word and research is an iterative process so we look forward to everyone’s comments and critiques and will most certainly have an in-person launch event in the new year!

For now you can download all three volumes here.

Preface

“Collectively the three books bring together 77 authors from disciplines including economics, linguistics, literacy studies, mathematics education, teacher education, and policy studies. Although their domains and methods of analysis may differ, all authors grappled with the same underlying question: why is it that so few young children in South Africa acquire the building blocks of reading and mathematics in the first years of school? While international large-scale assessments have drawn increasing attention to learning outcomes at the primary school level, there is now a broad-based consensus that the roots of the problem lie even earlier than upper primary school. International assessments like PIRLS and TIMSS show that 60–80% of Grade 4 and 5 learners cannot read for meaning or calculate using the four operations, but emerging research documented in these volumes highlights that more than 50% of learners at the end of Grade 1 do not know all the letters of the alphabet, and cannot add and subtract single-digit numbers.

It is this challenge that animates the research across these three volumes, with an analytic focus on lessons learnt in the last decade (2010–2022). While learning outcomes in South Africa before the Covid-19 pandemic were improving quickly by international standards, the chapters included here present evidence for both optimism and alarm. Optimism because system-wide improvements do not happen accidentally or in a vacuum. Alarm because in 2022 it is still the case that the dignity and life-chances of millions of children in South Africa are foreclosed because they do not learn to read for meaning, or do mathematics with understanding in the first three years of school.

As a group of scholars committed to understanding and documenting the roots of both blockages and breakthroughs in reading and mathematics, it is our hope that you, the reader, find this new research interesting, helpful, generative, and challenging.”

Financial Mail Education Op-Ed on Budget 2021…

  • Nic Spaull & Adaiah Lilenstein

Let us start our foray into this year’s education budget by considering blessings and curses. Given the times that we are in there is one English ‘blessing’ that is especially apt: “May you live in interesting times.” It’s also claimed that this is actually a traditional Chinese curse, and that life is better during “uninteresting times” of peace and prosperity than in “interesting” ones which are usually times of trouble. However you spin it, we are in very interesting times.

In the 2021 budget, public sector wages make up R650-billion or a third of the total budget. Because there are more teachers (407,000) than any other kind of public servant, teacher salaries are the largest single line item in the entire budget and make up a third (R208-billion) of all public sector wages.  That’s 4,1% of GDP. For the second year teacher salaries in South Africa will decline in real terms. The 2021 budget showed that salaries in basic education increased by only 1.4% (from R205-billion to R208-billion), and given that inflation was about 3,3% in 2020, that’s a 1.9% decline in real terms. That sounds like a bad thing, but it’s worth putting this in historical perspective – both politically and economically.

Exactly one year ago, the Confederation of South African Trade Unions (COSATU) threatened to “collapse the public service” and “part ways” with government if Treasury did not honor it’s 7% wage increase. Treasury explained that it could not fulfill other constitutional obligations if it honored that wage agreement, and argued for a public sector wage freeze (the one it then implemented). The courts agreed with Treasury, but the judgement is under appeal in the Constitutional Court (see p.32). As much as the 2021 Budget fuss has been about other issues like provisions for vaccines and higher sin taxes, the real story is the ongoing implementation of the public sector wage freeze.  Public sector wages are the left, right, and center of government spending, government debt, and government’s ruling alliance with COSATU.

In a research paper we released last year we found that between 2008 and 2019 teacher wages increased by an average of 9,2% per year while average inflation was only 6,3% per year.  The only way provinces have coped with higher salaries is to implement hiring freezes leaving schools without principals and heads of departments.

Perhaps this is all a bit abstract for some readers, so let’s talk about monthly salaries. What do teachers actually get paid in South Africa? The common perception is that teacher’s salaries are low. What does the data say? A paper published last year  using government payroll data shows that the average teacher in South Africa was paid about R42,700 a month (including benefits), and the total package for teachers 50 years and older was R47,874 per month or about R575,000 a year (see figure). This is not to say that teachers are overpaid, but rather to highlight that teacher salaries have increased dramatically over the last 10 years, and thus the halt in salary increases along with other wages in the public sector is apt.

Figure 1: Monthly teacher pay in South Africa according to 2019 government payroll data

(Source: Gustafsson & Maponya, 2020)

In our view, given the circumstances in South Africa – not only the need to fund vaccines and their rollout, but also to address chronic unemployment and hunger – it is fair and reasonable to implement a wage freeze. The unemployment rate for those aged 15-24 years is now 63% according to the latest StatsSA survey. While we do need more money to go into education, it is not in the form of further salary increases for teachers. Class sizes are set to expand, and pressure on non-personnel spending (like books) is also rising. We need to hire and train unemployed youth-with-matric as Teacher Assistants (R3,600 per month) and make sure all kids have books. These TA’s can be allocated to primary school teachers throughout the country with a special focus on early grade reading and mathematics, thus helping to manage large class sizes and employing 400,000 youth. It’s time to pivot from our old strategy of salary increases for the well-paid and prioritise those who are actually marginalised in society.

This article first appeared in the Financial Mail on the 25th of February 2021

[New paper] The Race between Teacher Wages and the Budget: 2008-2018

Screen Shot 2020-06-19 at 16.16.10

Today we launched a report we have been working on for the last 18 months: The Race between Teacher Wages and the Budget: The Case of South Africa 2008-2018 which I wrote with one of my doctoral students (Adaiah Lilenstein) and long time collaborator (David Carel). I include the abstract and executive summary below.

Abstract

In South Africa the wages of school-based personnel (teachers and teacher-managers) make up 3.5% of GDP, the largest single line item in the government budget. In this paper, we analyze a decade’s worth of publicly available data on expenditure, collective bargaining agreements, teacher demographics, and learner enrolment. We show that discounting historical educational expenditures using CPI is naïve when wages make up approximately 80% of the education ‘price basket’ purchased by government. To remedy this we create a sector-specific Basic Education Price Index (BEPI) for South Africa that is weighted by the real cost drivers in education (i.e. ~80% wages and ~20% CPI). Using BEPI we find that there has been a -2.3% decline in real per-learner expenditure over the period 2009-2018 with much larger declines seen in the Free State (-13%), Limpopo (-13%) and the North West (-11%).

Screen Shot 2020-06-19 at 17.02.36

Screen Shot 2020-06-19 at 17.04.18

Despite a rise in fertility and subsequent enrolment over the period we show that only 30% of the decline is due to the rise in enrolment while 70% is due to the rise in wages. The two main impacts of this real decline in purchasing power is that class sizes have increased and hiring freezes have been implemented. Analysis of government payroll extracts from 2012 and 2016 shows that nationally there were fewer teachers employed (-2%), fewer principals employed (-9%), fewer deputy-principals employed (-8%) and fewer Heads of Department (HODs) employed (-7%), despite there being only -2% fewer schools in 2016 compared to 2012. In Limpopo alone, there were -23% fewer deputy principals in 2016 compared to 2012.

Screen Shot 2020-06-19 at 17.04.49

It is uncanny how similar the declines are in per-learner spending between 2009 and 2018 to the declines in the number of principals employed between 2012 and 2016 (the years for which we have PERSAL data). In the Free State per-learner spending declined by -13%, principal posts declined by -14%. In Limpopo per-learner spending declined by -13%, principal posts declined by -13%. In the North West per-learner spending declined by -11%, principal posts declined by -12%.

We conclude by making the case for BEPI being used when analyzing expenditure trends and projections in education. The argument presented throughout the paper is not that educator salaries should not have increased, but rather that there has been a disconnect between government budget allocations and wage and benefit agreements. The longer that wage and benefit increases outpace overall budget increases, the greater the consequences for the education system. Wages must be contained, or educational expenditures must rise, but the status quo is not sustainable for the long-term health of the education system.

 Executive Summary

The aim of the present analysis is to determine how the real resources available to the average child in South Africa have changed over the period 2008 to 2018. In order to do so the paper makes the argument that existing measures of discounting educational expenditures, notably using the Consumer Price Index (CPI) are inadequate, and in our view, incorrect. They drastically over-estimate the rise in real spending on education and do not take into account the overall rise in enrolments resulting from an unusual birth-spike in 2005. Furthermore, such an approach cannot explain why there has been a simultaneous rise in “real spending” coinciding with the widespread implementation of hiring-freezes, a well-known cost-cutting measure implemented by provinces.

To remedy this, we develop the Basic Education Price Index (BEPI) which uses the prices of the real cost drivers of education in South Africa and weights them in the same proportion as that which makes up actual expenditures in the budget (Estimates of Provincial Expenditure and Revenue). Because educator wages – that is, teachers, school managers and administrators – make up approximately 80% of the education budget, changes in educator wages should be used when discounting historical educational expenditures. Put simply, we ask how much it costs to employ 100 teachers in 2008 and 100 teachers in 2018, rather than how the prices of an average basket of consumer goods (CPI) changed over the period (CPI). We argue for a method that uses the actual cost drivers in education and weights the price-basket in the same proportions as they are found in the budget, approximately 80% personnel and 20% non-personnel. Using this new and more appropriate measure, shows that real per-learner spending in South Africa has shrunk by -2,3% between 2009 and 2018, with much higher figures in some provinces.

The five main findings of the paper can be summarized as follows:

  1. Clear evidence of a fiscal squeeze: Provinces are clearly facing a ‘fiscal squeeze’ where increases in teacher salaries have outpaced increases in budget allocations to education. While this has led to declines in real per learner spending of -2.3% nationally, this is considerably higher in the Free State (-13%), Limpopo (-12,5%) and the North West (-11%) between 2009 and 2018.
  2. Provinces coping using hiring freezes: Provinces seem to be ‘coping’ with this squeeze by implementing cost-saving measures such as hiring freezes and leaving vacant posts unfilled. Unsurprisingly these hiring freezes are largest where the real per-learner declines are greatest. Importantly, hiring freezes are disproportionately affecting school management posts rather than regular teaching posts, although there has been a decline in the latter as well. It is uncanny how similar the declines are in per-learner spending between 2009 and 2018 to the declines in the number of principals employed between 2012 and 2016 (the years for which we have PERSAL data). In the Free State per-learner spending declined by -13%, principal posts declined by -14%. In Limpopo per-learner spending declined by -13%, principal posts declined by -13%. In the North West per-learner spending declined by -11%, principal posts declined by -12%.
  3. Historical overestimation of spending on education: We show that any historical analysis that uses CPI to discount educational expenditures overestimates the real spending on education since the real cost drivers have, especially teacher salaries, have been increasing much faster than CPI. In South Africa a traditional approach of using CPI as the discount rate leads one to conclude that ‘real’ aggregate educational expenditures have increased by 42% between 2008 and 2018, when in fact they have only increased by 8% when using the correct discount rate. Furthermore, when comparing 2009 and 2018 using CPI-discounted figures the aggregate increase was 30% when in actual fact it was only 3% when using the correct discount rate. This is primarily because the vast majority of additional educational spending over this period has simply been on paying existing teachers more, rather than hiring more teachers or buying more non-personnel resources.
  4. Per-learner figures vs aggregate figures: Much of the existing literature and government reporting is at the aggregate level. Yet the meaningful unit of analysis is the child – what is available to the average child in South Africa? While this may not matter if a population is stable over time, a situation of rising births (as in South Africa) means that resources are being spread over a larger number of children than before. This makes a considerable difference to the conclusion. Between 2009 and 2018 real expenditure on education rose by 3% when looking at the aggregate level and fell by -2.3% when looking at the per-learner level (both using real cost drivers). While there was slightly more money (+3%) being spent on education in 2018 compared to 2009 when looking in the aggregate, for the average child there was slightly less money being spent on them in 2018 compared to 2009.
  5. Significant inter-provincial variation in spending per child: It is clear that some provinces spend more public money per child than others, despite alleged equal funding per child in the national funding formulas. For example, Gauteng spent R2,500 more per child per year compared to KwaZulu-Natal or Limpopo (R20,037 in Gauteng compared to R17,563 in KwaZulu-Natal and R17,503 in Limpopo in 2018).

Finally, we argue that the national government has agreed to higher teacher wages and benefits without budgeting for those increases, and in the process undermined the education system. This has led to a host of unintended consequences. Provincial departments experiencing salary increases that have outpaced their budget increases have attempted to deal with the subsequent fiscal squeeze by implementing hiring freezes and allowing class sizes to rise. Payroll data shows that even after accounting for a small decline in the number of schools, there are -7% fewer principals employed in 2016 compared to 2012. In the three most severely affected provinces the declines in employed Principals, Deputy Principals and HODs range from -13% to -23% when comparing 2012 and 2016.

The main contribution of the paper, to both the research literature on South African education, and also to policymakers, is to help explain the conundrum of the co-existence of widespread hiring freezes and the alleged rising per-learner spending on education (using CPI as a deflator).  The answer to this conundrum is that CPI is the wrong deflator for education – both in South Africa and internationally. When using the correct deflator (the Basic Education Price Index) there is a logical explanation behind both increases in class sizes and the implementation of hiring freezes. The provincially devolved nature of South African spending provides further corroborating evidence. Provincial disaggregation of spending trends and hiring freezes shows quite clearly that those provinces experiencing the largest declines in real per learner spending are also the ones who have the highest number of vacancies. This is not a coincidence. For those researchers who are unconvinced that BEPI is the correct discount rate, and instead believe that real education expenditures have been increasing monotonically for the last decade, we ask the following question: If real educational expenditures per learner have been rising over this period, why is it that provinces are implementing hiring freezes?

Finally, we argue that government officials from the National Treasury and the Department of Basic Education need to take account of the dynamics presented in this paper when entering wage negotiation agreements with teacher unions. While many of the choices made in such negotiations are necessarily political, it is fair to ask government to acknowledge the trade-offs and costs in their decisions and to make those trade-offs and decisions public.

The full paper is available here.

COVID & Kids: What is in the best interests of children?

screen-shot-2020-06-16-at-06.01.23

Van der Berg & Spaull (2020). Counting the Cost: COVID-19 school closures in South Africa and its impact on children. Research on Socioeconomic Policy. Stellenbosch University. (Released: 16 June 2020).

Included below is a short blog post based on a new 32-page report we released today (16 June 2020). It is publicly available on the RESEP website.


There are decades where nothing happens, and there are weeks where decades happen.” — Vladimir Lenin


Looking back to the end of last year, it’s difficult to think that anyone in the world knew how everything was about to change. Here in South Africa, what began as a three-week lockdown period on the 28th of March morphed into an eight-week lockdown that is now in its eleventh week and still on-going, albeit with much fewer restrictions. The eight- week lockdown included bans of all public gatherings, closing all schools, and prohibiting all forms of physical commercial activity, except for the sale of food and medicine. The sale of alcohol and tobacco was banned. A national curfew was imposed prohibiting movement between 8pm and 5am. For the first time since apartheid the army was deployed with 70 000 reserve soldiers distributed across the country, largely in informal settlements, with the intention of maintaining law and order and supporting the police. Even parliament was temporarily closed. Only the courts remained open out of fear that there would be no recourse to challenge government actions or to oppose the constitutionality of the measures being implemented.

By and large these containment measures were initially welcomed, or at the very least accepted, by the public, opposition parties and most scientific advisors. This is now to starting to change.

In the beginning there was so much uncertainty and fear surrounding COVID-19. How deadly was it? How was it transmitted? Who got it? How fast was it spreading? Were kids at risk? There are still key unknowns around immunity, when and if a vaccine will be discovered, and perhaps most importantly, how the impact of the virus will be different in lower- and middle-income countries like South Africa compared to high-income countries. Initially European countries and America made up over 80% of COVID-19 cases, that is now rapidly changing.

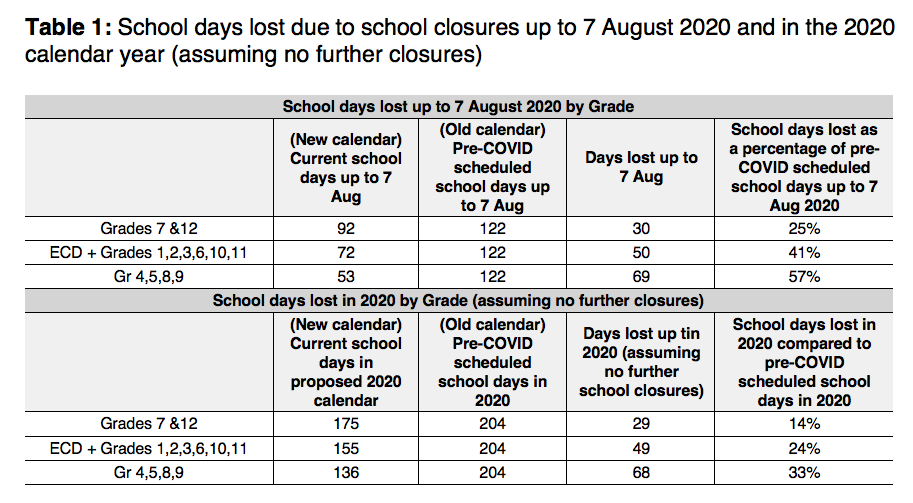
In my own field – education and schooling – everything came to a grinding halt. At the time of writing remain schools, ECD centres and creches remain closed for 90% of children, despite the economy re-opening from 1 June 2020. For the ten weeks of lockdown up to the 8th of June, children were not allowed to go to school or see their friends and family outside of their house. During the first five weeks of ‘hard’ lockdown children were not allowed to leave their homes for any reason except to seek medical attention. Based on the government’s current plans, by the end of Term 2 (7th of August 2020), South African children will have lost between 25% and 57% of the ‘normal’ school days scheduled up to that point.


Screen Shot 2020-06-16 at 06.45.29


In the beginning, like everyone else, we were supportive of these drastic (but defensible) measures. The logic behind the three-week lockdown was sound; slow the spread the virus, buy time for the Health Department to prepare and ‘flatten the curve.’ Had anyone known this would be a 3-month lockdown I’m not sure there would have been the same support.

It is within this context that my colleague and mentor, Prof Servaas van der Berg, and I decided to write a report setting out some of the evidence on COVID-19 and children in South Africa. We wanted to document some of the non-COVID-19 concerns that affect children specifically, many of which have been drastically exacerbated by the extended lockdowns and prolonged school closures. The aim was not to focus too much on whether children are at risk of getting severely ill or dying from COVID-19 (they aren’t), or whether they are as likely to transmit as adults (they aren’t). Instead we looked at five areas which I’ll touch on briefly here in a Q&A format (see the full report for the detailed discussion).

(1) Does the South African distribution of COVID-19 deaths follow the international trends with respect to age?

In short, yes, but the Western Cape data does show higher mortality from 40+ and 50+ while the high-income trend was 50+ and 60+.

Screen Shot 2020-06-16 at 07.03.51
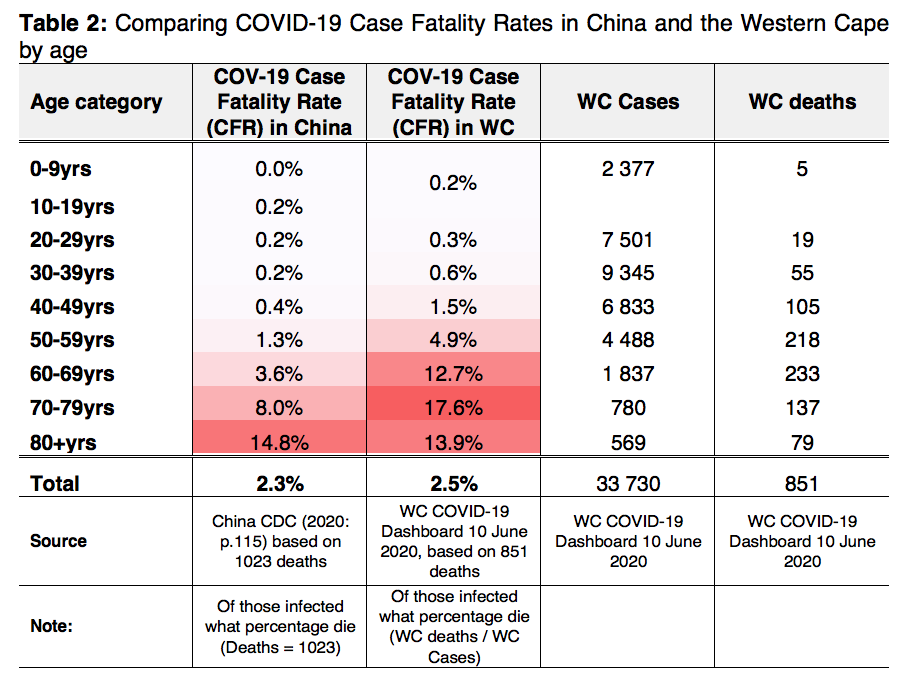
Let’s compare the Case Fatality Rate (CFR) in China and the Western Cape (Table 2). The Western Cape was selected as the best proxy for South African risk by age since it has the highest number of infections (66% of the national total), the highest number of deaths (77% of the national total), as well as the highest rate of testing per 100 000 persons – at least as at the time of writing (NICD, 2020a: p.6). If we are concerned about issues that are especially prevalent in SA (TB, HIV, inequality, malnutrition) then the Western Cape is the best proxy we have at the moment.

While the overall CFR in the WC (2.5%) seems to be comparable to China (2.3%), mortality risk does start increasing from 40+ years.

(2) How does COVID-19 mortality risk in South Africa compare to “normal” mortality risk? 

This is a key question since the justification of the extreme measures implemented in South Africa (lockdown, school closures, deploying the army etc.) are warranted to the extent that the the threat is so severe and unusual that the collateral damage from these measures is “necessary”, “unavoidable” or “worth it.”

Although this is not an easy question to answer and any response will rely on certain assumptions, it’s worth emphasising that the justification for the lockdown also relies on many of these same assumptions. Using StatsSA mid-year population estimates and mortality data for the same year, we report the risk of dying by age group for a “normal” year (i.e. non-COVID-19 year), in this case 2016. Of the 55.9-million people alive in 2016, 435 000 died, with higher death rates among the elderly, as one would expect. In order to compare this annual figure to COVID-19 deaths, one needs a figure of total COVID-19 deaths in 2020. This relies on projections and assumptions. The Department of Health has consulted numerous modelling experts to predict the total number of infections and deaths from COVID-19 since this is important information needed for planning and preparation. Reviewing the projections put forward by the Actuarial Society of South Africa (ASA, 2020: p.4), the South African COVID-19 Modelling Consortium (SACMC) and Deloitte indicate that there may be as many as 40 000 deaths (optimistic) or 48 000 deaths (pessimistic) from COVID-19 by the end of 2020. These are also the current projections cited by the Minister of Health. Taking a conservative approach and using the higher projection of COVID-19 deaths in South Africa in 2020 (48 000), we use the distribution of deaths by age in the Western Cape (Column E) to apportion the 48 000 total deaths across the different age categories. For example, if the 48 000 deaths follow the Western Cape distribution of COVID-19 deaths then there will be 13 142 deaths among the 60-69 year age group in South Africa in 2020.

Screen Shot 2020-06-16 at 07.09.02

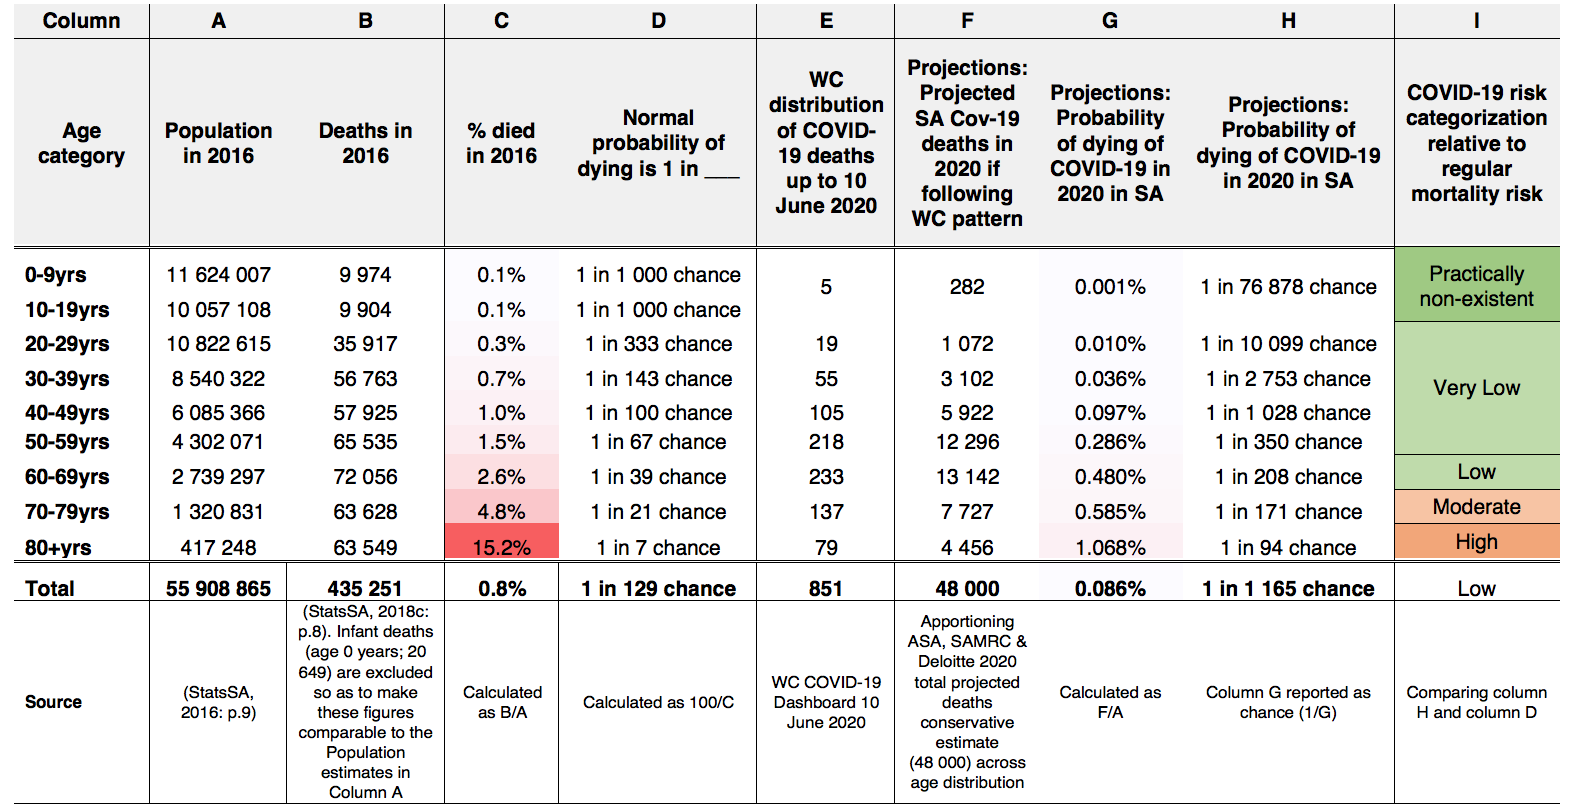
This table allows one to ask “What is the probability that someone in a particular age category is going to die from COVID-19 in 2020 in South Africa?”. It shows that for those under 70 the risk of death from COVID-19 is exceedingly small. For example the average 45 year old has a 1-in-1028 chance of dying of COVID-19 in 2020. the average 45 year old had a 1-in100 chance of dying of non-COVID causes in 2016.

While it is true that these projections depend on the assumption of 48 000 COVID-19 deaths in South Africa in 2020, there are very few specialists who believe that the figure will be higher than this. Furthermore, even if COVID-19 deaths were twice as large as predicted here (96 000) (which would halve the chance numbers in Column H), the risk of death from regular causes for all age groups would still drastically outweigh the risk of death from COVID-19 multiple times over. It is for this reason that the risk categorization in Column I, which reports the relative risk of COVID-19 mortality and regular mortality, indicates that for the population at large under 70 years of age, the risk of death from COVID-19 is low or very low when compared to regular mortality risk. Put differently, people should be far more worried about dying of regular causes than from COVID-19. This doesn’t mean that COVID-19 hasn’t increased mortality risk for everyone 18 years and older – it has – but not nearly as much as one would think when looking at the precautionary measures being taken by government. If you asked the average 50 year old in South Africa “If you died this year do you think the cause would be COVID-19 or something else?” If these assumptions are correct then the average 50 year old has a 5 times higher chance of dying of something else than of dying of COVID-19. This does not, however, indicate that sensible precautions such as social distancing or wearing a mask should be ignored.

The above discussion has important implications for school closures, since these measures are justified partly on the basis that they will prevent the healthcare system becoming overwhelmed, but also because of the excess mortality risk to teachers. For example, schools were scheduled to be opened for some grades on the 1st of June 2020, but this was delayed based on teacher union opposition that schools were not adequately prepared to protect learners and teachers. Yet if the assumptions underlying the above data are correct, the additional mortality risk to teachers and caregivers up to age 70 is low relative to the normal mortality risk that they face. For children the risk is exceedingly small. Following analysis of COVID-19 mortality data in the United Kingdom by Professor David Spiegelhalter at Cambridge University, he concluded that “In school kids aged five to 15 it’s not only a tiny risk, it’s a tiny proportion of the normal risk.” He went on to say that the risk was so low that children were more likely to get struck by lightning (a chance of one in 1.7-million) than die of COVID-19 (one in 3.5-million) (Spiegelhalter, 2020).

The evidence emerging from South Africa on children’s COVID-19 risk of severe illness is completely congruent with international research showing that children do not get severely ill from COVID-19. There are so few recorded deaths of children from COVID-19 that it is difficult to draw any conclusions (see Spaull, 2020 for an overview of the epidemiological research on this). The South African Paediatric Association (SAPA) in their statement on COVID-19 (SAPA, 2020) explain that “Children biologically contain SARS-CoV-2 better than adults, are less likely to get sick if infected, have milder disease, are unlikely to die from COVID-19, and are probably less infectious than adults.”

(3) What is the age and comorbidity distribution of teachers in South Africa?

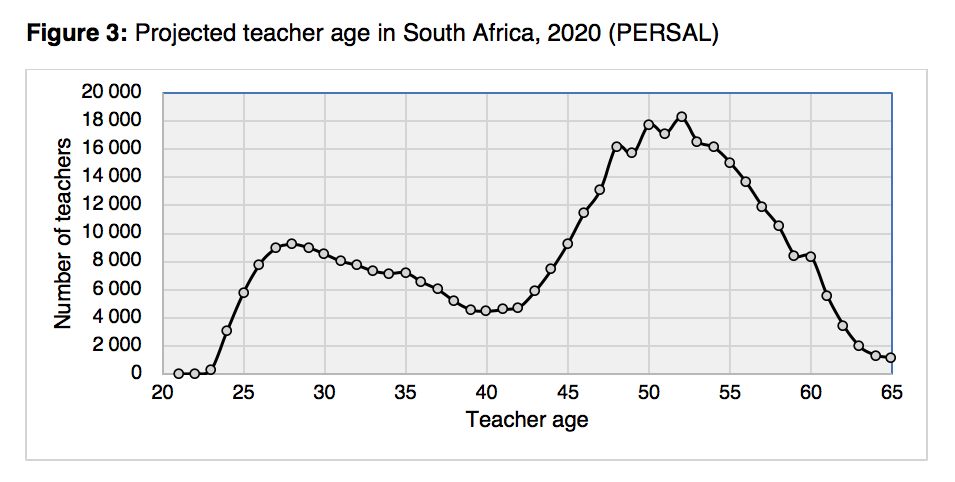
In the paper we do report the age distributions of teachers in South Africa and show that only 10% of teachers (38,000 individuals) are aged 58-65 years.

Screen Shot 2020-06-16 at 07.30.30

There is currently no nationally-representative data on the comorbidities of teachers specifically. However, nationally 4 581 200 South Africans aged 20-79 are estimated to have diabetes, according to the International Diabetes Federation (2019). Applying the ratio of teachers to the national population in this age group, there could be perhaps around 47 500 teachers who have diabetes, or one in every eight teachers. Cardiovascular disease is a major source of mortality in South Africa, often associated with hypertension. These diseases increase an individual’s COVID-19 mortality risk. However, it should be noted that the mortality total provided in Table 3 is a national figure and already includes deaths associated with these and other comorbidities.

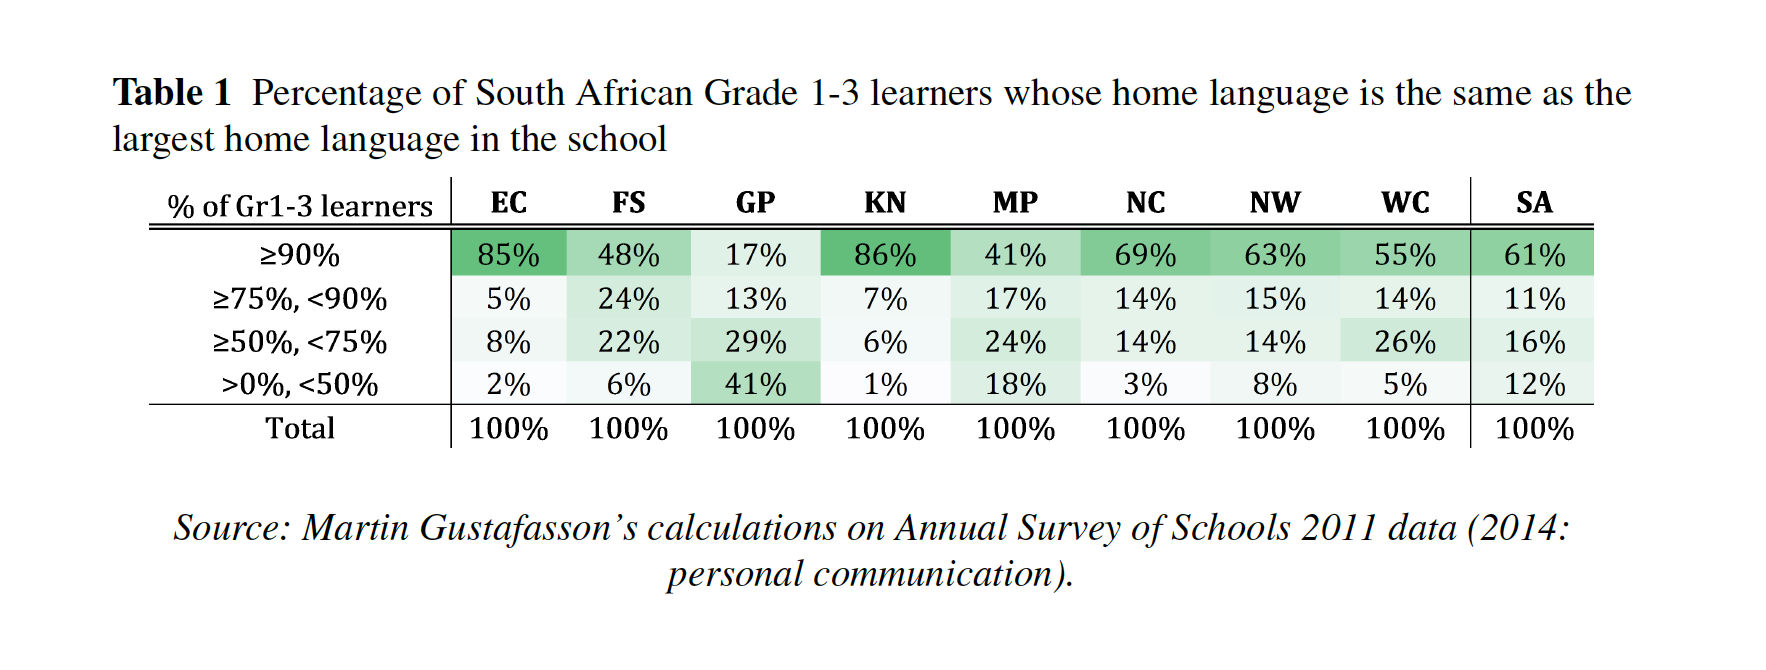
(4) What percentage of South African schools have running water?

The School Monitoring Survey 2017 data show that nationally 74% of primary schools and 80% of secondary schools report access to running water in 2017 (DBE, 2018: p.80). However, there is considerable provincial variation in access to this most basic resource. Lack of access to running water is especially acute in KwaZulu-Natal, where only 53% of primary schools and 59% of secondary schools report access. In contrast, approximately 95% of primary schools and high schools in Gauteng and the Western Cape have running water (DBE, 2018: p.81). Without access to running water, how are children and teachers expected to wash their hands? Thus special measures had to be instituted. COVID-19 is an opportunity for South Africans to reflect and acknowledge that in 25 years of democracy we have not managed to provide all schools with basic infrastructure like running water, electricity, and safe toilet facilities. The fact that a quarter of primary schools do not have access to running water in a middle-income country like South Africa is an indictment and an ongoing source of shame. While this is clearly a pre-requisite for basic hygiene during a pandemic, it is also a pre-requisite for basic dignity in everyday life.

Due to teacher union opposition about returning to schools where there is no running water and therefore limited ability to practice personal hygiene, the Department of Basic Education went into overdrive to provide schools with water tanks so that teachers would return. On the 7th of June the Minister announced that 95% of schools now had running water (Motshekga, 2020). This was accomplished through a contract with Rand Water to provide water tanks to 3500 schools:

“The support provided by the Department of Water and Sanitation, Rand Water, the Department of Health, National Treasury; and the recent involvement of the South African National Defence, the Development Bank of Southern Africa (DBSA), the Department of Transport, and Mvula Trust is second to none. Their involvement has accelerated our interventions in the provinces, especially the reach to the most rural and remote schools” (Motshekga, 2020).

This is a commendable achievement, and may yet be one of the few positive outcomes of the pandemic. It is truly remarkable that in the space of six weeks the Department of Basic Education has managed to do what it was unable to do in the last 20 years.

(5) Is social-distancing feasible in South African classrooms?

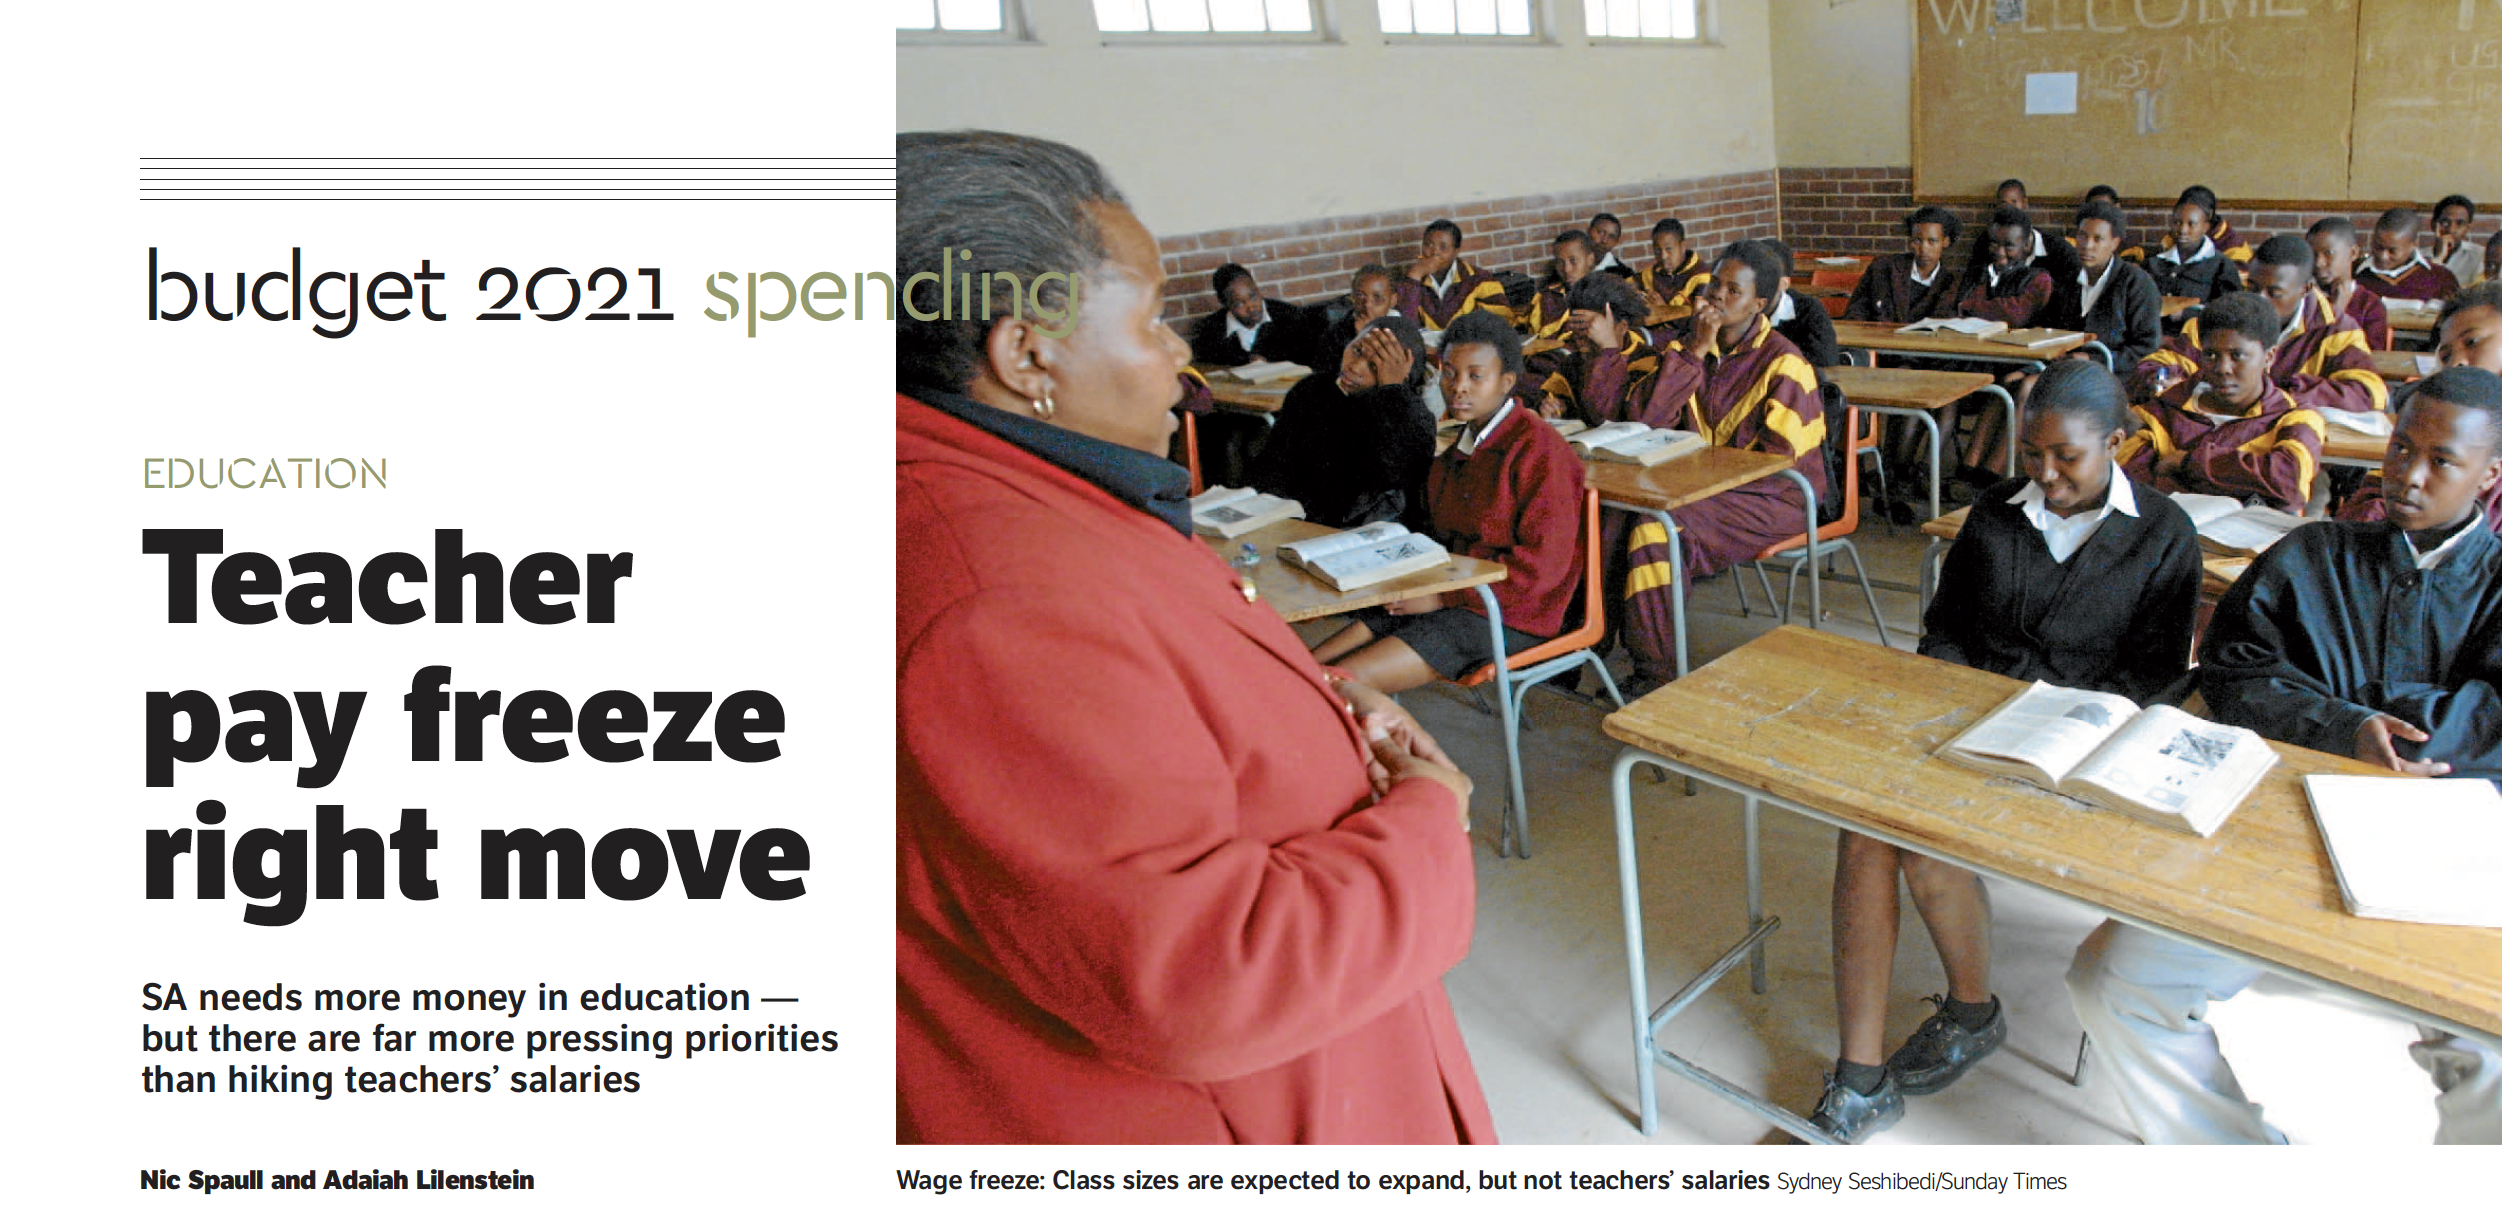
The School Monitoring Survey 2017 data on “largest class taught” in Grade 3, 6, 9 and 12 show that nationally 63% of primary school children are in classes of 40 or more learners per class, with 16% in classes of 60 or more per class. In secondary schools 70% of learners are in classes of 40 or more learners per class and 26% are in classes of 60 or more learners per class.

Screen Shot 2020-06-16 at 07.52.22

Screen Shot 2020-06-16 at 07.52.33

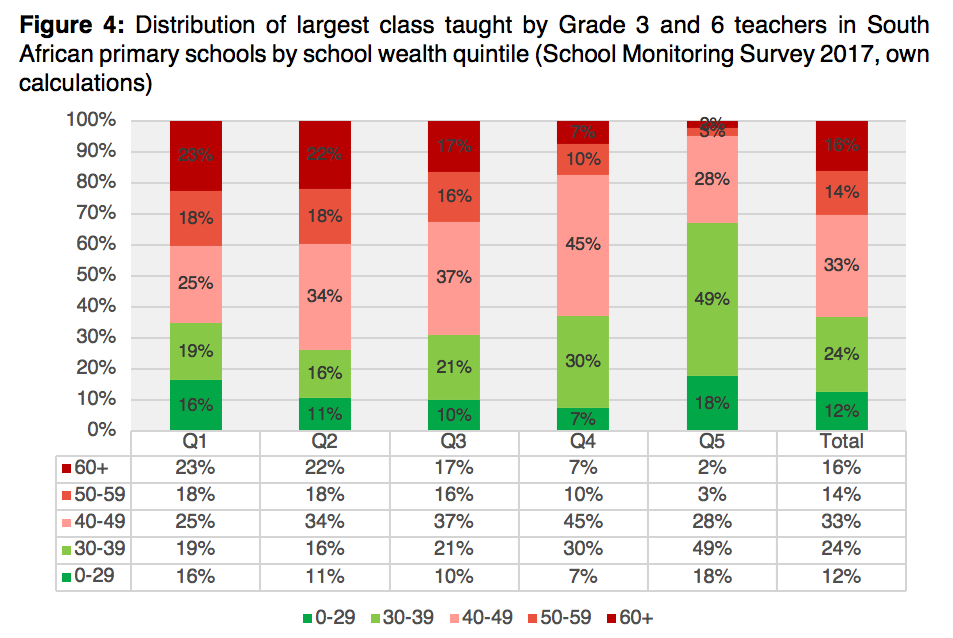
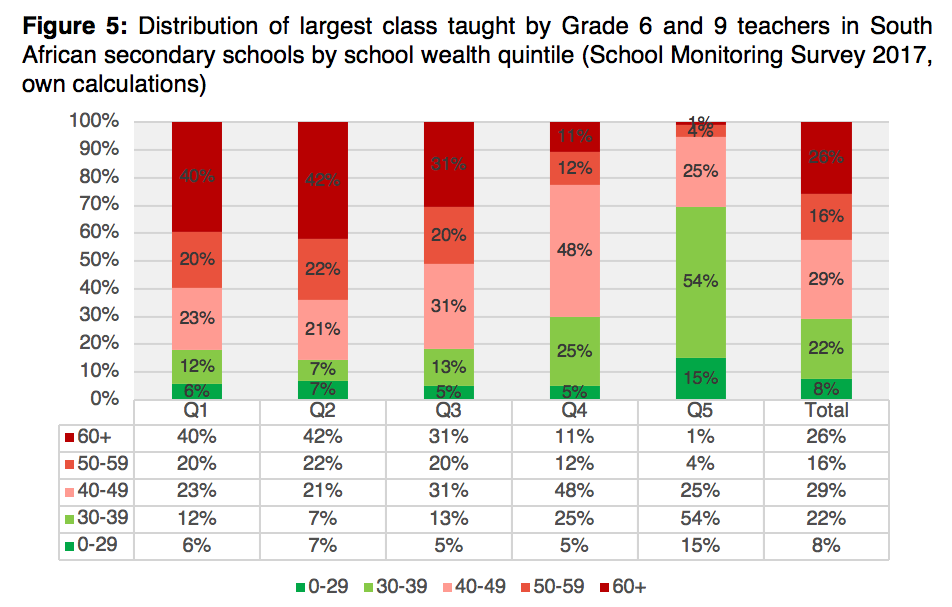
Given that COVID-19 mortality risk is low compared to regular mortality risk (Table 3), and virtually non-existent for children, we believe the Department of Basic Education should acknowledge that it is not feasible for most South African schools to practice social distancing within the classroom. Where they can, they should. Where they can’t they should take the precautions that they can but continue with schooling. While it should require mask-wearing for older children and social distancing on the playground, social distancing within the classroom is simply not realistic. Attempts to do so are futile in our context and are likely to further disrupt teaching and learning, to the detriment of children. Furthermore, as the South African Paediatric Association has explained:

“Teachers are not at high risk of being infected by children. Teachers are at a higher risk of contracting the virus from other adults (e.g. colleagues), at home or in the community (outside school). Teachers with comorbidities are at increased risk for severe Covid-19″ (SAPA, 2020).

We cover a number of other topics in the report including malnutrition, learning losses, economic impacts etc. The last one I want to touch on here is something I am especially worried about:

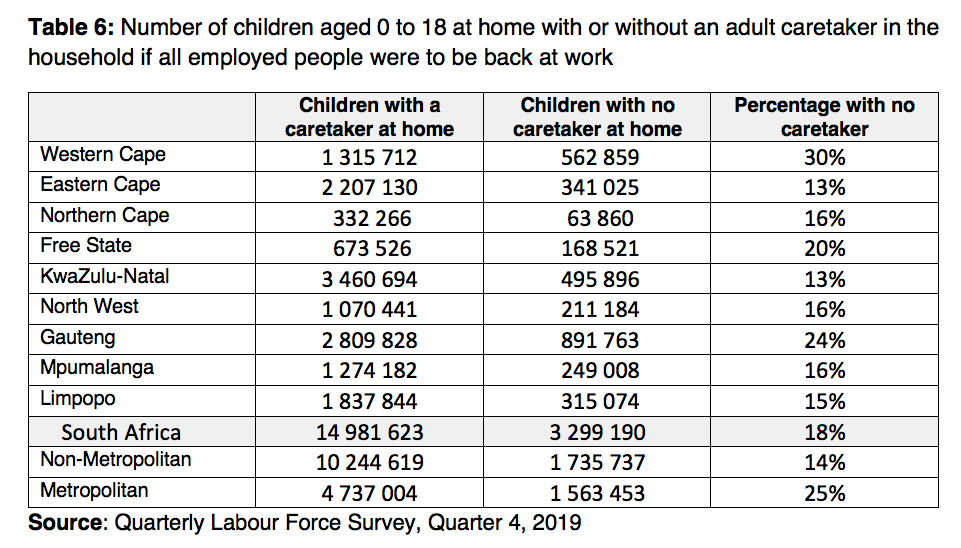
(6) With the economy re-opening and schools still (largely) closed, how many young children are left “home alone”?

Short answer: 3.3 million kids (18% of all children) are in households were the only adult caregiver in the house has a job. Of these 1-million are aged 0-6 years. What happens to these kids when their parents have to return to work while creches, ECD-centers and schools are still shut for 90% of children?

Reviewing the South African media discourse on the ‘post-lockdown’ regulations, one of the areas that has been most neglected are the unintended consequences of re-opening the economy while schools and crèches remain closed for most children.

Using data from the Quarterly Labour Force Survey (QLFS) of StatsSA for the fourth quarter of 2019, it is possible to determine how many schoolchildren, pre-schoolers and toddlers would be at home with or without an adult caretaker, if everyone who had jobs at the end of 2019 were again to return to work. The table shows that 3.3 million children (18% of all children in this age group) were in households were there was no additional adult care-giver apart from employed adults. In the remaining 82% of households there would still be an adult available to act as caretaker, especially in extended families. As one would expect, proportionately the number of children without a caretaker would be largest in metropolitan areas, where this ratio is 25%. The biggest proportion of children would be affected In the Western Cape (30%) and Gauteng (24%).

Screen Shot 2020-06-16 at 08.05.40

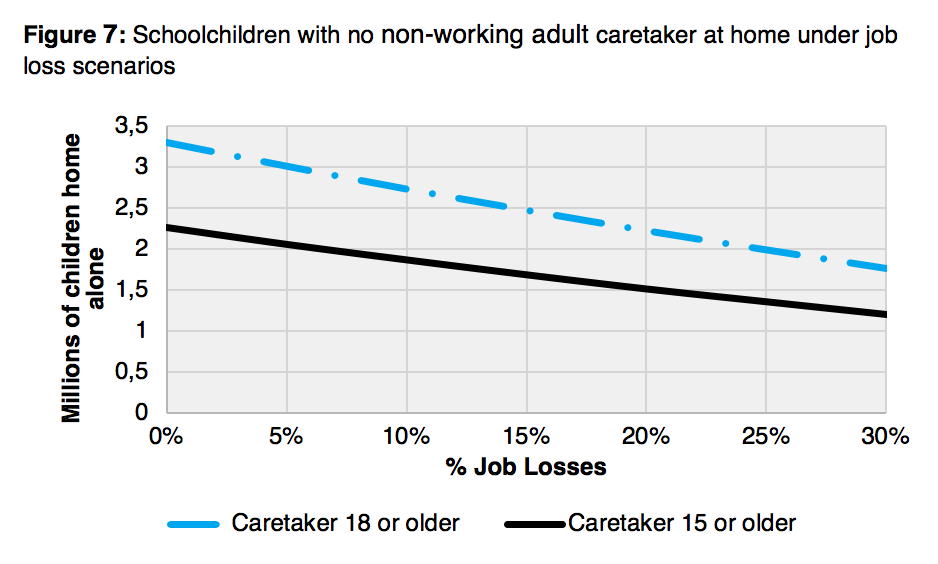
One can further estimate these ratios allowing for older siblings (15 or above) who might be able to act as caretakers. While that reduces the numbers (Figure 7), the basic problem remains. Even if one includes household members 15-years and older as possible caretakers, there would still be 2.3 million children aged 0-15 years that could be home alone if their employed caregivers returned to work and their school grade or their ECD centre or crèche remained closed.

Given the job-losses expected to result from the lockdown and the COVID-19 induced recession, more caregivers will become unemployed and therefore would be at home and available to care for children (albeit now with less income). While this does decrease the percentage of children that are home alone, as the figure shows, even if there were 30% job losses there would still be 1.8 million children aged 18 or below that would be left home alone because their only caregivers would be at work, or 1.2 million if 15 year olds can act as caretakers.

Screen Shot 2020-06-16 at 08.04.54

Perhaps the most severe instance of this would be the care of very young children, i.e. those under the age of 6 years. Our analysis shows that if all employed workers return to work, there would be almost one million (974 000) children below the age of six who would be left alone in households without an adult caretaker. While it is true that parents and caregivers would try and make some arrangements for members of other households to take care of their children, many caregivers may not have the networks needed, and may feel compelled to go to work to earn income to support their child(ren). This is all because community-based early childhood development centres and preschools are still not allowed to operate despite the economy re-opening.

Government Gazette No. 43381 (1 June 2020) reports that Early Childhood Development (ECD) will be allowed to re-open on the 6th of July 2020, despite the fact that the vast majority of the economy ‘re-opened’ on the 1st of June 2020 when the country moved to Level 3 Lockdown (DBE, 2020a: p.4). It is unclear what the Department of Basic Education and the Department of Social Development think is meant to happen to these 974 000 children under the age of six who have no alternative non-working caregiver.

In addition to the above, given that most ECD facilities in South Africa are primarily privately-operated small businesses, it is unclear how many of these ECD centres and creches will have been able to survive the income loss of the extended lockdown.

(7) What are your conclusions and policy recommendations?

After reviewing the evidence presented in this paper, it is our view that keeping children out of school is not in the best interests of the child. Consequently, all children should return to schools, crèches and ECD centres without any further delay. The profound costs borne by small children and families as a result of the ongoing nationwide lockdown and school closures will be felt for at least the next 10 years.

When the new coronavirus rapidly spread across the globe, the impact of the virus on children was still unclear, and closing schools from an abundance of caution seemed the responsible thing to do. But much has been learnt since about both COVID-19 and about the effects of lockdown and school closures, both in South Africa and internationally. Given the large social and economic costs of hard lockdowns and wholesale school closures we would strongly caution against future nation-wide lockdowns or school closures, even in the presence of a surge in COVID-19 infections. Policy-makers and government leaders have an obligation to weigh up the costs and collateral damage of their policies, particularly for those who are most vulnerable, such as small children, the elderly and those in poverty.

Millions of South African children’s education and mental health have been compromised in this initial period of uncertainty. Given what is now known about the mortality rates of COVID-19, we believe that the ongoing disruptions to children’s care, education and health are no longer justified.

— END —

To read the full report download it HERE.

With schools shut, kids go hungry (BD Article)

130212feednew

(The article first appeared in the Business Day on the 23rd of March 2020 under the title “Government needs to come up with a plan to help poor families now that schools are shut“)

The coronavirus pandemic working its way through South African society will have many knock-on effects, one of them will be hunger and malnutrition as 9-million children no longer receive free school meals while their schools are shut.

The population of South Africa today is 59-million people, and nearly a quarter are school-going children enrolled in Grades R-12 (13-million kids). One of the under-celebrated achievements of the ANC government over the last ten years has been the mass rollout of a successful school-feeding scheme to all no-fee schools in the country (Quintile 1-3 schools) – The National School Nutrition Programme. To give you a sense of just how vast that network is, of the 13-million kids in school, 9-million receive a free school meal every day they are at school. Put differently, of all the weekday ‘lunches’ eaten in South Africa, one in six are provided in schools under this program.

In order to fund this the government spends R36-million a day to feed these 9-million kids, amounting to R7.2-billion for 2020 according to the most recent budget. The big question now is what happens to those meals and those kids while their schools are shut because of the coronavirus? I’d like to point to what we know about hunger in South Africa, whether the NSNP program is effective, what other countries are doing and what we should be thinking about.

Firstly, South African schools were going to shut for the first term holidays anyway – we just closed them three days early. The Minister announced that schools will be closed until 14 April 2020, and if you count the school holidays and public holidays in that period there are only 11 school days (even though schools are closed for a whole month). While that might not sound like a lot, any extension of school closures (which seem almost inevitable now) will materially start to affect children’s nutrition, and for some kids, also their immune systems.

The nationally-representative 2018 General Household Survey can help shine some light on the extent of hunger in South Africa. Three stats are telling: (1) When asked “Did your household run out of money to buy food during the past 12 months?”, 22% of households answered “yes.” (2) For households where was at least one child (17 years or younger), 16% reported that in the last year a child went hungry in that household “because there wasn’t enough food.” And (3) according to the StatsSA 2018 GHS report of 2018, 20% of households had “inadequate” or “severely inadequate” food access (p.67). So, even with the NSNP in full-swing, and 9-million kids getting their meals Monday to Friday, the GHS shows that about one in six South African households with kids experience hunger or food insecurity. Similarly, the National Development Plan (NDP) states that “stunting affects almost one in five children (18%), and…about one in 10 children are underweight” (p.299).

There is also corroborating evidence from a 2016 evaluation of the National School Nutrition Programme by JET Education Services. They surveyed 267 schools in 2015 and found that 4% of learners “did not eat at home last night” and 23% “did not eat breakfast.” (JET, 2016: p.58). Encouragingly, 96% of schools did actually serve the main meal indicating that the program is working very well.

South Africa is not the only country experiencing this problem. According to UNESCO over 100 countries have shut all schools as a result of the coronavirus. Most have some form of school feeding system for selected learners and now all are scrambling to find ways of providing meals to those that rely on them. In the US a number of cities have implemented a “grab and go” system, including in New York, Atlanta, Detroit, Milwaukee and Washington D.C. where distribution points and catchment zones dictate who can collect from where.

There are still no reliable projections as to how the coronavirus outbreak in South Africa will unfold but one thing is certain: there is no world in which the situation in South Africa is less severe in three weeks’ time (when schools are scheduled to re-open) than it is now. If schools are going to be shut for months, then provincial governments need to come up with contingency plans for how they will help poor families provide food for their children. Currently there are no plans in place for sustained school closures. Minister Motshekga has been quoted as saying “We are not going to run special programmes … We won’t be able to do it, so parents must take that responsibility and communities must assist.” If the Department of Basic Education is reneging on its responsibility it should give the school nutrition money to a department that is willing and able to come up with a solution. When one in five children are hungry and rely on these meals for their basic needs, it is clear that free school meals have become part of the social infrastructure that millions of South African children rely on. We cannot simply ignore that because of the logistical complexities involved. The money has already been budgeted and allocated, now provinces need to find innovative ways of getting meals to kids while schools are closed.

“Tito’s business unusual” – Our FM article on #Budget2020

tito

  • by Nic Spaull & David Carel

In the SONA it’s easy for the President to promise everything to everyone. A Sovereign Wealth Fund for you, a State Bank for you. You get a car, you also get a car, everyone gets a car. The budget speech is different because you now have to pay for all those cars. If you can’t find the money, you can’t spend it. And in this year’s budget the message came across loud and clear: we have reached the end of the road.

Minister Mboweni showed the courage to wake us up from the political twilight zone we have been in for too long: “We cannot go on like this. Classroom sizes are growing, hospitals are getting fuller and our communities are becoming increasingly unsafe.” We are close to a recession (economic growth in 2019 was 0,3%), debt is spiralling, and there are serious unresolved existential risks, such as Eskom. There is no more business as usual.

Government has finally decided to confront what it has been speaking about for a decade: reducing public sector wages. Mboweni announced that over the next three years government will cut the public sector wage bill by a colossal R160-billion. For the last ten years the public sector wage bill has been increasing much faster than inflation, much faster than economic growth and much faster than government’s ability to collect new revenue to pay for it. Those chickens have now come home to roost.

The 2020 allocation to Basic Education has decreased from R250,2-billion to R248,6-billion, falling R12-billion short of what was needed just to keep up with inflation. Because Basic Education is still the largest single line item in the budget and is also the largest employer in the country (with over 400,000 teachers on payroll), it provides the perfect case study of rising public sector wages and the crowding out of other essential expenditures. Over the last ten years teacher salaries have risen 45% faster than inflation, outstripping increases in budget allocations and hobbling provinces.

The two biggest consequences have been rising class sizes and the imposition of hiring freezes across provinces. The government’s own analysis shows that Learner:Teacher ratios have been consistently rising since 2010. Nationally representative independent studies (PIRLS) show that between 2011 and 2016 average class sizes at the Grade 4 level increased from 40 to 45 learners per class. For the poorest 60% of learners, who feel these increases most acutely, the increase was from 41 to 48 learners per class over the same period.

This is the outcome of above-inflation wage increases since there is always a trade-off between head-counts (the number of teachers employed) and salaries (what you pay them). That means larger class sizes and fewer personnel when wages rise in the face of capped budgets. The way provinces hire fewer teachers and save costs is by implementing hiring freezes, which virtually all have had to resort to (see KZNDoE circular 3 of 2018). Government payroll data from 2012 and 2016 shows that there was a 16% decline in school managers employed countrywide despite there only being 2% fewer schools (school managers are more expensive than teachers). There were double digit declines in the number of principals employed in the North West (-12%), Limpopo (-13%), and the Free State (-14%). In Limpopo alone there were 2,996 principals employed on payroll, yet there are 3,867 schools in the province. That is to say 23% of schools in Limpopo have no employed principal.

What’s clear is that this budget has drawn the lines along which factional battles will be fought over the coming year, both within the ANC, and between the ANC and COSATU. It is wrong and simplistic to see confining public sector wages as anti-poor. As we’ve seen with rising class sizes and withering school leadership teams, large wage increases in a time of almost no economic growth has real consequences for schools — especially for the poorest government schools.

We will soon see if the last decade’s crisis in political leadership will continue unabated or if the President has the leadership and backing to broker the needed compromises and new social compacts to move us forward. Minister Mboweni claims support from Cabinet and the President in confronting the wage bill. The big question now is whether the ANC will actually implement these policies, renegotiate already-signed wage agreements, and withstand the considerable heat that will be coming from COSATU. This will be the President’s biggest test to date and we should throw the full weight of our support behind him.

//

Dr Nic Spaull and David Carel are researchers in the Research on Socioeconomic Policy (RESEP) group at Stellenbosch University.

This article first appeared in the Financial Mail on the 27th of February 2020 with the title “Tito’s business unusual”

The stories we tell ourselves about inequality

south-africa-inequality-impakter

South Africa today is the most unequal country in the world. The richest 10% of South Africans lay claim to 65% of national income and 90% of national wealth; the largest 90–10 gap in the world. These inequities are mirrored in the education system where we have 20% of schools that are broadly functional, and 80% that are mostly dysfunctional. Because of this, two decades after apartheid it is still the case that the life chances of the average South African child are determined not by their ability or the result of hard-work and determination, but instead by the colour of their skin, the province of their birth, and the wealth of their parents. These realities are so deterministic that before a child’s seventh birthday one can predict with some precision whether they will inherit a life of chronic poverty and sustained unemployment or a dignified life and meaningful work. The sheer magnitude of these inequities is incredible. We have private schools charging R300,000 a year, and public schools where children drown in pit latrines. Last year (2018), the top 200 high schools in the country had more students in matric achieving distinctions in Mathematics (80%+) than the remaining 6,600 combined. Put differently 3% of South African high schools produce more Mathematics distinctions than the remaining 97% put together.

In a few years’ time when we look back on three decades of democracy in South Africa, it is this conundrum – the stubbornness of inequality and its patterns of persistence – that will stand out amongst the rest as the most demanding of explanation, justification and analysis. This is because inequality needs to be justified; you need to tell a story about why this level of inequality is acceptable or unacceptable. As South Africans what is the story that we tell ourselves about inequality and how far we have come since 1994? Have we accepted our current trajectory as the only path out of stubbornly high and problematically patterned inequality? Are there different and preferential equilibria we have not yet thought of or explored, and if so what are they? In practical terms, how does one get to a more equitable distribution of teachers, resources or learning outcomes? And what are the political and financial price-tags attached to doing so?

Our post-apartheid education system is currently an awkward fusion of apartheid systems serving post-apartheid societies. What the apartheid government used to perpetuate privilege and to act as a lever for rapid poor-White social mobility, post-apartheid society uses as a lever for Black middle-class mobility. Today Black and Coloured learners make up 60% of those attending former White-only fee-charging schools. Thus, a small, separate and functional school system, created to privilege one section of the population and exclude others remained intact but the discriminating principle simply morphed over time from race to fees. We now have a ‘pay-to-play’ system. If you want your child to have a decent shot at life, you need to get them into a good school. In that sense, school fees have become the current price of dignity in South Africa.

Reflecting on our particular journey out of apartheid, we can see that our country has become a case study of how politics and policy interact with unequal starting conditions to perpetuate a system of poverty and privilege. We are witnessing a process unfolding where an unjustifiable and illegitimate racial education system (apartheid) morphs and evolves to one that is more justifiable and somewhat non-racial, all the while accommodating a small privileged class of South Africans who are not bound to the shared fate of their fellow citizens.

The post-apartheid government has made important strides in trying times; educational outcomes are really improving, the Child Support Grant has significantly reduced poverty and deprivation for large swathes of the country, and access to basic services have undeniably improved across the board. Yet we must also be honest and say that our collective political imagination has come up short. We lack a believable vision of a more equal country where everyone has basic dignity, and even more so, we lack a believable plan of how to get there.  While there has been some tinkering around the edges of the political and economic possibilities available to us, we cannot point to a country-wide initiative that has made significant inroads into the gross inequity that is visible everywhere we look.

We need bolder policies and bolder politicians. We need our elected officials to actually visit the pit latrines that our children drown in. Consultants prophesying coding and tech must actually speak to children in the 26% of South African schools that still don’t have running water in 2019. Let them drink laptops. Surely we can muster the political will and societal shame to put an end to these visceral daily injustices? We need officials who have the courage and the mandate to fire corrupt or incompetent officials currently shuffling between government ministries with no consequences. But we also need those with the moral clarity to take on comfortable elites who resist wealth taxes, land reform and social housing. Whatever the story is that we keep telling ourselves to justify our obscene levels of inequality, the poor and excluded will not believe it forever.

//

This article first appeared in the Financial Mail on the 24th of October 2019). It is an extract from my chapter in our new book “South African Schooling: The Enigma of Inequality” which is co-edited by myself and Jonathan Jansen (published by Springer in November 2019).

Our new Springer book on SA education!

Screen Shot 2019-09-14 at 14.54.39

On Thursday this past week we launched our new book “South African Schooling: The Enigma of inequality” published by Springer.  Jonathan Jansen and I co-edited the book which includes 19 chapters from some of South Africa’s leading scholars. The chapters are as follows:

screen-shot-2019-09-12-at-06.27.08.png

screen-shot-2019-09-12-at-06.27.22.png

The reason why we wanted to write this book was twofold: (1) Books are a nice way of bringing together in one volume the latest ‘state of play’. (2) We thought it would be helpful to have a single book with contributions from both educationists and economists who otherwise rarely read each other’s work. To give you a sense of the book I have included an excerpt below from my framing chapter of the book.

Chapter 1. Equity: A Price Too High to Pay?

Nic Spaull

1.1 Introduction

South Africa today is the most unequal country in the world. The richest 10% of South Africans lay claim to 65% of national income and 90% of national wealth; the largest 90–10 gap in the world (Alvaredo et al. 2018, p. 150; Orthofer 2016). Given the strong and deeply historical links between education and the labour market these inequities are mirrored in the education system. Two decades after apartheid it is still the case that the life chances of the average South African child are determined not by their ability or the result of hard-work and determination, but instead by the colour of their skin, the province of their birth, and the wealth of their parents. These realities are so deterministic that before a child’s seventh birthday one can predict with some precision whether they will inherit a life of chronic poverty and sustained unemployment or a dignified life and meaningful work. The sheer magnitude of these inequities is incredible. In 2018 the top 200 high schools in the country have more students achieving distinctions in Mathematics (80%+) than the remaining 6,600 combined. Put differently 3% of South African high schools produce more Mathematics distinctions than the remaining 97% put together. Of those 200 schools, 175 charge significant fees. Although they are now deracialized, 41% of the learners in these schools were White. It is also worth noting that half of all White matrics (48%) were in one of these 200 schools. This is less surprising when one considers that in 2014/2015, White South Africans still make up two thirds of the ‘elite’ in South Africa (the wealthiest 4% of society) (Schotte et al. 2018, p. 98).

In a few years’ time when we look back on three decades of democracy in South Africa, it is this conundrum – the stubbornness of inequality and its patterns of persistence – that will stand out amongst the rest as the most demanding of explanation, justification and analysis. This is because inequality needs to be justified; you need to tell a story about why this level of inequality is acceptable or unacceptable. As South Africans what is the story that we tell ourselves about inequality and how far we have come since 1994? Have we accepted our current trajectory as the only path out of stubbornly high and problematically patterned inequality? Are there different and preferential equilibria we have not yet thought of or explored, and if so what are they? In practical terms, how does one get to a more equitable distribution of teachers, resources or learning outcomes? And what are the political, social and financial price-tags attached to doing so?

While decidedly local, the questions posed above and in the subsequent chapters of this book also have global relevance. Like few other countries in the world, South Africa presents an excellent case study of inequality and its discontents. As Fiske and Ladd (2004, p.x) comment in their seminal book ‘Elusive Equity’:

“South Africa’s experience is compelling because of the magnitude and starkness of the initial disparities and of the changes required. Few, if any, new democratic governments have had to work with an education system as egregiously- and intentionally inequitable as the one that the apartheid regime bequeathed to the new black-run government in 1994. Moreover, few governments have ever assumed power with as strong a mandate to work for racial justice. Thus the South African experience offers an opportunity to examine in bold relief the possibilities and limitations of achieving a racially equitable education system in a context where such equity is a prime objective.”

Inequality touches every aspect of South African schooling and policy-making, from how the curriculum is conceptualized and implemented to where teachers are trained and employed. Reviewing the South African landscape there are many seemingly progressive policies on topics such as school governance, curriculum and school finance. As the chapters in this volume will show, few of these have realized their full potential, and in some instances, have hurt the very students they intended to help (Curriculum 2005, for example). The ways that these policies have been formulated, implemented and subverted are instructive to a broader international audience, particularly Low- and Middle-Income Countries and those in the Middle East and Latin America. The visible extremes found in South Africa help to illustrate the ways that inequality manifests itself in a schooling system. In a sense, the country is a tragic petri dish illustrating how politics and policy interact with unequal starting conditions to perpetuate a system of poverty and privilege. Ultimately, we see a process unfolding where an unjustifiable and illegitimate racial education system (apartheid) morphs and evolves to one that is more justifiable and somewhat non-racial, all the while accommodating a small privileged class of South Africans who are not bound to the shared fate of their fellow citizens. Based on their reading of the South African evidence, different authors paint a more, or less, pessimistic picture of South African education. Some authors focus on the considerable progress that has been made in both the level and distribution of educational outcomes since the transition, and particularly in recent periods (Van der Berg and Gustafsson 2019). Others document tangible interventions aimed at decreasing inequality by improving early grade reading outcomes in the poorest schools, principally through lesson plans, teacher-coaches and materials (Taylor S 2019). While generally supportive of these types of interventions a number of other authors caution that these gains are the low hanging fruits of an extremely underperforming system. Unless teachers have higher levels of content knowledge (Taylor N 2019), and meaningful learning opportunities to improve their pedagogical practices (Shalem and De Clercq 2019) any trajectory of improvement will soon reach a low ceiling. Moving beyond teachers’ competencies, the book also foregrounds deficiencies in funding (Motala and Carel 2019), and the primacy of politics (Jansen 2019).

The aim of this introductory chapter is to provide an overview of the key dimensions of inequality in education and in South Africa more generally, showing that outcomes are still split along the traditional cleavages of racial and spatial apartheid, now also complemented by the divides of wealth and class. The argument presented here foregrounds the continuity of the pre- and post-apartheid periods and concludes that in the move from apartheid to democracy the primary feature of the story is a pivot from an exclusive focus on race to a two-pronged reality of race and class. This is true not only of the schooling system, but also of South African society more generally. Where rationed access to good schools was determined by race under apartheid, it is now determined by class and the ability to pay school fees, in addition to race. Rather than radically reform the former White-only school system – and incur the risk of breaking the only functional schools that the country had – the new government chose to allow them to continue largely unchanged with the noticeable exception that they were no longer allowed to discriminate on race and they were now allowed to charge fees.

//

The full intro chapter and chapter titles are available here. The book can be ordered here. We will be having a few more book launches (in Joburg and possibly overseas), I’ll post those either on here or on Twitter.

🙂

TALIS South Africa 2018

Screen Shot 2019-07-05 at 11.28.42

In 2018 South Africa participated in the OECD’s Teaching and Learning International Survey (TALIS). In SA, 170 high-schools participated in the study and 2,046 teachers from those schools. The aim of the survey, which is nationally representative, is getting accurate and comparable data on the working conditions and learning environments in South African schools, with a special focus on teachers and principals. Here are the three main reports for those interested in digging into the data. It’s difficult to overstate how much valuable information there is in the full OECD report (Volume 1). For any quantitative research students interested in education and thinking about a topic I would strongly recommend looking at the reports and downloading the TALIS 2018 data.

I’ve included some highlights from the reports below, mainly using graphs taken from the reports…

  • Time spent on actual teaching and learning: South African high-school teachers reported that only 66% of their time was spent on actual teaching and learning compared to an average of 78% in the 31 OECD countries.

Screen Shot 2019-07-05 at 12.13.07

This is not very surprising and the 66% figure is almost certainly an overestimate given that it is self-reported data from the teachers themselves. In an earlier observational study Carnoy et al (2012) found that at the Grade 6 level only 40% of scheduled lessons for the year were actually taught. Wasted Learning time was one of the four ‘binding constraints‘ we raised in 2016. I include an excerpt from that report:

“In a comprehensive year-long comparative study evaluating 58 schools in the North West province and 58 schools across the border in Botswana, researchers found that of the 130 mathematics lessons scheduled for the year, Grade 6 teachers in the North West had only taught 50 lessons by the beginning of November (Carnoy et al, 2012, p. xvi). This amounts to only 40% of scheduled lessons for the year. By contrast, in Botswana Grade 6 teachers had taught 78 lessons by the beginning of November (60% of scheduled lessons). The researchers note that frequently the problem was not teacher absenteeism but rather a lack of teaching activity despite teacher presence. As the authors note “One of [the reasons] brought up by many North West teachers, is the ‘lack of confidence’ teachers feel in teaching the required elements of the Grade 6 mathematics curriculum. In discussions, teachers attributed this lack of confidence to lacking the knowledge needed to teach the subject” (p. xvi), reflecting the interaction between support and accountability.”

  • Gender imbalance between teachers and principals: TALIS 2018 shows that at the high school level 60% of teachers are females but only 20% of principals are female.

Screen Shot 2019-07-05 at 12.04.51


Last year Gabi Wills wrote a helpful policy brief on school leadership and management and has a section where she highlights the gendered nature of South African school leadership and management:

“Gender bias in the promotion of female teachers emerges at the middle management level and widens at higher post-levels. In 2016, despite most teachers being women (74%), women only held 63% of HoD posts. At the level of deputy principal, women only held 44% of these posts and a mere 36% of school principal posts as reflected in Figure 3. However, these gaps are driven mostly through secondary school promotion appointments which are more likely to favour men than primary school promotion appointments. There has also been little improvement in gender equality in school promotion. For example, the percentage of principals who were women only improved by 2% points from 34% in 2004 to 36% in 2012” (Wills, 2018).

Screen Shot 2019-07-05 at 12.28.05

  • Multilingual contexts in South Africa: South Africa had the second largest percentage of students whose first language was different from the language of instruction. (The only country with a higher percentage was the tiny island state of Singapore – to give you a sense, there are only 185 primary schools in Singapore). Drawing attention to the languages that children speak – and the diversity of those languages in SA – is really important.

Screen Shot 2019-07-05 at 12.05.55

I have a forthcoming chapter (co-authored with Lilli Pretorius) where we look at early grade reading in African languages. The table below comes from that chapter and shows that Gauteng is very different to the other 8 provinces in South Africa. It also shows that  72% of Gr1-3 learners are in schools where 75%+ learners speak the same language as their home language (in KZN this is 93% and EC it’s 90%).

Screen Shot 2019-07-05 at 12.38.46

Those are some thoughts for now. I’d really encourage anyone reading this to delve into the full international reports and figure out what we can learn from these studies. Bravo to the DBE for participating in these types of studies and for their commitment to improving the system based on rigorous evidence emerging from them.

Screen Shot 2019-07-05 at 11.29.18

Screen Shot 2019-07-05 at 11.29.38

Hijacked by the urgent we neglect the important (SA Budget 2019)

lightbulb

(This article first appeared in the Financial Mail on the 21st of February 2019 under the title “Tablets won’t cure pupil problems“) 

Reading through the Treasury’s meticulous budget documents the contrast between the State of the Nation (SONA) and the Budget becomes starkly apparent. SONA is the aspirational shopping list the President gives the Finance Minister. The Budget is what is actually in the trolley when he walks out the shop. The President can announce whatever he likes but until it manifests in the Budget then it remains in the collective dreamscape of the ANC.

So, it should come as no surprise then that this budget wasn’t a SONA-Budget, it was an Eskom-budget. In a context of low growth and imminent catastrophe there is only so much that can be done. And if you can’t keep the lights on then nothing else matters anyway. Given that others will deal with Eskom, and the big push in infrastructure spending I will focus exclusively on Basic Education.

In short this was a business-as-usual education budget. Most of the sensational elements of the President’s SONA as far as education is concerned were conveniently left out of the budget. There was no mention of one-tablet-per-child and nothing about “two years of compulsory early childhood development (ECD)”. What a relief! There is no evidence that either of these would be a good use of limited funds. One tablet per child policies are universally regarded as being foolish, and have failed in every country they have been implemented, rich or poor. Existing evaluations of our current Grade R year indicate that children don’t actually benefit that much from it because the quality is so low. The received wisdom in the sector is to make Grade R worthwhile before adding on another low-quality questionable-value year of ECD.

To their credit, Treasury has prioritized the eradication of pit latrines in 2,400 schools by allocating an additional R2,8billion over the next three years. Interestingly, these funds won’t be given to provinces to spend – perhaps because the more dysfunctional provinces failed to spend their school infrastructure funds in the past – and instead will be managed nationally by the Department of Basic Education (DBE) and spent “on their behalf” (p.69). Perhaps this is a sign of the political times with a strong-handed national approach rather than the traditional federalist provincial implementation of policies.

While the least feasible (and most expensive) proposals from SONA were ignored, so were the most important and highest impact ones: focusing on fixing early grade reading. In the SONA the President explained that early grade reading “is possibly the single most important factor in overcoming poverty, unemployment and inequality” Well, not according to the Finance Minister because no money was allocated to it. There was no mention of reading at all except for some lip-service about an Early Grade Reading Assessment which is actually a pre-existing initiative and receives less than R10-million per year. This is a shame and represents yet another year that we kick the education can down the road. The problem with a business-as-usual budget is when business-as-usual isn’t working in education. The two most reliable international assessments South Africa takes part in either show a slow-down in progress (in Grade 9 mathematics between 2011-2015) or no improvement at all (in Grade 4 reading between 2011 and 2016) (see here). There are a number of reasons to speculate why results are stagnating. Due to a 13% surge in births in 2003-2005 (most probably due to ARVs) without a concomitant rise in education spending, we are seeing increases in the number of learners per class, rising from 40 to 45 learners per class in primary schools and 41-48 learners in no-fee schools (according to Pirls 2016). What we needed from this budget was a recognition that the long-term struggles of the country (unemployment, inequality, low growth) cannot be addressed when 78% of Grade 4 learners cannot read for meaning in any language. And that while reforming basic education is a long-term solution, long-term solutions have to start somewhere.

I have a lot of sympathy for Treasury officials who work tirelessly to make sure that the country is economically on track and deftly navigate the trade-offs, prioritization and budget constraints that are the real politics of any democracy. There is no doubt that neutralizing the Eskom threat was the number one challenge we needed to overcome in this budget. Yet there will always be a new urgent challenge that grabs our attention and is considered political dynamite – #FeesMustFall in 2017/18 Eskom in 2019/2020 – surely there will be others. Hats off to Minister Mboweni and his Treasury officials for steering us through the current crisis. Let’s hope his successor can move from dealing with crisis  upon crisis and instead start laying the foundations for long term progress.

Priorities for Education Reform (Background Note for Minister of Finance 19/01/2019)

screen shot 2019-01-19 at 10.45.43

19 January 2019.

My background note for the meeting with the Minister of Finance Tito Mboweni at the Treasury Economic Colloquium (19 January 2019; South African Reserve Bank), PDF Note HERE.

Overview: 

The education problem as it stands in January 2019:

  1. Learning outcomes: After initial improvements in learning outcomes – notably between 2003-2011 (TIMSS & PIRLS), now stalling progress in learning outcomes.
  2. Expenditure: Because of above-inflation wage increases for teachers, combined with a 13% increase in births 2003-2005 there has been an 8% decline in real per-pupil education expenditure since 2010.
  3. Politics: There is currently an unacceptably high level of undue political influence by the majority teacher union (SADTU) on the governance of basic education.
  4. Teachers: The majority of teachers (80%) lack the content knowledge and pedagogical skill to teach the subjects they are currently teaching. For example 79% of Grade 6 mathematics teachers cannot get 60% on a Grade 6/7 level maths test.
  5. Throughput: There is currently very low throughput rates to university: Of 100 learners that start school, approximately 50-60 will make it to matric, 40-50 will pass matric, and 14 will qualify to go to university. Only 6 will get an undergraduate degree within 6 years.
  6. Reading: Nationally representative surveys (PIRLS 2016) show that 78% of Grade 4 learners cannot read for meaning in any language (all 11 languages were assessed).
  7. Mathematics: Nationally representative surveys (TIMSS-N 2015) show that 61% of Grade 5 learners could not add and subtract whole numbers, have no understanding of multiplication by one-digit numbers and cannot solve simple word problems, i.e. they cannot do basic mathematics.
  8. Wastelands: Approximately half of South African primary schools (45%) could be described as “cognitive wastelands”, that is that not a single learner can read and make inferences. Similarly, in 47% of high-schools not a single child coule reach the intermediate international benchmark in mathematics. By contrast, the figure in Botswana is 2%.
  9. Technology: Access to technology in South African classrooms is low by international standards. The solution is functional computer laboratories not one-device-per-child.

Education priorities for reform:

  • Expenditure: Stop the decline in real per-learner education expenditure.
  • Radical prioritization and focusing on the Foundation Phase (Grade R-3)
  1. Fiscally prioritize Primary Schools.
  2. National Primary School Assessment.
  • A Ramaphosa Reading Plan
  1. Provide graded reader anthologies to every child in Grades R-3
  2. Recruit, train and employ a small army of Foundation Phase reading coaches.
  3. Provide a minimum box of educational resources to all classrooms starting with Gr1-3.
  4. Eliminate extreme class sizes.
  5. Eliminate grossly inadequate physical infrastructure.
  6. Technology in education
  • Depoliticize the bureaucracy: Separate bureaucratic and teachers’ unions.

Introduction

South Africa today is the most unequal country in the world. The richest 10% of South Africans lay claim to 65% of national income and 90% of national wealth; the largest 90-10 gap in the world (Alvaredo et al, 2018, p. 150; Orthofer, 2016). Given the strong and deeply historical links between education and the labour market these inequities are mirrored in the education system. Two decades after apartheid it is still the case that the life chances of the average South African child are determined not by their ability or the result of hard-work and determination, but instead by the colour of their skin, the province of their birth, and the wealth of their parents. These realities are so deterministic that before a child’s seventh birthday one can predict with some precision whether they will inherit a life of chronic poverty and sustained unemployment or a dignified life and meaningful work. The sheer magnitude of these inequities is incredible. The top 200 high schools in the country have more students achieving distinctions in Mathematics or Physical Science (80%+) than the remaining 6,476 high schools combined [1]. Put differently, 3% of South African high schools create more Mathematics or Physical Science distinctions than the remaining 97% put together. Of those 200 schools, 185 are former White-only schools and all 185 charge significant fees. Although they are now deracialized, 57% of the matrics in these top 200 schools were White. This is less surprising when one considers that in 2014/15, White South Africans still make up two-thirds of the ‘elite’ in South Africa (the wealthiest 4% of society) (Schotte et al, 2018, p. 98).

In a few years’ time when we look back on three decades of democracy in South Africa, it is this conundrum – the stubbornness of inequality and its patterns of persistence – that will stand out amongst the rest as the most demanding of explanation, justification and analysis. This is because inequality needs to be justified; you need to tell a story about why this level of inequality is acceptable or unacceptable. As South Africans what is the story that we tell ourselves about inequality and how far we have come since 1994? Have we accepted our current trajectory as the only path out of stubbornly high and problematically patterned inequality? Are there different and preferential equilibria we have not yet thought of or explored, and if so what are they? In practical terms, how does one get onto a higher economic growth path that is both sustainable and inclusive? Does anyone really know how to ‘create’ jobs apart from higher growth and a more skilled workforce? The latter of which is not possible without improving the education system, so how does one get to a more equitable and improved distribution of teachers, resources or learning outcomes? And what are the political, social and financial price-tags attached to doing so? These are the questions that should stand front and centre in our national discourse and with which the next elected government must grapple. 

The education problem as it stands in January 2019

  • (1) After initial improvements, now stalling progress in learning outcomes: There is now a growing body of reliable and consistent findings documenting gains in learning outcomes, particularly between 2002 and 2011 (see Van der Berg & Gustafsson, 2019 forthcoming for a full discussion). As more corroborating evidence emerges, the position that learning outcomes have not improved in South Africa – or that “education is worse than it was under apartheid” (Ramphele, 2016) – is increasingly becoming a fringe view that is not supported by the data or serious scholars. Because South Africa participates in a number of international assessments that are comparable over time and across countries we can compare our performance in maths, reading and science over time fairly accurately. Broadly speaking one can see three periods which could loosely be referred to as (1) a ‘stagnating’ phase (1995-2003) where learning outcomes did not improve at all (neither in maths between TIMSS 1995, 1999 and 2003, nor in reading between SACMEQ 2000 and 2007), (2) the ‘improving’ phase (2003-2011) where learning outcomes improved relatively quickly, supported by maths data from TIMSS 2003-2011, SACMEQ 2007-2013 and reading data from PIRLS 2006-2011, and (3) the ‘stalling’ phase (2011-2016) where gains have flattened out as evidenced by the lower gains in mathematics in TIMSS 2011-2015 and particularly the lack of any improvement in reading between PIRLS 2011-2016.

screen shot 2019-01-19 at 09.54.35

While the international assessments are the most reliable indicators of progress in education, there are also other pieces of supporting evidence, including the fourfold increase in black university graduates between 1994 (11,339 black graduates) and 2014 (48,686 black graduates) (Van Broekhuizen, 2016: p.12), and the large increase in the number of matriculants receiving mathematics marks which make them eligible for engineering at university, increasing from 18,601 to 25,054 between 2002 and 2016 (Van der Berg & Gustafsson, 2019).

  • (2) An 8% decline in real per-pupil education expenditure since 2010: One of the underappreciated trends of the last seven years is the declining per-learner public expenditure on basic education in real terms. To be specific, between 2010 and 2017 there has been an 8% decline in per learner expenditure in purchasing power terms[2]. The reason this fact has gone largely unnoticed in South Africa is that they are hidden in aggregate figures and discounted using the wrong inflation rate. The total expenditure on basic education has increased by 7,1% per year between 2010 and 2017 to keep up with Consumer Price Index (CPI) inflation over the period. But CPI is the wrong index to deflate education expenditures since more than 80% of expenditures are on teacher salaries rather than a typical basket of goods. The salient question when calculating real expenditures on education is thus, “What resources are required in 2017 to buy the same level of inputs used in 2010?” While inflation meant that the average basket of goods in 2017 was 38% more expensive than it was in 2010, teacher salaries over the same period increased by 57% due to above-average-inflation wage agreements in the Education Labour Relations Council (ELRC). The second, and more important factor, is that the total number of learners across which the budget must be spread has been increasing significantly. Between 2003 and 2005 there was a large increase in births[3] of around 13% which led to a 13% rise in Grade 1 enrolments from 2009 to 2015 which has been largely unnoticed by government officials (Gustafsson, 2018). Although births per year did come down somewhat in around 2008, the current levels are still higher than the pre-2003 levels. Seen together, these two factors explain why there has been an 8% decline in per learner expenditure on basic education between 2010 and 2017. The decline in state funding over the last seven years is already starting to show up in international assessments. According to PIRLS the average class size in Grade 4 was 40 in 2011 which has now increased to 45 learners per class in 2016 (Howie et al., 2017: 13, 127). Among the poorest 60% of learners, class sizes experienced by the average learner increased from 41 to 48 learners per class between 2011 and 2016 (own calculations). For the richest 10% of learners, class sizes increased from 33 to 35 learners per class over the same period. This decline in funding is one of the leading explanations for the ‘stalling’ of educational improvement since 2011 described above.

Figure 2: Current provincial per learner expenditure on basic education 2010 to 2019 (Own calculations using real cost drivers and expressed in 2017 Rands, 2017-2019 projections based on MTEF)

screen shot 2019-01-19 at 10.06.38

  • (3) Undue political influence by the majority teacher union (SADTU): The most recent and authoritative account of the accountability problems faced in the sector comes in the form of a 2016 report by the Ministerial Task Team headed by Professor John Volmink formed to investigate fraud and corruption in the sector, and specifically the sale of teacher and principal posts for cash and livestock (Department of Education, 2016). They found that the dominant teacher union – the South African Democratic Teachers Union (SADTU) was in “de facto control” (p.119) of the education departments in six of the nine provinces in the country. The investigators report that “all the Deputy Directors-General in the Department of Basic Education are SADTU members and attend meetings of that Union” and conclude that, “it is not improbable to say that schooling throughout South Africa is run by SADTU” (Department of Education, 2016; p.93). The Minister of Basic Education Ms Angie Motshekga has largely ignored the recommendations of the Task Team and instead asked the provincial departments to report on what they are doing to address the issues contained in it. The lack of action on this is widely believed to be due to union opposition to the report.
  • (4) A lack of teacher capacity: No education system can move beyond the quality of its teachers. There is now a large body of evidence in South Africa attesting to the fact that the majority of South African teachers do not have currently have the content knowledge or pedagogical skills necessary to impart the curriculum. In a nationally representative sample of primary schools, it was found that 79% of Grade 6 Mathematics teachers could not score 60% or higher on Grade 6 or 7 level questions (Venkat & Spaull, 2015).

Figure 3: Proportion of South African grade 6 mathematics teachers by content knowledge (CK) group – SACMEQ 2007 (with 95% confidence interval) (Venkat & Spaull, 2015: p.127).

screen shot 2019-01-19 at 10.08.22

  • (5) Low throughput to university: Of 100 children that start school, approximately 60 will reach and write matric, 37 will pass and 12 will access university. Only 4 will complete an undergraduate degree within 6 years. Low through-put rates and weak performance in high school is rooted in weak foundations from primary school (Spaull & Kotze, 2015, Van der Berg et al., 2016).

Figure 4: The qualifications pyramid in South Africa (Van Broekhuizen et al., 2016)

screen shot 2019-01-19 at 10.09.18

  • (6) 78% of primary school children do not learn to read in Grade 1-3: Learning to read for meaning is the most critical skill children learn in primary school. It is the skill upon which all other skills depend. The South African curriculum stipulates that children should “learn to read” in Grades 1-3 and then “read to learn” in Grade 4 onwards. Thus they should be able to read for meaning by the end of Grade 3 in their home-language and in English. The recent Progress in International Reading Literacy (PIRLS 2016) study showed that 78% of South African Grade 4 children could not read for meaning in any language, that is they could not “locate and retrieve an explicitly stated detail.” Comparable figures in other countries are 64% (Morocco), 35% (Iran), 13% (Chile), and 3% (United Kingdom) (Mullis et al., 2017a).
  • (7) 61% of primary school children do not learn basic mathematics by Grade 5: Learning to use the four operations effectively and with confidence is one of the most essential mathematical skills children learn in primary school. According to the Trends in International Mathematics and Science Study (TIMSS 2015), 61% of South African Grade 5 learners could not do basic mathematics, that is they could not add and subtract whole numbers, have no understanding of multiplication by one-digit numbers and cannot solve simple word problems (Mullis et al., 2017b).
  • (8) Half of SA primary schools are “cognitive wastelands”: One method of determining the educational possibilities in a school is to look at the highest achieving learner in a class (the maxima distribution). This can be thought of as the ‘ceiling’ that is possible in that school. In 45% of South African Grade 4 classrooms there was not a single student that could read in their home language and make inferences (the PIRLS Intermediate International Benchmark). These schools likely require quite radical interventions to improve results. To quote Van der Berg & Gustafsson (2019, p:19 forthcoming) who apply the same method and look at TIMSS Grade 9:

“In 47% of [South African high] schools there was not a single learner who reached 475 points, the TIMSS Intermediate International Benchmark. In this respect South Africa did much worse than any other country… [The comparable figure in Botswana is just 2%]. The comparison with Botswana is particularly important, because Botswana is within the same region but also because both Botswana and South Africa tested Grade 9. In the context of South Africa’s skills shortfall and the need for more black professionals, it is particularly problematic that a large segment of the schooling system are in effect ‘academic wastelands’ which do not produce even a single learner performing at the intermediate international benchmark.

Figure 5 below illustrates this point by showing the “effective” grade that children are in at each stage of the schooling process. If we look at the no-fee schools (poorest 80% of schools), learners are approximately 2,5 years behind the curriculum in Grade 3. By Grade 9 they are 4-5 years behind the curriculum, showing the compounding effect of not getting primary school learning right.

Figure 5: South African mathematics learning trajectories by national socioeconomic quintiles using a variable standard deviation for a year of learning (0.28 in grade 3 to 0.2 in grade 8 with interpolated values for in-between grades (Based on NSES 2007/8/9 for grades 3/4/5, SACMEQ 2007 for grade 6 and TIMSS 2011 for grade 9, including 95% confidence interval (See Spaull & Kotze, 2015: p.21)

screen shot 2019-01-19 at 10.11.29

Education priorities for reform:

  • (1) Stop the decline in real per-learner education expenditure: It is difficult to think of any scenario where the South African education system becomes significantly more equitable with fewer resources than it has now. If anything, a decline in public funding is likely to exacerbate inequalities since it would increase the resource gap between fee-charging and no-fee schools. Although initially caused by a spike in births and above-inflation teacher wage increases, this decline is likely to be sustained with increasing funding pressure from Free Higher Education commitments and low economic growth
    • Response: Appoint a Task Team & address in budget speech. The Minister of Finance should constitute a small task team to determine the causes, extent and consequences of the decline in per learner real expenditure and increase funding in the February Budget Speech. Any additional funds should be explicitly ring-fenced for evidence-based interventions like providing graded readers, reading coaches and lesson plans to all primary schools.
  • (2) Radical prioritization and focusing on the Foundation Phase (Grade R-3): The first step towards fixing the education system is ruthless prioritization. South Africa does not have the financial resources, political capital or human expertise to solve many problems at the same time. Policy-makers and politicians need to accept that underperformance in matric and high drop-out rates are rooted in weak foundations in primary school and specifically in Grades R-3. If 78% of Grade 4’s cannot read for meaning in any language they are precluded from success at school. In mathematics, only a third of South African children are equipped to succeed which can reliably be traced back to primary school (Spaull & Kotze, 2015). We typically look at the approximately 360,000 matrics who pass (30%+) either Maths or Maths Literacy (2017) which is about 36% of the original cohort. Yet if we look at Grade 9 we see that only 34% of Grade 9’s could do basic maths (TIMSS 2015), and if we look even earlier at Grade 5 we see that only 39% of Grade 5’s acquired basic numeracy (TIMSS-N 2015). Clearly underperformance in high school and matric is driven by underperformance in primary school.
    • Response: Fiscally prioritize Primary Schools. Institute an expenditure and hiring freeze on all additional programs and posts that are not targeted at numeracy and literacy in primary schools. At the most basic level the Post-Provisioning-Norms (PPN) should be adjusted to ensure fewer teachers for high-schools and more teachers for the Foundation Phase (Grades R-3). Both the Western Cape and the Eastern Cape have taken this approach and shown considerable success in doing so.
    • Response: National Primary School Assessment. Implement a universal national assessment at Grade 3, 6 and 9 testing reading and mathematics. South Africa is the only country in the region without a nation-wide primary school exam. Without information on achievement one cannot target support or monitor progress.
  • (3) A Ramaphosa Reading Plan: From the evidence presented above it is clear that the majority of South African learners are not receiving a quality education, or one that could be considered adequate. They leave primary school unable to read for meaning (basic literacy) or calculate with confidence (basic numeracy). The root of this can be found in the fact that 78% of learners do not learn to read for meaning in any language in the Foundation Phase. This is the source of the biggest problem and therefore must be the site of the biggest intervention.
    • Response: (1) Provide graded reader anthologies to every child in Grades R-3. One of the most effective methods of teaching children to read is using what are called ‘graded-readers.’ These are available in all ex-Model C schools and are ubiquitous in OECD countries. They are a set of numbered stories that start with one word-texts (Story 1) and get incrementally more difficult until they are fully fledged texts (Story 66). These can be distributed together with the DBE Rainbow Workbooks simply by extending existing logistics and procurement contracts that are known to work (99% of DBE Workbooks reach their intended school). When using openly licensed graded readers (Vula Bula series) and printed in an anthology format (20 stories per book) the cost is drastically reduced. The ECDOE has proven the viability of this model in 2018 for use in 2019 when it distributed isiXhosa graded readers to every Foundation Phase child in the province. In September 2018, it printed 824,345 isiXhosa anthologies at a cost of R8 per color book (Personal Communication with DDG Penny Vinjevold) which were distributed in November 2018 to all primary schools in the province for use in 2019. To implement this in all Foundation Phase classes (Grade R-3) in the country would cost an estimated R24-million per annum. The print-ready files of these anthologies are already available in all official SA languages and have been evaluated and approved by literacy experts. They were used in Gauteng Primary Literacy and Mathematics Strategy (GPLMS), the Early Grade Reading Study (EGRS) and by the National Education Collaboration Trust (NECT). Given the low cost and potential high-impact of this intervention it is, as they say, a no-brainer.
    • Response: (2) Recruit, train and employ a small army of Foundation Phase reading coaches. There is now strong evidence that the best way of improving learning outcomes throughout the system is by focusing on basic literacy and numeracy in the first three years of school. In South Africa, there have been a number of studies evaluating different methods of teacher training (centralized training, on-site coaching, cluster workshops etc.). The DBE’s Early Grade Reading Study (EGRS) Randomized Control Trials in the North West and Mpumalanga (200+ schools) have shown that the only method that improves reading outcomes significantly is a package of resources that includes (1) an expert reading coach that visits teachers in their classrooms, (2) lesson plans that guide teachers on how to use the resources, and (3) graded readers, Big Books and posters. In schools that received this intervention there was a 40% improvement in reading outcomes within two years as compared to control schools (Taylor et al., 2017). With a small army of reading coaches, resources, and lesson plans you could reach half of all primary schools within 8 years and it would cost approximately R1,3billion per year (Personal Communication, Stephen Taylor, DBE).
    • Response: (3) Provide a minimum box of educational resources to all classrooms starting with Grade 1-3. The provision of the DBE Rainbow Workbooks to all primary schools in the country was arguably the largest single improvement to basic education since the advent of democracy. Although they are A4 and in full-colour, each book costs only R4 to print since they have no copyright and are printed in large volumes (Personal Communication Veronica McKay, 11 Jan 2019). This model of printing license-free (Creative Commons) materials in large volumes using a central government printer significantly lowers the cost of providing learning and teaching support materials. Rather than assuming teachers and schools have the time, knowledge and administrative capacity to select each textbook, workbook, poster etc and order these through cumbersome procurement processes (and therefore it doesn’t happen), the Department should centrally determine a “minimum box of resources” per grade that every teacher teaching that grade receives. For example, providing every Foundation Phase teacher with 40 Big Book Stories (one per week), 40 posters, Lesson Plans, Phonics Frieze, Alphabet Frieze, Phonics Cards, Alphabet Cards, and a basic set of stationery costs R2,770 per teacher (this is the LTSM cost per teacher per year of the Funda Wande Literacy Intervention in the Eastern Cape, i.e. using only Creative Commons licensed Vula Bula materials.) To provide this minimum box of LTSM for all primary school classrooms in the country would cost approximately R731million per year (There are approximately 33,000 teachers per grade in SA).
    • Response: (4) Eliminate extreme class sizes. It is estimated that at least 10% of Foundation Phase learners in the Eastern Cape and Limpopo are in classes where the class size is 60 learners per class or higher (Spaull, 2016). Eliminating extreme classes of 50 or more learners per class, particularly in the Foundation Phase (Grade R-3), should be prioritized.
    • Response: (5) Eliminate grossly inadequate physical infrastructure. The fact that SA is a middle-income country yet still has children that drown in pit latrines, and that hundreds of thousands of learners and teachers are forced to attend schools that do not have water, electricity or dignified sanitation should be a source of national shame. The President should appoint a task team (equipped with high-level politicians, civil engineering executives, union representatives etc.) to come up with a plan to eliminate all major infrastructure backlogs (water, electricity, sanitation) within the President’s first term. Note every South African president since the transition has promised to eliminate these unsafe schools yet here we are in 2019 and there are still thousands of them.
    • Response: (6) Technology in education. There is currently a surge of interest in technology in education and specifically a new proposal to provide one-device-per-child. This is one area that has been studied quite extensively in various developing countries and the evidence consistently shows that providing technology to individual learners is not the most cost-effective method of improving learning outcomes and in every country where it has been implemented it was deemed a failure. (See Michael Trucano’s 2014Questions to ask (and not to ask) when your president tells you to buy 100k (or a million) tablets for students”). A sensible approach to increasing South African schools’ ICT readiness would involve (1) Prioritizing functional computer laboratories for high-schools (not primary schools), (2) providing all teachers with laptops, as well as (3) Ensuring more high-school learners take Computer Applications Technology (CAT) as a subject and increasing the number and quality of teachers who can teach this subject. For example, the number of Grade 12 learners passing Computer Applications Technology (CAT) is quite low at about 35,000 (7% of all candidates) and is actually declining (2018 NSC Report, p. 57). The ‘Action Plan 2019’ makes explicit mention of the severe inequalities that prevail with respect to access to more technical subjects (p. 31). For example, half of white males take technical subjects, against 5% for black African males. Only a quarter of schools writing the NSC offer CAT, and these are concentrated in quintiles 4 and 5: 67% of quintile 5 schools and 46% of quintile 4 schools offer CAT, against just 14% in quintiles 1 to 3 (in quintile 1 it is a mere 6%). Breaking the patterns of white and middle-class advantage by giving access to technical subjects is an important step towards a more equitable education system. This could be achieved by a goal to “Ensure that by 2024 half of quintiles 1 to 3 schools will begin offering Computer Applications Technology facilitating employment in the 21st Century workplace”.
  • South Africa: There have been a number of initiatives in South Africa to implement various ICT-related programs and roll-outs, particularly in Gauteng and the Western Cape. A recent overview by Ostrowick (2016) summarizes the evidence (see Appendix B; see also Meyer & Gent, 2016). An evaluation of the Khanya Computer Labs project in the Western Cape (Louw et al, 2008) found “substantial variability in implementation” but did find a positive impact for those that used it. The Western Cape’s ‘e-Education Game Changer’ and Gauteng’s experimentation with SmartBoards and laptops for children are both instructive about the logistical complexities with using technology in education. There is also a recent MSDF-funded report conducted by AC Kearney (Draft copy 15 Jan 2019) on “Education Data and Tool Landscape Diagnostic review e-education in South Africa” that will be published at the end of January 2019.

Figure 6 below indicates that South African high-schools lag behind other developing countries when it comes to access to computers. However the evidence-based approach to remedy this is (1) focus on ensuring all high-school have functional computer laboratories (rather than one device per child, (2) piloting and evaluating teacher development programs on the use of ICT-in-teaching, (3) piloting and evaluating different software and apps to see which of these are most likely to be beneficial to learners and teachers.

Figure 6: Comparison of access to computers in high schools using TIMSS Gr8 2003-2015 (Source: Martin Gustafsson, 2019).

screen shot 2019-01-19 at 10.14.01

Summary of the evidence from comparison countries:

  • Global review (Colombia, Peru, China, Netherlands, US, India, Israel, Romania, England, Netherlands, Ecuador): In a recent rigorous review of 26 studies on the use of hardware in teaching published in the American Economic Review, Muralidharan et al., (2018) find that the bulk of studies (67%) in 11 countries find no result at all (40%) or an ambiguous result with some positive and some negative results (27%). Only 27% of the studies found positive results and a minority found negative results (6%). Sample sizes for studies with “no impact” were often large and program intensity was substantial (Muralidharan, Singh & Ganimian, 2018: Appendix C). These studies are summarized in Appendix A below.
  • Peru: Large-scale randomized control trial in 319 primary schools of the roll-out of One-Laptop-Per-Child in rural Peru: “No evidence is found of effects on enrollment and test scores in Math and Language…the time allocated to activities directly related to school does not seem to have changed. The program did not affect attendance or time allocated to doing homework. Second, it has been suggested that the introduction of computers increases motivation, but our results suggest otherwise. Third, there is no evidence the program influenced reading habits…Finally, the program did not seem to have affected the quality of instruction in class” (Inter-American Development Bank, 2012: p3).
  • Colombia: Randomised Control Trial evaluation of “Computers for Education” in 97 schools in Colombia. The findings showed no improvement in learning outcomes: “Overall, the program seems to have had little effect on students’ test scores and other outcomes. These results are consistent across grade levels, subjects, and gender. The main reason for these results seems to be the failure to incorporate the computers into the educational process. Although the program increased the number of computers in the treatment schools and provided training to the teachers on how to use the computers in their classrooms, surveys of both teachers and students suggest that teachers did not incorporate the computers into their curriculum” (World Bank, 2009: p2).
  • Kenya: USAID conducted a large-scale Randomized Control Trial comparing three interventions aimed at improving early literacy using technology: (1) student e-readers, (2) teacher tablets, and (3) tablets for Instructional Supervisors. “The Kisumu ICT study allowed for a comparative analysis of the impact of ICT on learning outcomes in Kenya when interventions took place at three different levels in the education system: student, teacher, and instructional coach. The results of all three of the Kisumu County interventions showed that literacy outcomes can be improved. Despite great excitement over ICT interventions to support literacy, however, technology is not a cure-all for the poor literacy outcomes in Kenya and other countries in sub-Saharan Africa. In this case, whereas technology may have helped TAC tutors to better provide instructional support, we found no evidence that providing tablets to teachers or e-readers to students was more effective than the base PRIMR literacy program that was implemented without expensive ICTWhen costs are considered, there are non-ICT interventions that could have larger impacts on learning outcomes with lower costs.” (Piper et al., 2016: p213).
  • Los Angeles: In March 2013 the largest school district in the United States (Los Angeles Unified School District, LAUSD) entered into a $1,3-billion contract with Apple and Pearson to provide 650,000 iPads and a Pearson-developed digital curriculum. Despite a functional and somewhat sophisticated education bureaucracy the project was deemed an outright failure: “In March 2014 [1 year after implementation] nearly all schools had stopped the usage of the Pearson curriculum due to crippling technical problems and incompleteness… Due to immense pressure and criticism, Deasy [The Superintendent General] resigned from the school district in October 2014. In December 2014 LAUSD officially terminated the contract with Apple as a result of frequent problems on the daily use of the curriculum, which frequently interrupted normal learning in schools. Based on these problems and following the termination of the contract, LAUSD sought a refund from Apple (Alami, 2016: p65).
  • Depoliticize the bureaucracy: Teacher unions play an important role in South Africa advocating for the interests of teachers. There is no reason why members of the national and provincial education bureaucracies should be allowed to be members of a teacher union if they are not teachers and do not work in a school. The interests of teachers and those of the government are often contradictory (for example managing a bloated budget on the one hand and wanting to increase teacher salaries on the other). If high-level officials in the DBE are paid-up teacher union members (as all the DDGs in the DBE are) the union technically sits on both sides of the bargaining table. The widespread perception that promotion in the provincial and national bureaucracies is only possible with SADTU is problematic for accountability and creates a conflict of interest.
    • Response: Separate bureaucratic and teachers’ unions. While obviously members of the provincial and national Departments of Basic Education should be allowed to unionize, they should not be allowed to join a teacher’s union, given that they are not teachers. There is no reason why Departmental officials and in-school teachers need to e part of the same union. This would require passing legislation requiring that for someone to be a member of a teacher union they cannot work for the national or provincial Department of Basic Education.


References:

  1. Kerney. 2018. Education Data and Tool Landscape Diagnostic in South Africa. December 2018 Draft (162 pages)

Alami, A. (2016) Why do Technology Projects Fail? Procedia Computer Science 100 (2016) 62 – 71

Alvaredo, F., Chancel, L., Piketty, T., Saez, E., & Zucman, G. 2018. World Inequality Report 2018. Online. Available: http://wir2018.wid.world/ [Accessed: 26 June 2018]

Department of Basic Education. 2016. Report of the Ministerial Task Team Appointed by Minister Angie Motshekga to Investigate Allegations into the Selling of Posts of Educators By Members of Teachers Unions and Departmental Officials in Provincial Education Departments. Department of Basic Education. Pretoria

Inter-American Development Bank. (2012). Technology and Child Development: Evidence from the One Laptop per Child Program. IDB Working Paper Series No. IDB-WP 304.

Martin Gustafsson, 2018. “Understanding the sharp primary level enrolment increases beginning in 2011,”Working Papers 08/2018, Stellenbosch University, Department of Economics.

Mullis IVS, Martin MO, Foy P, Hooper M (2017) Pirls 2016: International Results in Reading. International Association for the Evaluation of Educational Achievement

Muralidharan, K., Singh, A., & Ganimian, A. J. (2018). Disrupting education? Experimental evidence on technology-aided instruction in India. American Economic Review, Working Paper.

Orthofer, A. Welath inequality in South Africa: Evidence from survey and tax data. REDI3x3 Working paper 15. June 2016.

Piper, B., Zuilkowski, S., Kwayumba, D., & Strigel, C. (2016). Does technology improve reading outcomes? Comparing the effectiveness and cost-effectiveness of ICT interventions for early grade reading in Kenya. International Journal of Educational Development 49 (2016) 2014-214

Ramphele, M. 2012. Education system worse than under apartheid: Ramphele. Mail & Guardian 23 March 2012. (Online). Available: https://mg.co.za/article/2012-03-23-education-system-worse-than-under-apartheid-ramphele [Accessed: 26 June 2018]

Schotte, S., Zizzamia, R., & Leibbrandt, M. (2018). A poverty dynamics approach to social stratification: The South African case. World Development 110 (2018) 88-103.

Spaull, N. and Kotze, J. (2015). Starting behind and staying behind in South Africa: The case of insurmountable learning deficits in mathematics. International Journal of Educational Development. Vol 41 (March) pp12-24

Spaull, N. (2016). Excessive class sizes in the Foundation Phase. Research on Socioeconomic Policy (RESEP). Policy Brief. Apr/2016.

Trucano. M (2016). Questions to ask (and not to ask) when your president tells you to buy 100k (or a million) tablets for students. World Bank. EduTech. (Online). Available: https://blogs.worldbank.org/edutech/educational-tablets-questions-to-ask

Van Broekhuizen, H. 2016. Graduate unemployment and Higher Education Institutions in South Africa. Stellenbosch Economic Working Paper Series WP08/2016. Stellenbosch, South Africa.

Van Broekhuizen, H., Van der Berg, S., & Hofmeyr, H. (2016) Higher Education Access and Outcomes for the 2008 National Matric Cohort. Stellenbosch Economic Working Paper 16/16 (Online). Available: http://resep.sun.ac.za/wp-content/uploads/2018/07/wp-16-2016_1.pdf

Van der Berg, S. & Gustafsson, M. (2019). Educational Outcomes in Post-Apartheid South Africa: Signs of Progress Despite Great Inequality. In “South African Schooling: The Enigma of inequality (Eds: Spaull, N & Jansen, J). Springer.

Van der Berg, S., Spaull, N., Wills, G., Gustafsson, M., & Kotzé, J. (2016) Identifying the Binding Constraints in Education. Report commissioned by the South African Presidency and funded by the European Union’s Programme to Support Pro-Poor Policy Development (PSPPD) initative.

Venkat, H. and Spaull, N. 2015. What do we know about primary teachers’ mathematical content knowledge in South Africa? An analysis of SACMEQ 2007. International Journal of Educational Development. Vol. 41 Mar. p.121-130.

World Bank. (2009). The Use and Misuse of Computers in Education: Evidence from a Randomizes Experiment in Colombia. Policy Research Working Paper 4836.

Appendix A: Summary table of Muralidharan et al.’s, (2018) overview of technology in education interventions

screen shot 2019-01-19 at 10.41.10

Appendix B: Status of Technology in SA Schools (Source: Ostrowick, 2016)

Screen Shot 2019-01-19 at 10.41.39.png

Screen Shot 2019-01-19 at 10.41.51.png

Appendix C: Over-arching findings of MSDF-funded AC Kearney report “Education Data and Tool Landscape Diagnostic in South Africa” (2019)

Screen Shot 2019-01-19 at 10.42.08.png 

[1] This is based on my own calculations on the Matric 2014 National Senior Certificate data (i.e. it does not include IEB candidates, but does include independent schools that write the NSC. ‘Top’ here is defined as the largest number of mathematics distinctions (80%+). In almost all of these schools there are at least 9 mathematics distinctions per school. Note also that 23 of the 200 schools are independent schools writing the NSC exam.

[2] This is based on my own calculations using Treasury’s Estimates of Public Revenue and Expenditure (EPRE) data which is available on their website.

[3] This demographic phenomenon has been confirmed by Home Affairs birth registration data as well as age-specific data in the Department of Basic Education’s Annual Survey of Schools (ASS) and the Learner Unit Record Information Tracking System (LURITS). The leading explanation is that the rise in births coincides with the roll out of Anti-retroviral (ARV) treatment. Thus larger cohorts of children have been moving through the schooling system, with the ‘surge’ reaching Grade 8 in 2018

Universities headed for a perfect storm (#Matric2018)

perfect storm

Last week the Minister of Basic Education, Angie Motshekga, announced the matric pass rate of 78% to the usual fanfare and political theatre to which we have all grown accustom. To her credit she emphasized the importance of early learning and ensuring that all children learn to read for meaning by the age of 10 and the need for improving Early Childhood Development. Since the release most commentators have chosen to focus on (1) inter-provincial results (Gauteng came out on top), (2) questions about the “true” matric pass-rate (of 100 children that started Grade 1 in 2007, only 51 made it to matric, 40 passed and 17 got bachelor’s passes. So, the pass mark of 78% is probably more like 40% if you take into account the 400,000 kids that drop out the system before matric). And a few people focused on (3) gender; for every 100 girls in matric there are only 82 boys, mainly because boys do worse than girls at school and dropout in higher numbers.

But not many people have focused on the surge in bachelor passes compared to last year. In 2017 there were 153,610 bachelor passes which increased to 172,043 in 2018, a massive 12% increase year on year. And this wasn’t because 2018 happened to be a bigger cohort than 2017, in fact it was slightly smaller than last year with 4,422 fewer matrics. So why was there such a big increase? I think the leading explanation is a change in policy in March last year (Government Gazette 41473-No.165:213) which changed the criteria for getting a bachelor’s pass by abolishing the “designated list” of subjects.  This went largely under the radar at the time. To get a bachelor pass before the change in policy you needed to get (1) 40% in your home-language, (2) at least 50% in four other subjects from the “designated list”, and 30% for one other subject. The “designated list” was a list of 18 subjects and includes the usual suspects like Accounting, Business Studies, Economics, Geography, Mathematics, Mathematics Literacy, History, Consumer Studies etc. Now that the list has been abolished, you can get 50% in any subject offered in matric. For example, now you can get 50% in Tourism, Computer Applications Technology, Dance and Hospitality (among others) and still qualify. Some of these subjects have very high enrolment. A total of 130,000 odd learners took Tourism in 2018 and 98% of them passed. About 32,000 learners took Computer Applications Technology and 92% passed. (The pass rates in Dance and Hospitality are 100% and 99% respectively).  So, if you got 40% for your home-language (which almost everyone does), 50% in Dance, Tourism, Hospitality and Consumer Studies, and 30% in Mathematics Literacy you get a bachelor’s pass and qualify to go to university. This is the first year that this has been the case.

In my view, this is quite clearly the leading explanation for the increase in bachelor passes in 2018. If you look at the largest nine ‘traditional’ subjects (Mathematics, Mathematics Literacy, Physical Science, Accounting, Business Studies, Economics, Geography, History, Life Science) there was actually a decrease of 2% in the total number of students getting 40%+ in these subjects (the Department doesn’t report 50%+ but we can assume similar trends). So, it’s clearly not because there were more students doing better in ‘traditional’ subjects.

As an aside, in 2014 Higher Education South Africa (HESA) commissioned a study titled “The Value of Designated Subjects in Terms of the Likely Student Success in Higher Education” and concluded that “Adding additional subjects to this [designated] list may flood an already over-subscribed public higher education system with more under-prepared students.” (HESA, 2014: p10). Go figure.

So why a perfect storm? Well there are basically three reasons: (1) We now have “free” higher education, which the overwhelming majority of students qualify for. This is one reason to think that enrolments would have increased this year anyway, (2) It’s an election year which means that any student-pressure in February will be politically difficult to ignore, and (3) there is now a large wave of additional students (18,433 more than last year) that qualify for university entrance and many of whom won’t be able to be accommodated. We know these are weaker students on average and therefore not as academically equipped to succeed at university in the coming years. Enrolment increases of weaker students coupled with funding pressure and an election means higher education is probably headed for a rough few years ahead.

Education research…

barca

This week was the 2018 AEDE conference in Barcelona and Prof Lorraine Dearden gave the keynote address: “Higher Education Funding, Access and Returns: Policy Lessons from England” which was so relevant for South Africa given all the recent decisions about free higher education for poor and working class students. I include some slides from her presentation:
Screen Shot 2018-06-29 at 15.46.29
Screen Shot 2018-06-29 at 15.46.37
Screen Shot 2018-06-29 at 15.46.52
Screen Shot 2018-06-29 at 15.47.04
—————————————————————————-
Some other great papers (and abstracts) from the conference:
Screen Shot 2018-06-29 at 10.15.44


screen-shot-2018-06-29-at-15-41-21.png


EGRS: Probably the most important education research/intervention post-apartheid

EGRS logo final Setswana

Breaking News: New ‘gold-standard’ study finds improvement of 40% of a year of learning in reading for disadvantaged children in South Africa. (At least that would be the title I’d pick if I was a sub-editor reporting on EGRS!)

In South Africa and around the world today there are many reasons to be despondent – whether about inequality, the environment or some of our political overlords. But every now and then we learn of truly amazing things that are happening despite all the shit in the world, and the Early Grade Reading Study (EGRS) is the best example of this in South Africa. The researchers leading the study were Stephen Taylor (DBE), Brahm Fleisch (Wits) and Mpumi Mohohlwane (DBE).

For those of you who don’t already know about it, have you been living under a rock? The EGRS study was a large randomised control trial that aimed to determine which (if any) interventions improve early grade reading outcomes in home language (Setswana) in 230 Quintile 1-3 schools in the North West province in South Africa. It was implemented in 2015 (Grade 1) and 2016 (Grade 2) and today the final results of the intervention were released and they are very encouraging! I would suggest everyone reads the EGRS Policy Summary Report and I include the great infographics below:

Screen Shot 2017-08-16 at 2.05.49 PM

Screen Shot 2017-08-16 at 2.06.09 PM

Screen Shot 2017-08-16 at 2.06.18 PM

Screen Shot 2017-08-16 at 2.06.33 PM

There are also three additional EGRS reports: