Category Archives: Popular press

The stories we tell ourselves about inequality

south-africa-inequality-impakter

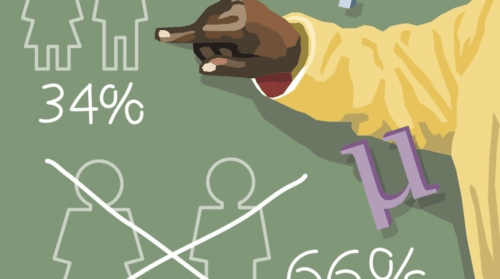
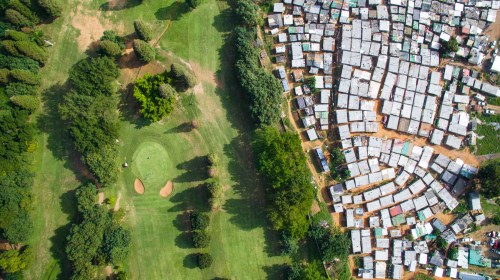
South Africa today is the most unequal country in the world. The richest 10% of South Africans lay claim to 65% of national income and 90% of national wealth; the largest 90–10 gap in the world. These inequities are mirrored in the education system where we have 20% of schools that are broadly functional, and 80% that are mostly dysfunctional. Because of this, two decades after apartheid it is still the case that the life chances of the average South African child are determined not by their ability or the result of hard-work and determination, but instead by the colour of their skin, the province of their birth, and the wealth of their parents. These realities are so deterministic that before a child’s seventh birthday one can predict with some precision whether they will inherit a life of chronic poverty and sustained unemployment or a dignified life and meaningful work. The sheer magnitude of these inequities is incredible. We have private schools charging R300,000 a year, and public schools where children drown in pit latrines. Last year (2018), the top 200 high schools in the country had more students in matric achieving distinctions in Mathematics (80%+) than the remaining 6,600 combined. Put differently 3% of South African high schools produce more Mathematics distinctions than the remaining 97% put together.

In a few years’ time when we look back on three decades of democracy in South Africa, it is this conundrum – the stubbornness of inequality and its patterns of persistence – that will stand out amongst the rest as the most demanding of explanation, justification and analysis. This is because inequality needs to be justified; you need to tell a story about why this level of inequality is acceptable or unacceptable. As South Africans what is the story that we tell ourselves about inequality and how far we have come since 1994? Have we accepted our current trajectory as the only path out of stubbornly high and problematically patterned inequality? Are there different and preferential equilibria we have not yet thought of or explored, and if so what are they? In practical terms, how does one get to a more equitable distribution of teachers, resources or learning outcomes? And what are the political and financial price-tags attached to doing so?

Our post-apartheid education system is currently an awkward fusion of apartheid systems serving post-apartheid societies. What the apartheid government used to perpetuate privilege and to act as a lever for rapid poor-White social mobility, post-apartheid society uses as a lever for Black middle-class mobility. Today Black and Coloured learners make up 60% of those attending former White-only fee-charging schools. Thus, a small, separate and functional school system, created to privilege one section of the population and exclude others remained intact but the discriminating principle simply morphed over time from race to fees. We now have a ‘pay-to-play’ system. If you want your child to have a decent shot at life, you need to get them into a good school. In that sense, school fees have become the current price of dignity in South Africa.

Reflecting on our particular journey out of apartheid, we can see that our country has become a case study of how politics and policy interact with unequal starting conditions to perpetuate a system of poverty and privilege. We are witnessing a process unfolding where an unjustifiable and illegitimate racial education system (apartheid) morphs and evolves to one that is more justifiable and somewhat non-racial, all the while accommodating a small privileged class of South Africans who are not bound to the shared fate of their fellow citizens.

The post-apartheid government has made important strides in trying times; educational outcomes are really improving, the Child Support Grant has significantly reduced poverty and deprivation for large swathes of the country, and access to basic services have undeniably improved across the board. Yet we must also be honest and say that our collective political imagination has come up short. We lack a believable vision of a more equal country where everyone has basic dignity, and even more so, we lack a believable plan of how to get there.  While there has been some tinkering around the edges of the political and economic possibilities available to us, we cannot point to a country-wide initiative that has made significant inroads into the gross inequity that is visible everywhere we look.

We need bolder policies and bolder politicians. We need our elected officials to actually visit the pit latrines that our children drown in. Consultants prophesying coding and tech must actually speak to children in the 26% of South African schools that still don’t have running water in 2019. Let them drink laptops. Surely we can muster the political will and societal shame to put an end to these visceral daily injustices? We need officials who have the courage and the mandate to fire corrupt or incompetent officials currently shuffling between government ministries with no consequences. But we also need those with the moral clarity to take on comfortable elites who resist wealth taxes, land reform and social housing. Whatever the story is that we keep telling ourselves to justify our obscene levels of inequality, the poor and excluded will not believe it forever.

//

This article first appeared in the Financial Mail on the 24th of October 2019). It is an extract from my chapter in our new book “South African Schooling: The Enigma of Inequality” which is co-edited by myself and Jonathan Jansen (published by Springer in November 2019).

“Matric really does start in Gr1” – my M&G/Teacher article on TIMSS 2015

screen-shot-2017-01-31-at-7-05-23-am

(The article below first appeared in The Teacher magazine in January, and in the Mail & Guardian on the 27th of January 2017)

The month of January is an interesting one in the South African calendar. It seems that this is the one time in the year when everyone cares about education, or more accurately, cares about matric. And in some senses there is a good reason for this; matric is the gateway to higher education. If we look at 25-35 year olds in the 2011 Census data we see that for those with less than a matric, 47% were unemployed (using the broad definition), compared to 33% among those whose highest qualification was a matric and only 8% for those with a bachelors degree. While matric used to be the big distinguisher between the haves and have-nots, increasingly the difference is between those with some kind of tertiary qualification and everyone else. And in 2016, as usual, mathematics proved to be a tough gateway subject for those who want to study further. Only one in three learners who wrote Mathematics in 2016 got 40% or more in the subject, with a recent study showing that only about 15,000 matrics achieved 70% or more in mathematics. That’s about 1,5% of students who start school in Grade 1.

As anyone familiar with maths will tell you, the subject is a hierarchical one that builds upon itself. You need to understand multiplication and division before you can understand fractions or rate and proportion. So where do the wheels come off? Is it just before matric, perhaps in Grade 9 or 10? Or even earlier in Grade 4 or 5? To shed some light on this question we can turn to some recent mathematics research published by the Human Sciences Research Council (HSRC) at the end of last year. Every four years South Africa participates in an international study of mathematics achievement called the Trends in International Mathematics and Science Study or TIMSS. We test a nationally-representative sample of Grade 5 and Grade 9 learners on a standardised international test, which is the same test that is written by thousands of other students in other countries and allows us to compare ourselves to these other countries. (Although almost all the countries test their Grade 4 and Grade 8 students on these tests). The most recent round of tests was done in 2015.

The results showed that only 34% of our Grade 9 learners could do basic mathematics, i.e. could reach the lowest international benchmark. That is to say that 66% of our learners could not do basic computations or match tables to bar graphs or read a simple line graph. They had not acquired a basic understanding about whole numbers, decimals, operations or basic graphs. However there was one piece of encouraging information that emerged from the study and that was that the number of students that could do basic mathematics increased from 24% in 2011 to 34% in 2015 in South Africa, one of the fastest improvements seen internationally.

But if 66% of our Grade 9 learners can’t do basic maths, when did these gaps emerge? In 2015, for the first time in our history, South Africa also participated in the primary-school level of TIMSS that usually tests Grade 4 learners – we tested our Grade 5 learners. It showed that 61% of Grade 5 learners could not reach the Low International Benchmark. Learners who do not reach the low international benchmark at the primary level cannot add and subtract three or four digit whole numbers like 218 and 191. They do not recognise familiar geometric shapes or parallel and perpendicular lines. They cannot read and complete simple bar graphs and tables. For example, according to our curriculum, multiplying a 3-digit number by a 1-digit number is meant to be covered in Term 1 of Grade 4 yet only 41% of our Grade 5 learners could calculate “512 x 3 =____”, which was one of the questions in 2015. So almost 60% of our Grade 5 learners are already significantly behind the curriculum in 2015.

The conclusion that the root of our problems is not in high school but rather much earlier, in the lower grades of primary school is not a new finding – there are many studies showing this from at least 1999. In a report published nearly 10 years ago, one South African education researcher (Dr Eric Scholar) analysed the mathematics achievement in 154 schools across the country. He concluded that the low levels of achievement we see in the higher grades are rooted in weak foundations in primary school. To quote his exact conclusion:

‘‘The fundamental cause of poor learner performance across our education system is a failure to extend the ability of learners from counting to true calculating in their primary schooling. All more complex mathematics depends, in the first instance, on an instinctive understanding of place value within the base-10 number system, combined with an ability to readily perform basic calculations and see numeric relationships … Learners are routinely promoted from one Grade to the next without having mastered the content and foundational competences of preceding Grades, resulting in a large cognitive backlog that progressively inhibits the acquisition of more complex competencies. The consequence is that every class has become, in effect, a ‘multi-Grade’ class in which there is a very large range of learner abilities and this makes it very difficult, or even impossible, to consistently teach to the required assessment standards for any particular Grade. Mathematics, however, is a hierarchical subject in which the development of increasingly complex cognitive abilities at each succeeding level is dependent on the progressive and cumulative mastery of its conceptual frameworks, starting with the absolutely fundamental basics of place value (the base-10 number system) and the four operations (calculation)’’

While as a country we continue to obsess about the matric pass rate, the research is really quite clear. The majority of our young people are acaquiring learning deficits early on in primary school and then carrying these with them as they move through school. As they are promoted into higher grades there is a decoupling between what learners know and can do and what the curriculum expects from them. We need to acknowledge that matric starts in Grade 1 (and even earlier), and that it really is possible to improve primary schooling if that is where we focus most of our time, energy and resources.

My M&G article on Universities in 2017

screen-shot-2017-01-08-at-1-10-29-pm

(The above article was published in the Mail & Guardian on the 6th of January 2016 and is available in PDF here).

Students contest the status quo 

Over the last two years, universities in South Africa have become increasingly contested spaces. Student movements like RhodesMustFall and FeesMustFall have categorically rejected the status quo as unacceptable and are working to reorder not only the principles that govern universities, but ultimately the principles that govern the country. Of course the first order of business is challenging our current assumptions about who should go to university, what it should look like, and who should pay for it. And on all three fronts they have been phenomenally successful. It is really quite remarkable that a loose group of students who lack a political mandate, who have not been elected by anyone, and have virtually no resources have managed to achieve so much so quickly. They have brought whole universities to their knees and prompted the creation of a Presidential Task Team. Most significantly they garnered enough support to essentially force the government to allocate an additional R17 billion to higher education in the Medium Term Budget.

About 200 years ago, Napoleon Bonaparte famously quipped that a revolution is simply an idea which has found its bayonets. In the context of the various student movements I think it’s worthwhile to try and identify the underlying idea, its animating principle. As the student movements assemble and reassemble under different names (seemingly quite effortlessly), I think there is a leitmotif running through all of them; the unfinished business of 1994. There is a generation of young Black South Africans who feel that the terms of the negotiated settlement were unjust and let White South Africans off the hook. Dr Amos Wilson. a theoretical psychologist and social theorist, makes the logic behind this position explicit in the following quote:

“Justice requires not only the ceasing and desisting of injustice but also requires either punishment or reparation for injuries and damages inflicted for prior wrongdoing. The essence of justice is the redistribution of gains earned through the perpetration of injustice. If restitution is not made and reparations not instituted to compensate for prior injustices, those injustices are in effect rewarded. And the benefits such rewards conferred on the perpetrators of injustice will continue to “draw interest,” to be reinvested, and to be passed on to their children, who will use their inherited advantages to continue to exploit the children of the victims of the injustice of their ancestors. Consequently, injustice and inequality will be maintained across generations as will their deleterious social, economic, and political outcomes.”

Thinking that the various incarnations of the student movements are primarily about universities is a mistake. RhodesMustfall was not about a statue; it was about reclamation and power and history. Similarly, the challenge today is not only about who should pay fees, but who should own the land. The discontent and anger about the ‘pay-to-play’ market system that we have – where only those who can pay for quality get it – is as much about private hospitals and Model-C schools as it is about universities. The true contested space at our universities at the moment is really about the principles that currently order our society and reimagining different ones.

Fighting for a different future

There are students in South Africa today who look at our country and refuse to accept that the way we are currently doing things is the only way they can be done. How is it that in a country with considerable wealth and resources that we still have 10 million people living on less than R10 a day? Whenever I land at Cape Town International Airport and get an aerial view of Khayelitsha, I think to myself “How the heck can we, as a country, not find a dignified solution to housing for the poor?” In Cape Town we have 400,000 people living in shacks a mere 40-minute drive from the house that sold for R290-million in Bantry Bay. We have decadent opulence living next to extreme poverty. It’s not right.

And so we come back to the contested space at universities where people have different ideas about how we get from where we are to a better future. Students associated with Black-First-Land-First argue for land expropriation without compensation. The Nobel Laureate Thomas Piketty motivates for much steeper wealth and inheritance taxes to level the playing field. The Wits SRC has proposed a once-off ‘apartheid windfall’ tax on “companies that benefited unfairly by abusing state resources” under apartheid.

But since the current discussions at universities are still centred on fees and access to university, let’s start there and think about what 2017 might hold for universities, and put some numbers on the table. Personally I think we will actually find a sustainable solution to student financing at universities, possibly even in 2017. Sizwe Nxasana – the head of the Presidential Task Team – has developed a highly sophisticated and workable model of student funding called the Ikusasa Student Financial Aid Programme (ISFAP) that is being trialled at seven universities this year, focussing on students studying medicine, engineering and accounting. This is essentially a public-private partnership which aims to “significantly increase the funding and resources which are made available to support students from working class families to graduate and find employment by leveraging private sector funding.” One can think of it as a three-tier model with the poorest students being fully funded with grants and the missing-middle with a combination of grants and income-contingent loans (to be repaid only if the recipient does graduate and earns above a certain amount). Then finally, those at the top that can pay fees do pay fees. While it isn’t free education for everyone – and the vanguard may therefore not accept it – if implemented properly it has a good shot at ensuring that no student is excluded from university on financial grounds. That would be a significant achievement.

Thankfully, many in the sector are now realising that needs-blind allocations to higher education – where all students are equally subsidised – are socially regressive and anti-poor. This is largely because the children of the wealthy attend fee-charging schools that give them a much better shot at qualifying for university than the children of the poor. We know that less than 1 in 10 children from the poorest 70% of households qualify to go to university compared to 1 in 2 or 3 children (40%) among the wealthiest 10% of households. And because of this, if one allocated an additional R10bn to higher-education in a blanket fashion, then about R6,8bn (68%) will end up benefitting the wealthiest 20% of South African households because it is their children who are disproportionately at university (according to two fiscal incidence studies). A recent study showed that 60% of students that qualified for university came from the 30% of high schools that charged fees. What is the point of raising revenue by additional taxes on the richest 20% only to give two thirds of that money straight back to them in the form of indirect subsidies to their children?

So if we agree that the rich should not be subsidised (usually defined as those in households with annual income of more than R600,000), how many students would need funding? Professor Servaas van der Berg’s analysis of household surveys has shown that about 60% of the current university-going population would be eligible for funding. (This assumes that income is under-captured in surveys by about 30% . Importantly, this would cover 73% of Black African university students and 30% of White university students.

While ending financial exclusion at university won’t solve the thornier issues in South Africa – about land, inequality, restitution, primary education, unemployment – it would serve as a powerful and invigorating example that things really can be different to what they are now. It would be poetic if the start of a successful campaign for a different South Africa could trace its origins to the toppling of a statue of Cecil John Rhodes.

Dr Nic Spaull is an education researcher at the Research on Socioeconomic Policy (RESEP) group at Stellenbosch University. He is on Twitter @NicSpaull


Matric 2015 standardisation matters

denial

OK so I got a little frustrated with explaining the whole matric standardisation vibe to a million people, so here’s the deal once and for all…

Soon after the matric results jamboree ended and people went back to work, there were a few unanswered questions about how the matric exams of 2015 were standardised by Umalusi. Already in September of 2015 I was asking some Departmental officials whether the Minister was going to report the matric results of progressed and non-progressed learners separately (which is what I would’ve done). The logic being that the public (wrongly) view the matric exam as the main indicator of the health of the education system and that if progressed learners were lumped with non-progressed learners there would be excess pressure to ensure that the matric pass rate did not drop too much. But this is not the approach that the DBE took. I also emailed someone in Umalusi to ask how they were planning on doing their standardisation given that the two groups of matrics (2014 and 2015) were so different, with the latter having many more students due to the progressed learner policy.

After comparing the publicly-available Umalusi statement and the publicly available DBE NSC Technical Report 2015 it became possible to see how large the Umalusi adjustments were this for 2014 and 2015 for nine subjects – see table below.

Screen Shot 2016-01-24 at 1.27.52 PM

I won’t rehash my full argument here (if you’re interested read my article Matric Cracks Starting to Show). The yellow highlighted subjects are those that had big jumps in enrolments, for example there were an extra 76,791 learners taking maths-literacy in 2015 compared to 2014. Notice that the pass rates increased substantially between the raw pass rate and the pass rate after (1) Umalusi adjustment, (2) language compensation, (3) school-based assessment. The gist of that article was to say that the progressed learners of 2015 were not properly accounted for in the Umalusi standardisation process and that the most logical reason for a drop in performance of the raw marks was the inclusion of extra (weaker) learners, i.e. progressed learners, rather than a much more difficult exam.

bother

Subsequent to my article, the CEO of Umalusi, Dr Rakometsi, wrote a reply titled “Promoted pupils had no big effect on matric rates” and clarified a number of issues. For the sake of brevity I will summarize the most salient points here:

  • Umalusi was told by the DBE that there were only 66,088 progressed learners
  • If one excludes these 66,088 progressed learners then the failure rate within subjects increased by between 1% and 4%.
  • He confirmed that “the pass rate on raw marks is at 38% for maths-literacy
  • The maximum adjustment that Umalusi can make is 10 percentage points which was applied for mathematics literacy “because the paper turned out to be more difficult in 2015 compared to previous years. As a results of this maximum adjustment, 27% of learners who scored between 20-29% obtained a pass”
  • One paragraph in the article is particularly important and so I quote it verbatim:

“The report indicates that the impact of progressed learners to the individual subjects was minimal. As a result, there was no basis to standardise the results of the progressed learners separately. What we call progressed learners is actually only the KNOWN progressed learners. The argument that there were more is an assumption. Umalusi can only work on the information before it, not on assumptions and extrapolations.”

From the above we can draw two important conclusions:

(1) The 66,088 progressed learners were not excluded when the results were standardised relative to earlier years, despite knowing that these learners were weaker students. This seems totally bizarre. We know that these are weaker learners, why would we include them in the norm-referencing curve and compare to earlier years were these students did not exist? Even if they only contributed to a drop in the pass rate of between 1-4% why were they excluded?

2) (the most important conclusion) Umalusi only looked at the 66,088 “officially” progressed learners and ignored all the other information suggesting that there might be additional weaker learners who were actually progressed learners but were not captured as progressed learners, what I called “quasi-progressed” learners in my article. We know that provinces are not recording who is a progressed learner with the same accuracy.

Perhaps the most telling evidence is just to ask how many extra matrics there were in 2015 compared to 2014? The answer is 111,676 (644,536 in 2015 compared to 532,860 in 2014). But if there were only 66,088 progressed learners, where did the remaining 45,588 learners come from?

dissolve

Some have suggested that it’s from a change of age policy that happened in 1998, but that lead to a small cohort in 2011/2012 not now, as Stephen Taylor has shown using EMIS data. The table below (taken from here) shows the different enrolment numbers by year and grade. What we can see is that the matric class of 2011 was always going to be small  If we look at the matric class of 2011 there were 534,498 learners in matric and only 930,019 learners in grade 8 four years earlier. Basically we knew that the matric class of 2011 was going to be smaller. Whereas if we look at the matric class of 2015 (with 687,230 learners according to this table) this is unexplainably big. If we look at the grade 8 cohort of 2011 we see that there were 1,008,110 which is only about 7000 learners more than the grade 8 class of 2010. So how are we to explain the massive difference we see when we compare the 2014 and 2015 matrics (111,676)?

Screen Shot 2016-01-24 at 2.04.53 PM

In my mind the answer is straight-forward – the extra learners in matric 2015 are the direct result of trying to decrease grade repetition by “promoting” weaker learners into higher grades rather than fail them. If this is correct then we needed to exclude the full 111,676 learners when standardising relative to earlier years. Umalusi will (and has) argued that this was not possible and that they did not even try to take into account of quasi-progressed learners.

head banging

So those of you that’ve read this far might be asking “So who cares? Why is this even important?” and the answer is that it matters a lot for universities and the labour-market if Umalusi gets this wrong.  If the standardisation process assumed that a drop in the raw marks was only due to an increase in test difficulty (which is what Umalusi did) when a more plausible explanation was that it was because we included an extra 21% of weaker learners, then the real value (and signal) of a basic matric is actually declining over time.

On page 171 of the 2014 Ministerial Task Team Review of the NSC we read the specifications of when Umalusi can and cannot adjust matric marks:

“Reasons for differences may include: cohort differences, changes in curriculum, changes in setters of the examination papers, disruptions in the schooling processes and security leakages. In the absence of evidence of such possible reasons, it is then generally accepted that the differences are due to deviations in the standards of the examination or marking and therefore marks are adjusted to compensate for the deviations (Umalusi 2007a, 29).” [emphasis added]

Personally I do think that some of these tests increased in difficulty, but it is ludicrous to think that adding 21% more students who are KNOWN to be weaker students would not decrease the marks. Also this is the first year where basically all adjustments were upward. There was not a single downward adjustment. Coincidence much?

thats messed up

Just because Umalusi could not identify the quasi-progressed learners doesn’t mean they can just ignore them. Hence the cartoon above. It would seem that Umalusi has essentially said “Yes we can see that the cohort is much bigger. Yes we can see that there was a clear policy intervention to progress weaker learners. Yes we can see that the official numbers of progressed learners do not match with the full increase in the size of the cohort. But we are going to pretend that there were only 66,088 progressed learners. We refuse to accept any other reality because we can’t do anything about it anyway so what’s the use in knowing.

The fact that the marks were pushed up primarily at the bottom (probably too much) means that students passed in 2015 who would not have passed in 2012. It means students have qualified to study basic degrees in 2015 who would not have qualified if they wrote in 2012. So, if I’m right, any of the following could result:

  • There will be a flood of applications for degrees and diploma’s that require the lowest levels of matric points. Thousands more students will have ‘met the criteria’ and the universities would not have not anticipated this. In fact I have already heard that UNISA has had an unprecedented increase in applications, Edgewood at UKZN has been swamped. Damelin has a huge spike in applications. If I’m right then these students should never have qualified for university and will fail. They might incur debt, move province, make life decisions based on incorrect signal. (Let us not speculate on how the surge in applications for NSFAS will stoke the FeesMustFall fire and mean that there is less to go around and more angry students with hopes and dreams that the State cannot fulfil.
  • Universities will see students that are not even remotely prepared for higher academic study and will have to increase their access programs and expect higher failure rates.
  • As a result of the above the universities will increase the matric-point requirements for entry into their programs for 2017 (particularly programs like B.A, B.Soc-Sci, B.Ed etc.). They will also start to rely more on the National Benchmarking Tests in their selection criteria. [Sidebar, researchers should compare NBT results with matric results in 2013, 2014 and 2015 to see if there are any differences that might be attributable to wrongly-boosted matric marks]. 
  • The gap between the earnings of those with a matric and those with a matric+degree will grow (note it is already large, see graph below). This is largely because the adjustment was primarily at the bottom meaning there are many more students with a low-level-matric who have, in effect, lower levels of knowledge and skill than low-level-matrics of 5 years ago.

Screen Shot 2016-01-24 at 2.30.15 PM

(Source: Hendrik van Broekhuizen, 2013, here)

As I said, none of the above precludes the fact that the tests were more difficult in 2015 (although this is still speculation). I am only saying that there is no way in my mind that including an extra hundred thousand weaker learners didn’t play any part in the drop in the raw marks. And, in essence, that is what Umalusi is arguing.

oprah no

Dr Rakometsi and I will be discussing this on the Redi Hlabi show at 10am tomorrow (25 Jan 2016). It should be an interesting discussion 🙂

redi-tlhabi_detail.jpg

The ideal school system to get one’s head around [my Sunday Times article]

photo

[This article first appeared in the Sunday Times on the 25th of January 2015, it is also available online on Daily Maverick]
Earlier this month the MEC for Basic Education in KwaZulu-Natal, Ms Nelisiwe Peggy Nkonyeni, announced the provincial results of the 2014 matric class. Reading through her speech, it was difficult to know whether to laugh, cry or scream, and in the end one could but shake one’s head in disbelief.

After re-reading the speech, and checking online that this wasn’t in fact a hoax, one could only settle on anger and outrage. Reading through the concluding remarks of Nkonyeni’s speech, it is not hard to see why.

“As I conclude, I revisit the thoughts that guide my innermost conscience in the execution of my responsibilities. Visions of an ideal education system dominate my thinking. In the realm of my thought world, I wish […] That our system could have graphologists who would analyse the uniqueness of each child’s handwriting and channel them accordingly […] That philosophy could be a subject offered at a basic education level so that the system could produce critical thinkers; that chess lessons could be offered to all mathematics learners in order to improve their mathematical schools; and that our system could train and produce phrenologists who would study the shape of a child’s head at Grade R so that we channel the children accordingly”

(MEC Nkonyeni, 7 Jan 2015).

I’m sorry, but you really cannot make this kind of stuff up. Essentially, we can summarise the above and say that the four things that “dominate” the thinking of the KZN MEC for Basic Education are graphology, philosophy, phrenology and chess. Given that there is some international research showing that chess and philosophy can have a positive impact on educational achievement, I will put those two aside for now and discuss the other two issues. This is not to say that I see chess and philosophy as solutions to our education crisis (I don’t), but only that the other two – phrenology and graphology – are so outlandishly ridiculous and unscientific that I do not want to lend them credibility by association.

To be clear, phrenology aims to make judgements about a person’s character and mental capacity based on the structure of their skull, while graphology aims to make similar judgements by analysing the physical characteristics and patterns of their handwriting. Both of these fields are generally considered pseudo-science, since they have no scientific evidence base whatsoever, and have been debunked for over 100 years already.

The fact that MEC Nkonyeni uses these fringe theories to “guide her innermost conscience” and is on record stating that they dominate her “vision of an ideal education system” is deeply problematic. We are talking about the most basic possible level of scientific literacy. To quote one definition of scientific literacy, it refers to “distinguishing scientific facts and theories from pseudoscientific beliefs such as those found in astrology, alchemy, medical quackery and the occult”. If we are willing to stream our children in Grade R based on phrenology and graphology, why not horoscopes and palm readings?

One might be tempted to brush off these statements as harmless rhetoric from a left-field thinker and that these beliefs couldn’t possibly make their way into public policy. However, it would be wise to recall what happened in the province under her leadership as MEC for Health a decade ago. Based on her medical beliefs, she refused to give the go-ahead for the use of ARVs in the treatment of HIV-positive individuals, claiming that they were toxic and had bad side effects. Instead, she encouraged HIV-positive people to take uBhejane, an untested herbal concoction. As we all know, anti-retroviral therapy is now the standard of care for those who are HIV positive. The fact that this life-saving treatment was denied to hundreds of thousands of people for many years because of the MEC’s pseudo-scientific beliefs is one of the enduring scars on our country’s medical history. Seen in this light these statements about phrenology and graphology don’t seem so harmless anymore.

These are not just the careless statements of an unimportant politician. Ms Nkonyeni is the MEC for Basic Education in our most populous province. She is directly responsible for the education of every child in KwaZulu-Natal, i.e. 2,901,697 children in 6,151 schools (23% of all South African students, to be specific). She also oversees the largest single provincial budget in the country (R39,4 billion). And she wants to stream your children when they are six years old based on the size and shape of their skulls?! You cannot make this stuff up.

As an educational researcher in South Africa, I am deeply concerned that these are the principles that are guiding the educational leadership of KwaZulu-Natal. We have more than enough problems dealing with the education crisis in our country as it is. Careless statements about pseudo-scientific beliefs undermine the legitimacy of the education department in KZN and cast doubt on the strategic direction of education in the province. MEC Nkonyeni needs to clarify her views on graphology and phrenology and issue a public statement assuring parents that they will not influence education policy in the province in any way, shape or form. “Those who cannot learn from history are doomed to repeat it.