
The article below first appeared in the Business Day on the 16th of April 2018. Their link here.
It’s not every day that Treasury reports can make you want to drink in the middle of the day. Then again, it’s not every day you realise a country-wide crisis has been brewing under your nose for a decade and no one noticed it. Over the last seven years there has been a consistent decline in the purchasing power of per-learner expenditure on basic education and no one has said a thing. To put it bluntly, funding per learner has declined by 8% in seven years. In so many ways this undoes any of the advances we think we might have made in education over the last seven years.
For a while now we’ve known that something funny happened in South Africa between 2003 and 2005 when births spiked by 13% and continued to stay high for a few years before coming down slightly in 2008. The leading explanation at the moment is the roll out of antiretrovirals (ARVs) over the same period. True to form, Grade 1 enrolments spiked by 13% five years later in 2008 with subsequent enrolment data showing this cohort slowly working its way through the education system with similarly large cohorts following in their footsteps each year. This group, which we’ve dubbed the ‘silent ship’ in our research group, is now in grade 8 in 2018. This weird demographic phenomenon has been confirmed by Martin Gustafsson’s comprehensive analysis of three different datasets; the Home Affairs birth registration data as well as age-specific data in the Department of Basic Education’s Annual Survey of Schools (ASS) data and the Learner Unit Record Information Tracking System (LURITS).
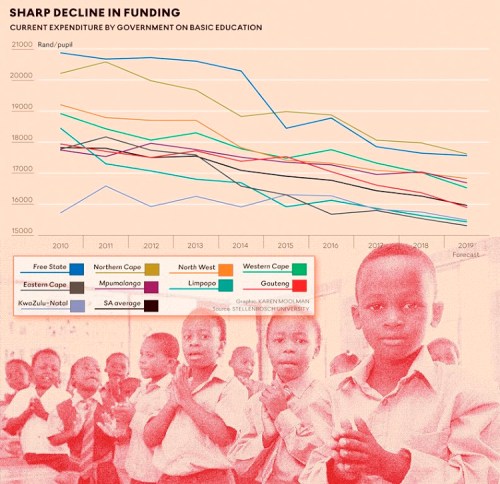
The aggregate effect of these increased births (and higher retention in the schooling system more generally) has meant that there were about 670,000 more learners in 2016 than there were in 2010. That means larger classes together with fewer books and fewer teachers per learner. But this is only half the story behind this unknown crisis. The other half is that there have been above-inflation increases in teacher salaries for over a decade. A decade of government gazettes together with Treasury’s Estimates of Provincial Revenue and Expenditure (EPRE) documents shows that between 2010 and 2016 teacher salaries increased by 57% compared to a 38% increase in the CPI (regular inflation). The problem with this is that total expenditure on education has only been increasing by inflation, or about 7% a year and therefore hasn’t kept up with these two factors (increased enrolment and above-inflation salary increases). Seen together this has translated into a significant decline in the purchasing power of expenditure on basic education between 2010 and 2017. Looking at the Medium Term Expenditure Framework the decline is set to continue. In 2010 we spent R17,822 on average per child dropping to R16,435 in 2017 and projected to decrease further to R15,963 by 2019 (all in 2017 Rands). This is a 10% decline in per learner funding in ten years (2010 to 2019).
This decline in state funding is already starting to show up in international assessments. According to the Progress in International Reading and Literacy Study (PIRLS) the average class size of Grade 4 classes in South Africa was 40 in 2011 which has now increased to 45 learners per class in 2016. Yet this masks that the largest increases were found in the poorest schools. Among the poorest 60% of learners, class sizes increased from 41 to 48 learners per class between 2011 and 2016. For the richest 10% of learners, class sizes only increased from 33 to 35 learners per class. Over the same period there was no improvement in reading outcomes across the country. It’s highly unlikely that this systematic decline in per learning spending over the last seven years is unrelated to the stagnant learning outcomes reported in PIRLS over the same period.
Given the centrality of correct discounting to the overall findings here it is worth briefly explaining why using a traditional inflation rate is inappropriate for education. This is also likely the reason that this fact has gone largely unnoticed in South Africa. Essentially, because total expenditure on basic education has increased by 7,1% per year between 2010 and 2017 – keeping up with the Consumer Price Index (CPI) inflation over the period – most analysts have thought that the education budget has been keeping pace with the overall rise in costs. But CPI is the wrong index to deflate education expenditures because more than 80% of expenditures are on teacher salaries rather than a typical basket of goods. The salient question when discounting expenditures on education is thus, “How much money is required in 2017 to buy the same level of inputs used in 2010?” To do this requires the construction of an education-specific discounting index that is weighted at 80% of the cost of teachers (calculated using wage-bargaining agreements in the Education Labour Relations Council) and 20% weighted at regular CPI (for non-personnel expenditures like textbooks). Using this composite index allows us to ask how much it would cost to buy the basket of education ‘goods’ that we bought in 2010 (80% teachers and 20% non-teachers). The results are alarming. Figure 1 above shows the overall trend in per learner purchasing power in each province between 2010 and 2019 (all figures in 2017 Rands and 2017 to 2019 figures are based on MTEF projections).
All of the above is even more concerning in the context of ongoing fiscal austerity and significant increases in budget allocations to higher education. As a result of the #FeesMustFall movement, former President Zuma announced a new government policy of free higher education for poor and working-class families (reiterated by President Ramaphosa in 2018). This is now reflected in the 2018/19 budget where Higher Education received an additional R57 billion over the next three years to fund the new mandate. Basic education is being thrown under the bus as higher education becomes the new shining star.
Without detracting from the importance of decreasing financial exclusion to higher education for poor and working-class students, it must also be stressed that at most 15% of a cohort go to higher education in South Africa. Among the poorest 70% of the population it is less than 5% of a cohort who actually enter university. The battle is won or lost in primary school. Given the hierarchical nature of schooling and that university access and success are predicated in the foundations built in primary school and high school, it is an extremely short-sighted policy to continue on the current trajectory of declining per-pupil public expenditure on basic education and rising per-pupil public spending on higher education.
To all who have the inclination to look it is clear that the low quality of primary schooling in South Africa is the binding constraint – both to further educational success, but also to dignified employment, meaningful civic engagement and economic growth. Our most recent assessments show 78% of Grade 4’s can’t read for meaning and 66% of Grade 5’s can’t do basic maths. There is no conceivable route for South Africa to move from the status quo to any desirable future that does not first chart the route of significant improvements in primary education. And to put it bluntly, that is simply not possible when the overall pie is shrinking, a shrinking that is felt most severely by the poorest learners in the most challenging contexts. Treasury needs to re-assess how it is funding basic education and explain why there has been a significant decline in the actual resources available on the ground to educate South African learners.


