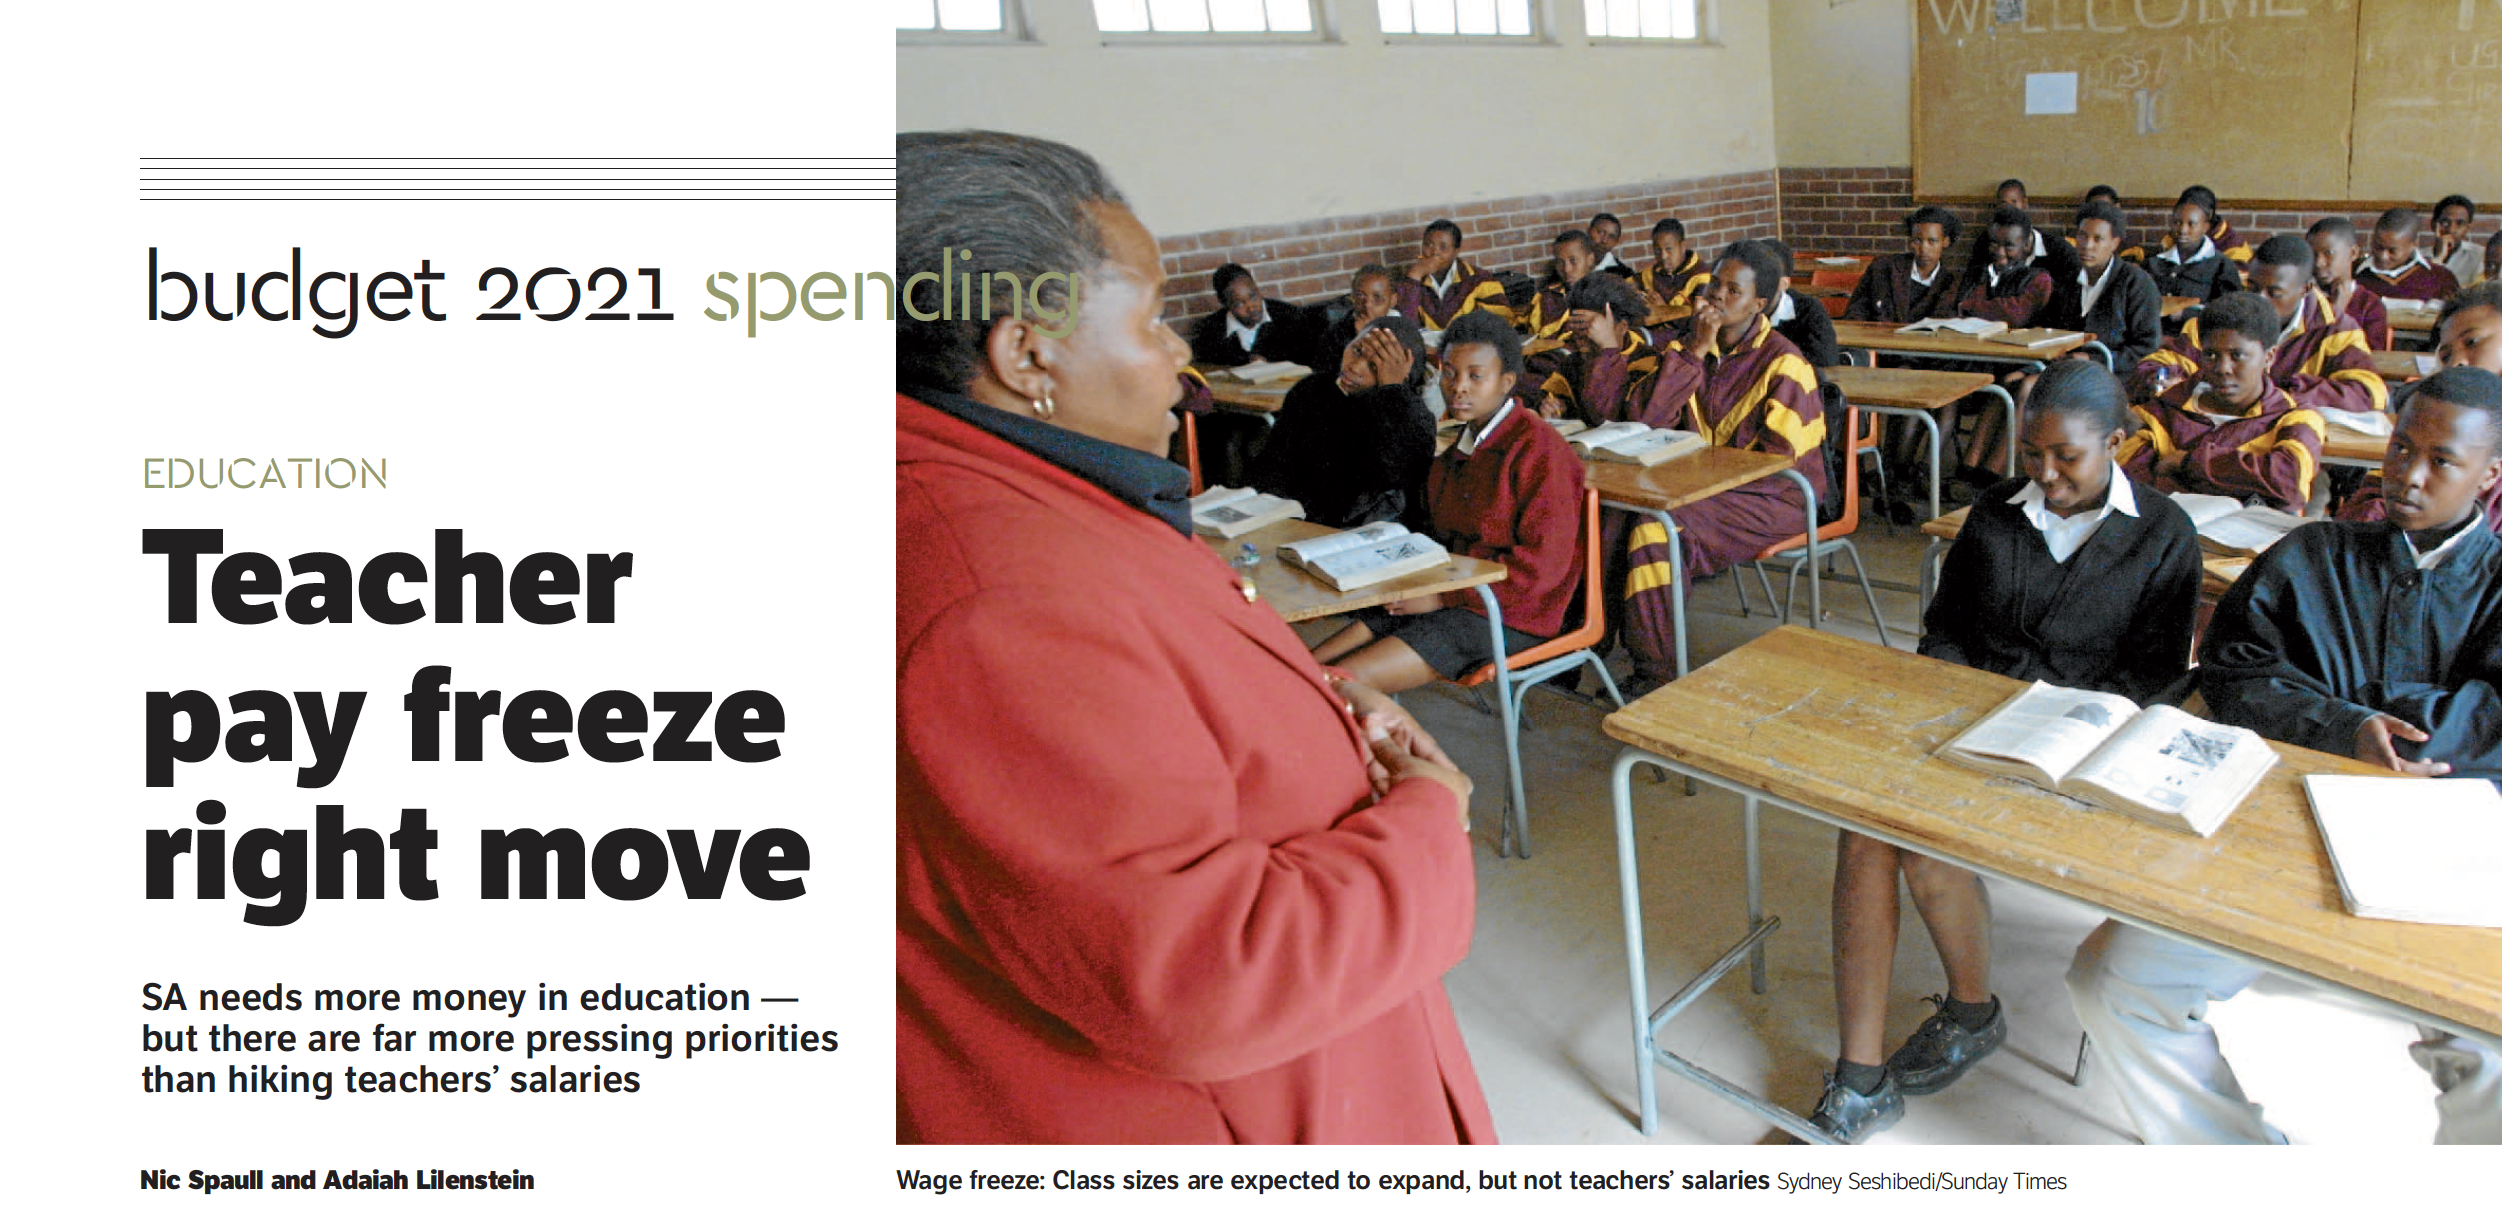
Let us start our foray into this year’s education budget by considering blessings and curses. Given the times that we are in there is one English ‘blessing’ that is especially apt: “May you live in interesting times.” It’s also claimed that this is actually a traditional Chinese curse, and that life is better during “uninteresting times” of peace and prosperity than in “interesting” ones which are usually times of trouble. However you spin it, we are in very interesting times.
In the 2021 budget, public sector wages make up R650-billion or a third of the total budget. Because there are more teachers (407,000) than any other kind of public servant, teacher salaries are the largest single line item in the entire budget and make up a third (R208-billion) of all public sector wages. That’s 4,1% of GDP. For the second year teacher salaries in South Africa will decline in real terms. The 2021 budget showed that salaries in basic education increased by only 1.4% (from R205-billion to R208-billion), and given that inflation was about 3,3% in 2020, that’s a 1.9% decline in real terms. That sounds like a bad thing, but it’s worth putting this in historical perspective – both politically and economically.
Exactly one year ago, the Confederation of South African Trade Unions (COSATU) threatened to “collapse the public service” and “part ways” with government if Treasury did not honor it’s 7% wage increase. Treasury explained that it could not fulfill other constitutional obligations if it honored that wage agreement, and argued for a public sector wage freeze (the one it then implemented). The courts agreed with Treasury, but the judgement is under appeal in the Constitutional Court (see p.32). As much as the 2021 Budget fuss has been about other issues like provisions for vaccines and higher sin taxes, the real story is the ongoing implementation of the public sector wage freeze. Public sector wages are the left, right, and center of government spending, government debt, and government’s ruling alliance with COSATU.
In a research paper we released last year we found that between 2008 and 2019 teacher wages increased by an average of 9,2% per year while average inflation was only 6,3% per year. The only way provinces have coped with higher salaries is to implement hiring freezes leaving schools without principals and heads of departments.
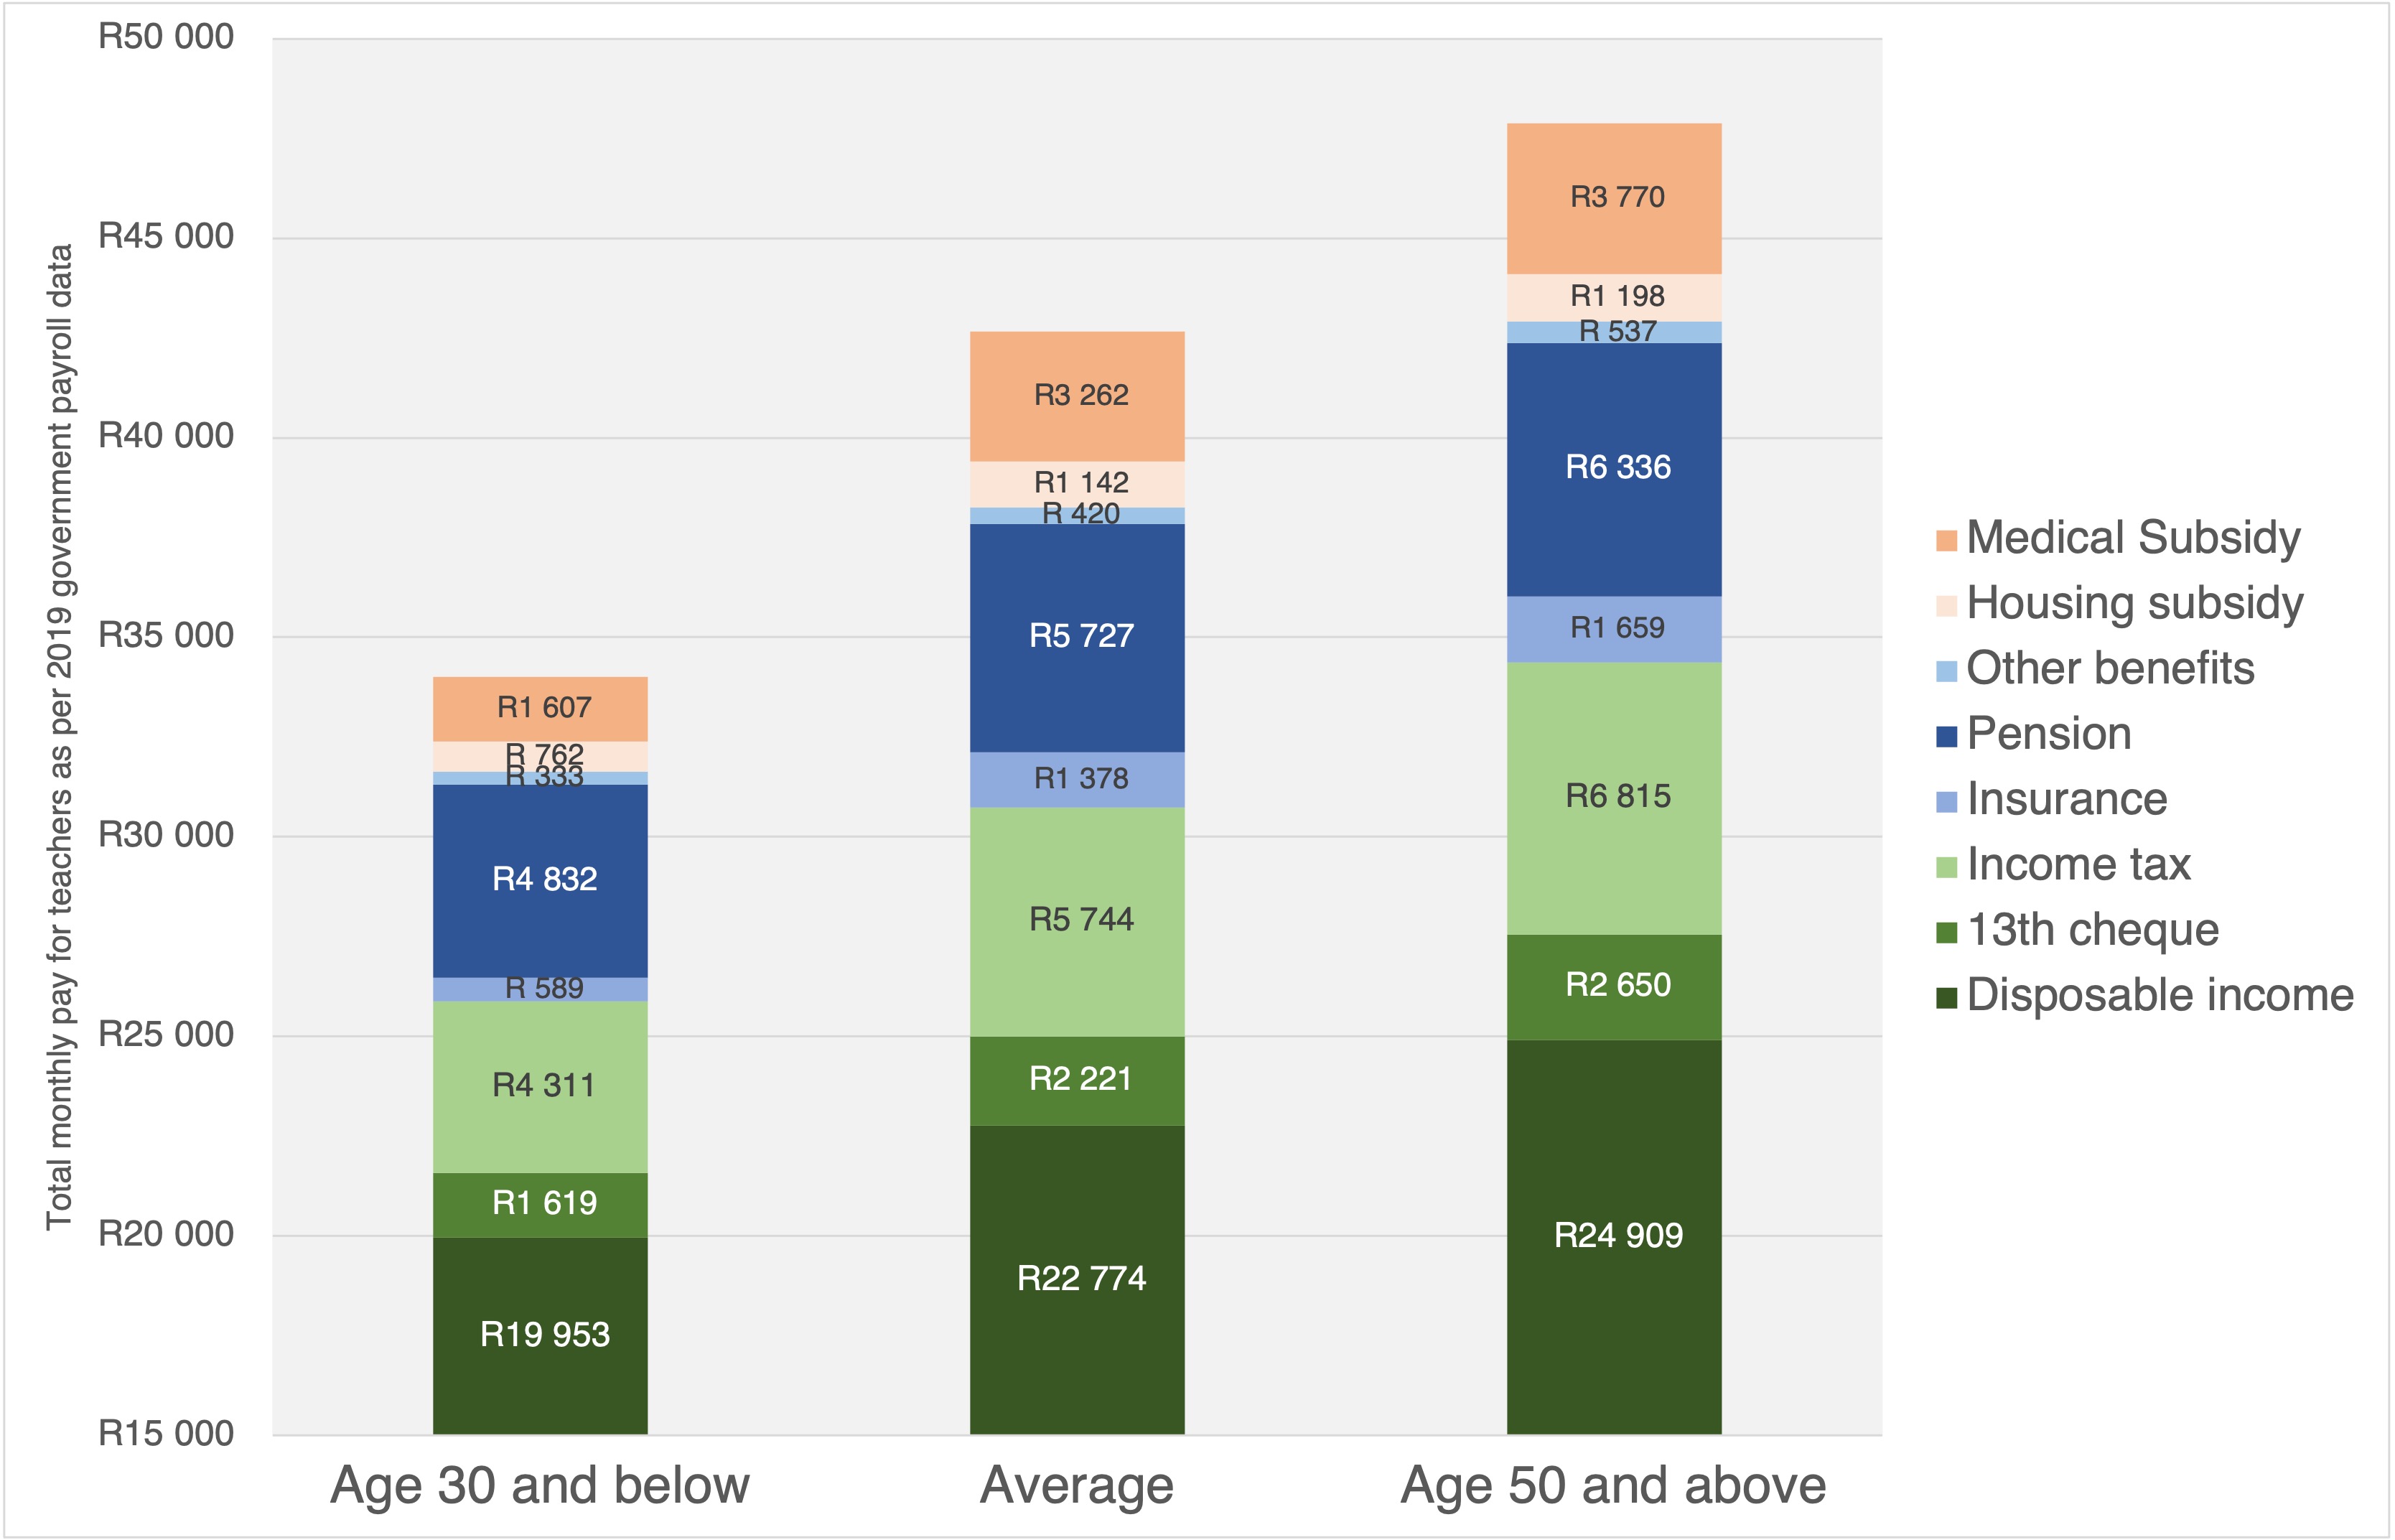
Perhaps this is all a bit abstract for some readers, so let’s talk about monthly salaries. What do teachers actually get paid in South Africa? The common perception is that teacher’s salaries are low. What does the data say? A paper published last year using government payroll data shows that the average teacher in South Africa was paid about R42,700 a month (including benefits), and the total package for teachers 50 years and older was R47,874 per month or about R575,000 a year (see figure). This is not to say that teachers are overpaid, but rather to highlight that teacher salaries have increased dramatically over the last 10 years, and thus the halt in salary increases along with other wages in the public sector is apt.
Figure 1: Monthly teacher pay in South Africa according to 2019 government payroll data
In our view, given the circumstances in South Africa – not only the need to fund vaccines and their rollout, but also to address chronic unemployment and hunger – it is fair and reasonable to implement a wage freeze. The unemployment rate for those aged 15-24 years is now 63% according to the latest StatsSA survey. While we do need more money to go into education, it is not in the form of further salary increases for teachers. Class sizes are set to expand, and pressure on non-personnel spending (like books) is also rising. We need to hire and train unemployed youth-with-matric as Teacher Assistants (R3,600 per month) and make sure all kids have books. These TA’s can be allocated to primary school teachers throughout the country with a special focus on early grade reading and mathematics, thus helping to manage large class sizes and employing 400,000 youth. It’s time to pivot from our old strategy of salary increases for the well-paid and prioritise those who are actually marginalised in society.
—
This article first appeared in the Financial Mail on the 25th of February 2021
What these results show is the reality that a jobs bounce-back for one part of the country can coexist with worsening deprivation in another part. We can have both more jobs and more hunger at the same time.
Today we released the latest results of our nationally representative survey – the National Income Dynamics Study Coronavirus Rapid Mobile Survey (NIDS-CRAM) Wave 3. For once the results are very encouraging.
In 2020 we reported that during the hard lockdown 2.8 million people had lost their jobs between February and April. We now find that by October 2.1 million people had found employment, taking employment much closer to their pre-pandemic levels.
As I’ll explain below, this was not only a case of job-losers regaining their lost jobs. In fact, research by Gabriel Espi, Vimal Ranchhod and Murray Leibbrandt show that only half of “job-losers” regained employment with the remainder made up from those who were previously unemployed. Among those that had no job in February pre-pandemic, a third were now employed by October 2020. This reveals a labour market in flux and also points to the resilience and dynamism of job seekers doing everything they can to find work in a “new normal”.
What is unique about the NIDS-CRAM survey is the high frequency of data collection. From March 2020 we surveyed more than 7,000 people, phoning them every two to three months and asking them a range of questions about whether they were employed (or earned any income from anything) in February, April, June and October.
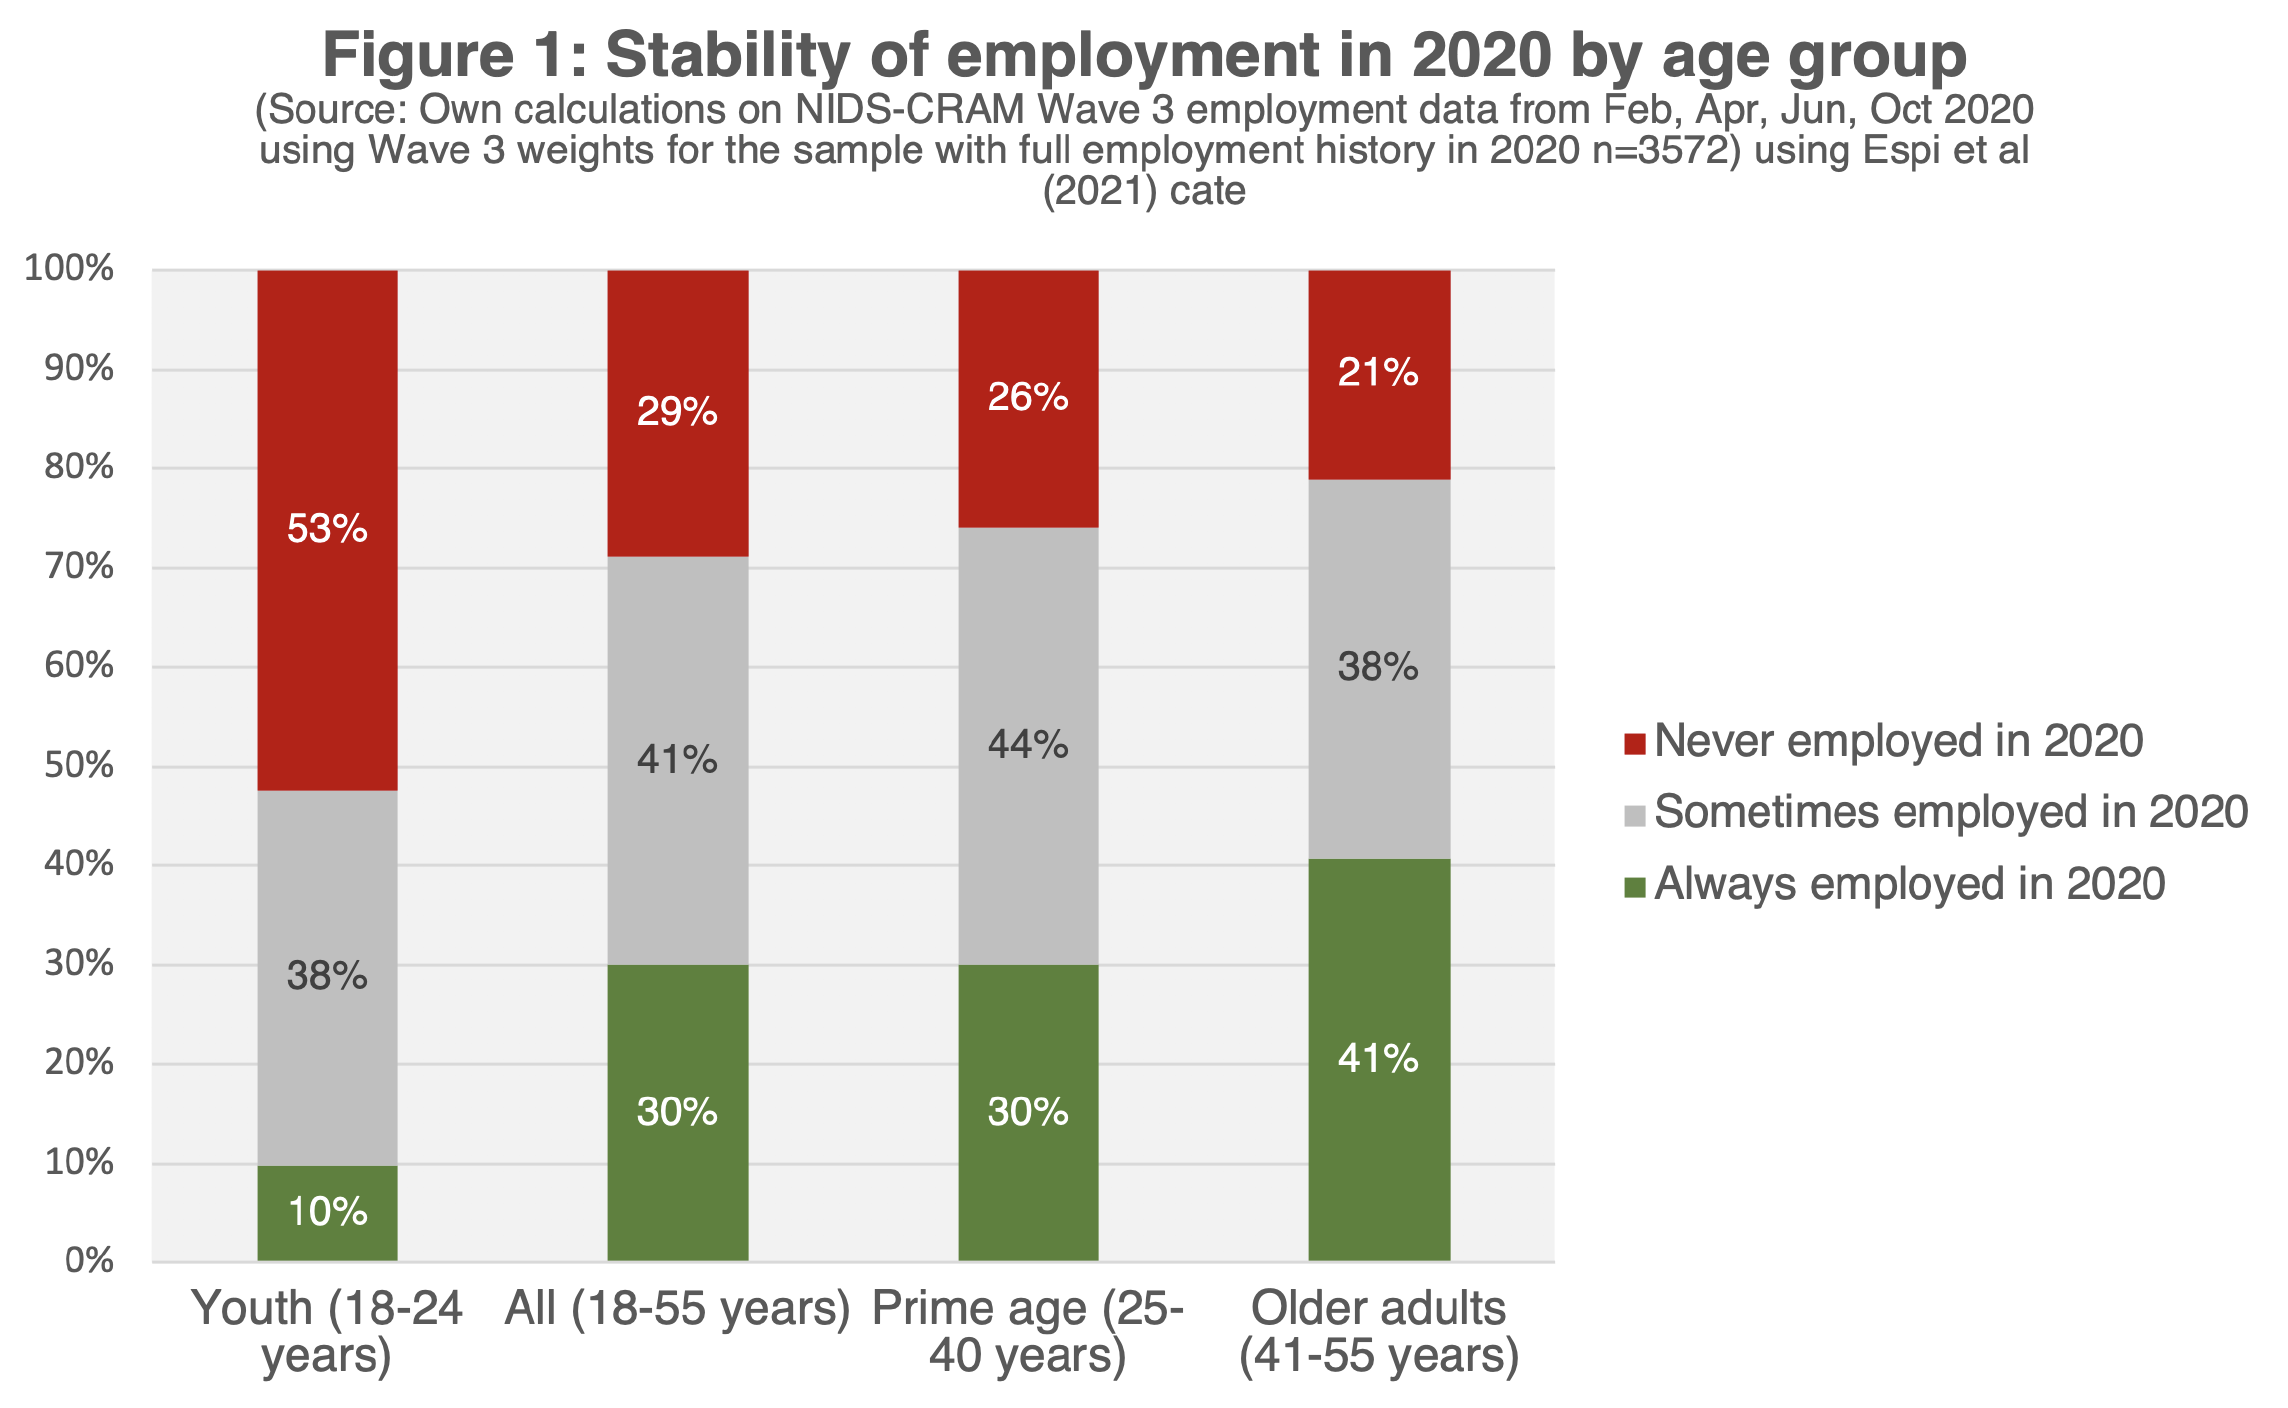
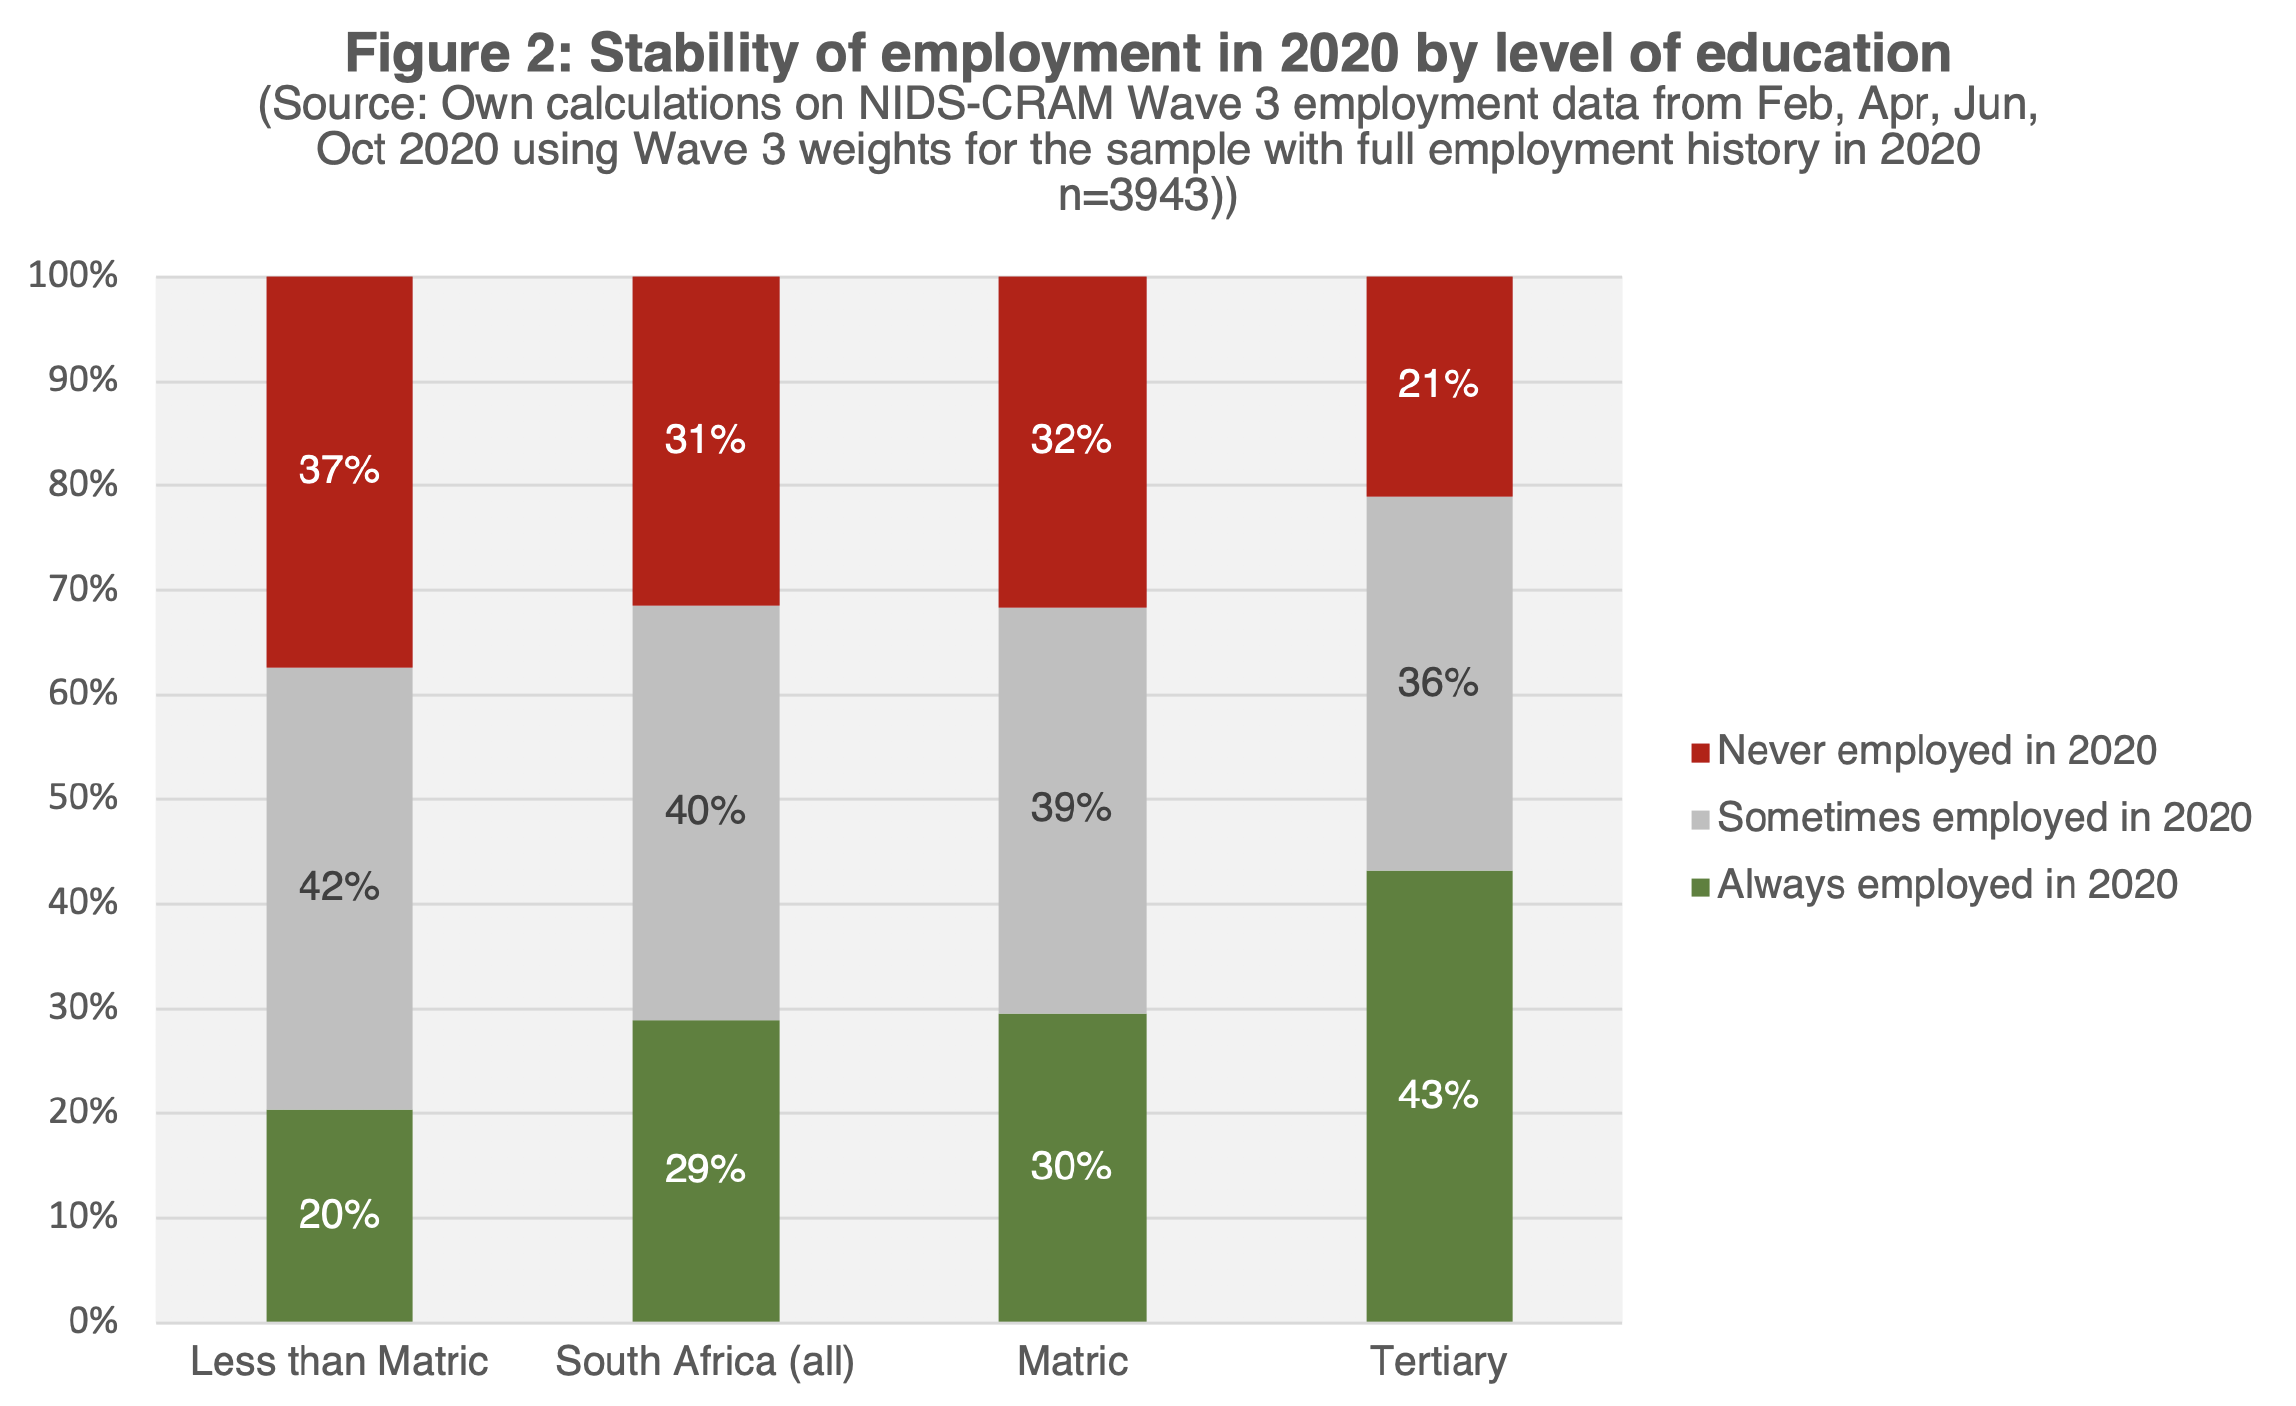
What the Wave 3 data show is that in 2020 being in flux was the norm. Figure 1 below shows the percentages of people in 2020 that were “Never employed”, “Always employed”, and “Sometimes employed” (at least once across the four periods). It shows that across age categories and levels of education about 40% of respondents were neither stably employed nor stably unemployed, but rather that they had a job at least once, but not always. That is a remarkable finding.
Figure 1 and 2 also show that the probability of stable employment depends strongly on age and education, with youth in an especially precarious position. Only 10% of youth (18-24 years) were always employed in 2020 and at least half (53%) were never employed in 2020. Those with tertiary education were also far more protected against job loss or precarious employment.
In their paper, Gabriel Espi and his co-authors also found that 2020 employment outcomes are strongly influenced by employment history over the past seven years. The stably employed historically tend to retain their jobs while the persistently unemployed remain unemployed. The transient employed tend to repeat their pattern of finding and losing jobs.
Our survey also asks respondents about their wellbeing and the wellbeing of those in their household.
Of most concern is that we see rates of hunger, and especially child hunger, rising over time. Mental health is also deteriorating. The percentage of respondents experiencing hunger in the past week because they didn’t have enough money to buy food increased from 16% in July to 18% in November 2020. The increase was even larger for child hunger rising from 12% in July to 16% in November 2020, with the sharpest increase for households with black African children (from 13% to 19% weekly hunger).
This should be of major concern.
Similarly, the percentage of the population screening positive for depressive symptoms has now increased from 24% to 29% of the population, with the sharpest increases seen for those experiencing perpetual hunger, ie those reporting hunger “every day”.
What these results show is the reality that a jobs bounce-back for one part of the country can co-exist with worsening deprivation in another part. We can have both more jobs and more hunger at the same time.
This is the reason the grant system and talk of a Basic Income Grant are so important. Even before the pandemic, South Africa had 10 million people who wanted work, but couldn’t find it. There is no conceivable world where all of these people get jobs. For some perspective, it took us a decade to create 2.4 million jobs (2009-2019). What we are seeing is that more economic growth and more social grants are the left-right combo South Africa needs to move forward. One without the other won’t work.
More than 2-million South Africans found work between June and October 2020, according to the latest round of data from the Nids-Cram survey. But hunger — and child hunger in particular — persists
On Tuesday November 3 2020 answers began rolling in for SA’s third wave of the nationally representative National Income Dynamics Study Coronavirus Rapid Mobile Survey (Nids-Cram). The survey co-incided with major global shifts, with Americans voting in a new (sane) president, and the announcement of successful Covid-19 vaccines passing clinical trials. The wave 3 Nids-Cram results offer their own story of a turning point.
The data from our Nids-Cram survey reveals a remarkable bounce-back in employment between June and October. Last year we reported that 2.8-million people had lost their jobs between February and April, and while many furloughed workers had returned to work by June, those who had lost their jobs had not (see graph below).
We now see that with the rapid easing of the lockdown between June and October there was a strong recovery in employment, with about 2.1-million people gaining employment in a rapidly changing labour market.
These are not necessarily the same people who lost their jobs during the lockdown: only half of them have regained employment. But a third of those who were unemployed before the pandemic have now found work.
All this suggests a big bounce-back in jobs, taking us much closer to pre-pandemic levels of employment. This is really good news. But it also reflects some seismic shifts in the labour market.
This shift comes as a big relief, and we conducted a number of checks to be sure the changes are real. Eight economists at the University of Cape Town, Stellenbosch University and Wits University, writing three papers looking specifically at employment, found the bounce-back to be robust even when factoring in different definitions of employment (hours worked rather than a count of the employed) and the sample used.
Earnings data also shows that people are earning at least the same as they were last February, and some wages may even have been higher in October.
Corroborating evidence also comes from Stats SA’s monthly sales data — the data used for GDP calculations. Nids-Cram researcher Ihsaan Bassier and his co-authors report that this data suggests that “important sectors of the SA economy — mining, manufacturing, wholesale and retail — were making October 2020 sales at or above their February 2020 levels … This suggests that certain sectors had substantially recovered by October, and is consistent with the employment recovery we see in wave 3 of Nids-Cram.”
The imminent release of Stats SA’s Quarterly Labour Force Survey for the fourth quarter of 2020 will help verify the extent of these changes, yet the results are very promising nonetheless. And for 2-million South Africans, at least, that matters a lot.
Worst child hunger in 10 years
The employment findings were not the only surprise to emerge from the Nids-Cram survey. When employment increases, our expectation is that hunger will fall and mental health will improve. However, that is not what we found.
Research by Servaas van der Berg, Leila Patel and Grace Bridgman reveals that between July and November the proportion of households experiencing hunger in the previous week due to insufficient food increased from 16% to 18%.
The most startling finding is that child hunger also worsened, and is now at its highest level in 10 years.
In our previous survey we found that one in eight (12%) households with children had children experiencing weekly hunger. Our new results show this has increased to one in six (16%), with the sharpest increase being for households with black African children (from 13% to 19% weekly child hunger).
This should be of major concern. Before the pandemic more than one in four (27%) of SA’s children were stunted, meaning their malnourishment was so severe that they had low “height-for-age”.
Hunger also affects mental health and depression. Among those who had experienced hunger in the previous week, 40% screened positive for depressive symptoms, compared with 27% for those who had enough to eat.
In fact, another troubling finding from our results is that mental health seems to be deteriorating across the board. Work by Adeola Oyenubi and Uma Kollamparambil shows that, between July and November, the percentage of people screening positive for depressive symptoms rose from 24% to 29% of the population. They also find rapidly deteriorating mental health for those experiencing perpetual hunger. For those who reported they went hungry “every day”, 67% screened positive for depressive symptoms.
So, what are we to make of this? Why has hunger — and especially child hunger — become worse when more than 2-million jobs have returned? The short answer is that we don’t yet know. There are no smoking guns — only plausible explanations.
For one, child hunger may be related to disrupted free school meals. In pre-Covid times, 65% of households reported that a child had received a free school meal. In November, only 48% of respondents said their child had received a meal at school that week, despite all schools being “open”. But even that 48% figure is likely to be an overestimate, due to “rotational timetables”, which mean schools are operating at 50% capacity, with only half the classes attending on any given day. (Typically, children do not get meals on days they don’t attend school, something the basic education department has admitted in court documents.)
What about grants?
Another key piece of the puzzle is the social grants system and the removal of grant top-ups in November. Up until then, the R440 a month child support grant (CSG) was topped up by R500 per caregiver, and the old age pension of R1,860 a month was topped up by an additional R250.
These top-ups were last paid at the beginning of October.
The rollout of the CSG over the past decade is universally accredited with alleviating child hunger and helping to reduce poverty, which is why many believe the removal of the CSG top-up is one of the reasons for the rise in child hunger. While there is currently limited evidence for this, it remains a very plausible explanation.
What many South Africans don’t realise is that SA leads the world when it comes to the reach of its social grant system — and did so even before the Covid-19 pandemic. In their Nids-Cram paper, Bassier, Josh Budlender and Rocco Zizzamia show that in October more than 70% of adults in SA lived in households receiving a government grant.
We know from both Nids-Cram and other household surveys that about half (56%) of South Africans live in households that receive at least one CSG a month.
It’s worth comparing SA’s CSG scheme with two popular Latin American counterparts: Brazil’s Bolsa Familia programme (R500/child/month) and Mexico’s Progresa/Oportunidades programme (R800/child/month). In both cases the grant reaches only about 20% of the population, and both are conditional on behaviour (sending children to school, getting them vaccinated and so on).
In addition to the existing grant infrastructure in SA, the government added the R350 a month social relief of distress grant (SRDG) during the pandemic. The grant reaches about 40% of households and has brought 10% of previously excluded households into the social protection system.
In his 2021 state of the nation address, President Cyril Ramaphosa announced that the SRDG would be extended for another three months, until the end of May 2021 — the second time it has been extended.
As I’ve noted before, the longer that door remains open, the harder it will be to shut. In my view, the R350 a month grant is here to stay. I suspect it will be rebranded — potentially as an “unemployment support grant” or “basic income grant” — and will join the others as a permanent feature of the social protection system. And so it should.
The widespread coverage of our grant system should be a point of national pride. The system is also progressively targeted. In October, about 90% of the poorest half of the population lived in a household that received a grant, compared with less than 40% for the wealthiest quarter.
The way forward
What is clear from the above is that the labour market alone will not solve SA’s problems. Even as SA moves towards pre-pandemic levels of employment, hunger persists and may deteriorate even further. And future lockdowns may mean that we lose many of the jobs we have only just regained. We don’t yet know.
For a moment, however, let’s assume we are en route to our pre-pandemic levels of employment. In the last quarter of 2019, Stats SA reports that about 16-million people were employed, but at least 10-million South Africans who wanted to work couldn’t find jobs. What happens to them, and to their dependants?
Some would argue that they simply need more and better education and training — the idea that if you “teach a man to fish, you feed him for a lifetime”. Yet the evidence seems to suggest this is magical thinking. About a third of the unemployed, for example, have already passed matric.
In Give a Man a Fish, professor James Ferguson argues persuasively that we need to think differently about government grants and the reasons people are entitled to them: “Teaching a man to fish in these times, then, may be just a good way of creating an unemployed fisherman, or, at best, a marginal hanger-on in an already oversaturated competitive field. It is not obvious that being trained for a nonexistent job would benefit the man in any way, and it is certainly nonsense to suppose that he would, by virtue of that training, be fed for a lifetime … The ‘teach a man to fish’ slogan seems to come from a world where the labour of poor people was needed by the apparatuses of production and where the central problem was creating enough trained and willing workers to meet labour needs. That is not the world we live in today.”
This is not to say that employment and education are not critical, and part of the solution — they are. Or that we should divert attention away from public employment schemes and meaningful educational reform — we shouldn’t. The argument is simply that neither will create 10-million more jobs.
In that context, if we want people to have a modicum of basic dignity, we need to keep giving grants — not out of charity, but out of a recognition that everyone has a basic right to dignity and life.
As Russian thinker Peter Kropotkin argued more than 100 years ago: “We must recognise, and loudly proclaim, that everyone, whatever his grade in the old society, whether strong or weak, capable or incapable, has, before everything, the right to live, and that society is bound to share among all, without exception, the means of existence it has at its disposal.”
A little closer to home, the Freedom Charter goes a step further: “The people shall share in the country’s wealth.” In other words, purely by virtue of their personhood, all people deserve some minimum level of income to stave off the worst forms of deprivation. The demand for a basic income grant starts from the self-evident truth that all people deserve basic dignity and respect.
So where does the money come from? The solution lies in three parts, all of which speak to economic growth either directly or indirectly:
The government must get serious about corruption and prosecute corrupt officials irrespective of their political standing;
It must get serious about recruiting competent people into the public service and firing incompetent employees; and
It must reprioritise expenditure in favour of social services and away from vanity projects such as SAA. If these fail, then the only alternative is to raise taxes — an increasingly precarious option.
Dealing with corruption and an incapable state are the two most promising (and immediate) routes to increased economic growth, which is arguably the binding constraint to almost everything else. On state capacity, the problem is most easily seen right at the top.
Ramaphosa is the master of announcements and beginnings. To every problem there is a new solution; the graveyard of old solutions and half-implemented projects is vast and growing. Why is it that we are perpetually told about new government initiatives rather than the progress of old ones? The reason is simple: the state lacks the capacity to implement its own plans.
For too long, politics has trumped competence in the recruitment of bureaucrats — a failing related to cadre deployment rather than affirmative action.
There are thousands of highly competent black professionals working in the private sector who would be willing to work in the public service if it were open to bold reforms and competence-based recruitment. Yet the state is unable to implement the necessary changes to make the public sector a viable and attractive option for them. That would be too threatening to existing cadres, and so it never happens.
This is costly at any time, but is doubly so during a pandemic. As economist Mariana Mazzucato has argued in Mission Economy: A Moonshot Guide to Changing Capitalism: “In crises, government intervention is only effective if the state has the corresponding capability to act … Without this, they cannot even devise robust terms of reference for the companies they bring in.”
The reason the government needs to get serious about corruption and state capacity is that if it doesn’t, then neither the economy nor the tax base will grow. But there is another reason — government debt is no longer an option.
This time last year, the National Treasury made it abundantly clear that we were in the midst of a debt crisis and that within two years “interest payments will exceed health spending”. Nearly a seventh of all government expenditure (15%) went to paying off the interest on our national debt — and that was before the pandemic and before the stimulus spending.
In light of this one has to ask: why does the government own an airline? We are repeatedly told that SAA must be bailed out. Where does this R10bn come from? Cuts to provincial allocations that fund hospitals, HIV care, school infrastructure, textbooks and policing. These bailouts of state-owned enterprises are immoral, irrational and indefensible.
One other way to raise the funds we need is to phase out our current system of generous corporate welfare — something the Treasury is already strongly considering. For example, hidden on page 122 of Annexure B of the 2020 Budget Review we learn that “one dominant taxpayer claimed almost R10bn in each of the 2017 and 2018 tax years, raising concerns about the equity of the corporate tax system”.
That’s a pretty big rebate.
In the absence of restructuring expenditure and decreasing corporate welfare, one option is to raise taxes or introduce new ones, like a wealth tax. But here, too, we are stuck between a rock and a hard place. As it stands, 95% of personal income and company income tax is raised from the richest 5% of the population.
It’s too early to know what the 2020 tax year will look like, or how much haemorrhaging there has been, but even the 2019/2020 data — released two months ago by the SA Revenue Service (Sars) — is instructive. It shows that of the R360bn raised in personal income tax in 2019, 98% (R351bn) came from the richest 2.7-million people. To be in that group, you needed to earn at least R200,000 a year.
This is not something peculiar to 2019. Similar figures for Sars’s reliance on the richest 3-million people are found in 2018 (97%), 2017 (96%) and 2016 (95%).
Given that there were about 60-million people in SA in 2019, we can say that more than 95% of personal income is raised from the richest 5% of the population.
And what about companies? For the past four years, 95% of company income tax (CIT) has come from the biggest 5% of companies. To be specific, Sars usually collects about R200bn in CIT a year, and though there are more than 800,000 companies in SA submitting returns, the biggest 37,000 (5%) account for 95% of CIT paid.
Thanks to Sars’s diligent breakdown, we can also see that over the past four years the biggest 400 companies accounted for half (55%) of all CIT.
What it means?
People who own large, profitable, tax-paying companies are earning more than R200,000 a year, so it’s safe to conclude that the people owning companies that pay company tax are the same people who are paying personal income tax (with the exception of foreign-owned companies paying taxes here). In that case, of the R1.35-trillion that the government raised in taxes in 2019, half (55%) came from the richest 5% of South Africans. The four sources of state revenue are personal income tax (39%), CIT (16%), VAT (25%) and “other” taxes, such as the fuel levy and customs duties (20%).
So what has this got to do with raising taxes? It means that the lion’s share of government revenue is precariously dependent on the richest 3-million South Africans. While much talk in SA focuses on emigration and tax avoidance, we shouldn’t forget that willingness to pay taxes is also a function of perceived legitimacy and what the taxes are used for.
If a defensible basic income grant were announced to stave off the worst forms of deprivation, taxes would need to go up to pay for it. Last year, former Goldman Sachs CEO Colin Coleman presented a well-thought-out plan to fund such a grant of R500 a month. Yet if the government moves in this direction without first getting tough on corruption, we will start seeing money going underground or overseas. More people will feel morally justified in hiding their income and wealth.
The latest Nids-Cram results are both encouraging and sobering — encouraging because they paint a picture of a resilient labour market and dynamic job-seekers; and sobering because they show that hunger can persist even as employment increases.
While this is the first solid evidence of SA turning the economic corner in the pandemic, it is also clear that the government needs to reintroduce top-ups to the CSG to stave off hunger and deprivation, especially for children. To fund this, and a basic income grant, it will need to tackle corruption, give up on vanity projects such as SAA, and reprioritise spending towards the poor.
The pandemic has given us an opportunity to reflect on the society we have created and to envision a different one, where all people have basic dignity and respect, and where we are led by competent, ethical public servants.
//
This article was first published by the Financial Mail on the 17th of Feb 2021 and is available here.