19 January 2019.
My background note for the meeting with the Minister of Finance Tito Mboweni at the Treasury Economic Colloquium (19 January 2019; South African Reserve Bank), PDF Note HERE.
Overview:
The education problem as it stands in January 2019:
- Learning outcomes: After initial improvements in learning outcomes – notably between 2003-2011 (TIMSS & PIRLS), now stalling progress in learning outcomes.
- Expenditure: Because of above-inflation wage increases for teachers, combined with a 13% increase in births 2003-2005 there has been an 8% decline in real per-pupil education expenditure since 2010.
- Politics: There is currently an unacceptably high level of undue political influence by the majority teacher union (SADTU) on the governance of basic education.
- Teachers: The majority of teachers (80%) lack the content knowledge and pedagogical skill to teach the subjects they are currently teaching. For example 79% of Grade 6 mathematics teachers cannot get 60% on a Grade 6/7 level maths test.
- Throughput: There is currently very low throughput rates to university: Of 100 learners that start school, approximately 50-60 will make it to matric, 40-50 will pass matric, and 14 will qualify to go to university. Only 6 will get an undergraduate degree within 6 years.
- Reading: Nationally representative surveys (PIRLS 2016) show that 78% of Grade 4 learners cannot read for meaning in any language (all 11 languages were assessed).
- Mathematics: Nationally representative surveys (TIMSS-N 2015) show that 61% of Grade 5 learners could not add and subtract whole numbers, have no understanding of multiplication by one-digit numbers and cannot solve simple word problems, i.e. they cannot do basic mathematics.
- Wastelands: Approximately half of South African primary schools (45%) could be described as “cognitive wastelands”, that is that not a single learner can read and make inferences. Similarly, in 47% of high-schools not a single child coule reach the intermediate international benchmark in mathematics. By contrast, the figure in Botswana is 2%.
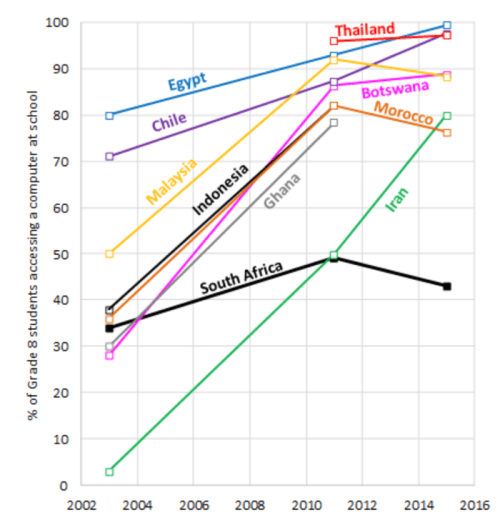
- Technology: Access to technology in South African classrooms is low by international standards. The solution is functional computer laboratories not one-device-per-child.
Education priorities for reform:
- Expenditure: Stop the decline in real per-learner education expenditure.
- Radical prioritization and focusing on the Foundation Phase (Grade R-3)
- Fiscally prioritize Primary Schools.
- National Primary School Assessment.
- A Ramaphosa Reading Plan
- Provide graded reader anthologies to every child in Grades R-3
- Recruit, train and employ a small army of Foundation Phase reading coaches.
- Provide a minimum box of educational resources to all classrooms starting with Gr1-3.
- Eliminate extreme class sizes.
- Eliminate grossly inadequate physical infrastructure.
- Technology in education
- Depoliticize the bureaucracy: Separate bureaucratic and teachers’ unions.
Introduction
South Africa today is the most unequal country in the world. The richest 10% of South Africans lay claim to 65% of national income and 90% of national wealth; the largest 90-10 gap in the world (Alvaredo et al, 2018, p. 150; Orthofer, 2016). Given the strong and deeply historical links between education and the labour market these inequities are mirrored in the education system. Two decades after apartheid it is still the case that the life chances of the average South African child are determined not by their ability or the result of hard-work and determination, but instead by the colour of their skin, the province of their birth, and the wealth of their parents. These realities are so deterministic that before a child’s seventh birthday one can predict with some precision whether they will inherit a life of chronic poverty and sustained unemployment or a dignified life and meaningful work. The sheer magnitude of these inequities is incredible. The top 200 high schools in the country have more students achieving distinctions in Mathematics or Physical Science (80%+) than the remaining 6,476 high schools combined [1]. Put differently, 3% of South African high schools create more Mathematics or Physical Science distinctions than the remaining 97% put together. Of those 200 schools, 185 are former White-only schools and all 185 charge significant fees. Although they are now deracialized, 57% of the matrics in these top 200 schools were White. This is less surprising when one considers that in 2014/15, White South Africans still make up two-thirds of the ‘elite’ in South Africa (the wealthiest 4% of society) (Schotte et al, 2018, p. 98).
In a few years’ time when we look back on three decades of democracy in South Africa, it is this conundrum – the stubbornness of inequality and its patterns of persistence – that will stand out amongst the rest as the most demanding of explanation, justification and analysis. This is because inequality needs to be justified; you need to tell a story about why this level of inequality is acceptable or unacceptable. As South Africans what is the story that we tell ourselves about inequality and how far we have come since 1994? Have we accepted our current trajectory as the only path out of stubbornly high and problematically patterned inequality? Are there different and preferential equilibria we have not yet thought of or explored, and if so what are they? In practical terms, how does one get onto a higher economic growth path that is both sustainable and inclusive? Does anyone really know how to ‘create’ jobs apart from higher growth and a more skilled workforce? The latter of which is not possible without improving the education system, so how does one get to a more equitable and improved distribution of teachers, resources or learning outcomes? And what are the political, social and financial price-tags attached to doing so? These are the questions that should stand front and centre in our national discourse and with which the next elected government must grapple.
The education problem as it stands in January 2019
- (1) After initial improvements, now stalling progress in learning outcomes: There is now a growing body of reliable and consistent findings documenting gains in learning outcomes, particularly between 2002 and 2011 (see Van der Berg & Gustafsson, 2019 forthcoming for a full discussion). As more corroborating evidence emerges, the position that learning outcomes have not improved in South Africa – or that “education is worse than it was under apartheid” (Ramphele, 2016) – is increasingly becoming a fringe view that is not supported by the data or serious scholars. Because South Africa participates in a number of international assessments that are comparable over time and across countries we can compare our performance in maths, reading and science over time fairly accurately. Broadly speaking one can see three periods which could loosely be referred to as (1) a ‘stagnating’ phase (1995-2003) where learning outcomes did not improve at all (neither in maths between TIMSS 1995, 1999 and 2003, nor in reading between SACMEQ 2000 and 2007), (2) the ‘improving’ phase (2003-2011) where learning outcomes improved relatively quickly, supported by maths data from TIMSS 2003-2011, SACMEQ 2007-2013 and reading data from PIRLS 2006-2011, and (3) the ‘stalling’ phase (2011-2016) where gains have flattened out as evidenced by the lower gains in mathematics in TIMSS 2011-2015 and particularly the lack of any improvement in reading between PIRLS 2011-2016.

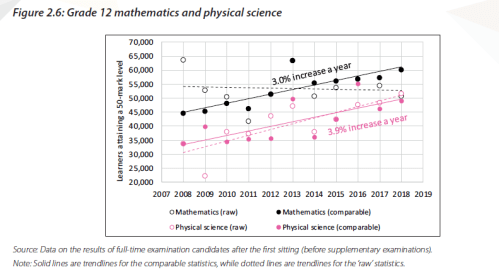
While the international assessments are the most reliable indicators of progress in education, there are also other pieces of supporting evidence, including the fourfold increase in black university graduates between 1994 (11,339 black graduates) and 2014 (48,686 black graduates) (Van Broekhuizen, 2016: p.12), and the large increase in the number of matriculants receiving mathematics marks which make them eligible for engineering at university, increasing from 18,601 to 25,054 between 2002 and 2016 (Van der Berg & Gustafsson, 2019).
- (2) An 8% decline in real per-pupil education expenditure since 2010: One of the underappreciated trends of the last seven years is the declining per-learner public expenditure on basic education in real terms. To be specific, between 2010 and 2017 there has been an 8% decline in per learner expenditure in purchasing power terms[2]. The reason this fact has gone largely unnoticed in South Africa is that they are hidden in aggregate figures and discounted using the wrong inflation rate. The total expenditure on basic education has increased by 7,1% per year between 2010 and 2017 to keep up with Consumer Price Index (CPI) inflation over the period. But CPI is the wrong index to deflate education expenditures since more than 80% of expenditures are on teacher salaries rather than a typical basket of goods. The salient question when calculating real expenditures on education is thus, “What resources are required in 2017 to buy the same level of inputs used in 2010?” While inflation meant that the average basket of goods in 2017 was 38% more expensive than it was in 2010, teacher salaries over the same period increased by 57% due to above-average-inflation wage agreements in the Education Labour Relations Council (ELRC). The second, and more important factor, is that the total number of learners across which the budget must be spread has been increasing significantly. Between 2003 and 2005 there was a large increase in births[3] of around 13% which led to a 13% rise in Grade 1 enrolments from 2009 to 2015 which has been largely unnoticed by government officials (Gustafsson, 2018). Although births per year did come down somewhat in around 2008, the current levels are still higher than the pre-2003 levels. Seen together, these two factors explain why there has been an 8% decline in per learner expenditure on basic education between 2010 and 2017. The decline in state funding over the last seven years is already starting to show up in international assessments. According to PIRLS the average class size in Grade 4 was 40 in 2011 which has now increased to 45 learners per class in 2016 (Howie et al., 2017: 13, 127). Among the poorest 60% of learners, class sizes experienced by the average learner increased from 41 to 48 learners per class between 2011 and 2016 (own calculations). For the richest 10% of learners, class sizes increased from 33 to 35 learners per class over the same period. This decline in funding is one of the leading explanations for the ‘stalling’ of educational improvement since 2011 described above.
Figure 2: Current provincial per learner expenditure on basic education 2010 to 2019 (Own calculations using real cost drivers and expressed in 2017 Rands, 2017-2019 projections based on MTEF)

- (3) Undue political influence by the majority teacher union (SADTU): The most recent and authoritative account of the accountability problems faced in the sector comes in the form of a 2016 report by the Ministerial Task Team headed by Professor John Volmink formed to investigate fraud and corruption in the sector, and specifically the sale of teacher and principal posts for cash and livestock (Department of Education, 2016). They found that the dominant teacher union – the South African Democratic Teachers Union (SADTU) was in “de facto control” (p.119) of the education departments in six of the nine provinces in the country. The investigators report that “all the Deputy Directors-General in the Department of Basic Education are SADTU members and attend meetings of that Union” and conclude that, “it is not improbable to say that schooling throughout South Africa is run by SADTU” (Department of Education, 2016; p.93). The Minister of Basic Education Ms Angie Motshekga has largely ignored the recommendations of the Task Team and instead asked the provincial departments to report on what they are doing to address the issues contained in it. The lack of action on this is widely believed to be due to union opposition to the report.
- (4) A lack of teacher capacity: No education system can move beyond the quality of its teachers. There is now a large body of evidence in South Africa attesting to the fact that the majority of South African teachers do not have currently have the content knowledge or pedagogical skills necessary to impart the curriculum. In a nationally representative sample of primary schools, it was found that 79% of Grade 6 Mathematics teachers could not score 60% or higher on Grade 6 or 7 level questions (Venkat & Spaull, 2015).
Figure 3: Proportion of South African grade 6 mathematics teachers by content knowledge (CK) group – SACMEQ 2007 (with 95% confidence interval) (Venkat & Spaull, 2015: p.127).

- (5) Low throughput to university: Of 100 children that start school, approximately 60 will reach and write matric, 37 will pass and 12 will access university. Only 4 will complete an undergraduate degree within 6 years. Low through-put rates and weak performance in high school is rooted in weak foundations from primary school (Spaull & Kotze, 2015, Van der Berg et al., 2016).
Figure 4: The qualifications pyramid in South Africa (Van Broekhuizen et al., 2016)

- (6) 78% of primary school children do not learn to read in Grade 1-3: Learning to read for meaning is the most critical skill children learn in primary school. It is the skill upon which all other skills depend. The South African curriculum stipulates that children should “learn to read” in Grades 1-3 and then “read to learn” in Grade 4 onwards. Thus they should be able to read for meaning by the end of Grade 3 in their home-language and in English. The recent Progress in International Reading Literacy (PIRLS 2016) study showed that 78% of South African Grade 4 children could not read for meaning in any language, that is they could not “locate and retrieve an explicitly stated detail.” Comparable figures in other countries are 64% (Morocco), 35% (Iran), 13% (Chile), and 3% (United Kingdom) (Mullis et al., 2017a).
- (7) 61% of primary school children do not learn basic mathematics by Grade 5: Learning to use the four operations effectively and with confidence is one of the most essential mathematical skills children learn in primary school. According to the Trends in International Mathematics and Science Study (TIMSS 2015), 61% of South African Grade 5 learners could not do basic mathematics, that is they could not add and subtract whole numbers, have no understanding of multiplication by one-digit numbers and cannot solve simple word problems (Mullis et al., 2017b).
- (8) Half of SA primary schools are “cognitive wastelands”: One method of determining the educational possibilities in a school is to look at the highest achieving learner in a class (the maxima distribution). This can be thought of as the ‘ceiling’ that is possible in that school. In 45% of South African Grade 4 classrooms there was not a single student that could read in their home language and make inferences (the PIRLS Intermediate International Benchmark). These schools likely require quite radical interventions to improve results. To quote Van der Berg & Gustafsson (2019, p:19 forthcoming) who apply the same method and look at TIMSS Grade 9:
“In 47% of [South African high] schools there was not a single learner who reached 475 points, the TIMSS Intermediate International Benchmark. In this respect South Africa did much worse than any other country… [The comparable figure in Botswana is just 2%]. The comparison with Botswana is particularly important, because Botswana is within the same region but also because both Botswana and South Africa tested Grade 9. In the context of South Africa’s skills shortfall and the need for more black professionals, it is particularly problematic that a large segment of the schooling system are in effect ‘academic wastelands’ which do not produce even a single learner performing at the intermediate international benchmark.
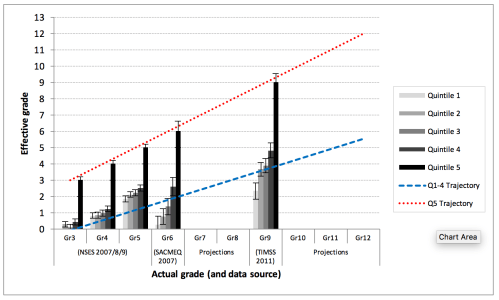
Figure 5 below illustrates this point by showing the “effective” grade that children are in at each stage of the schooling process. If we look at the no-fee schools (poorest 80% of schools), learners are approximately 2,5 years behind the curriculum in Grade 3. By Grade 9 they are 4-5 years behind the curriculum, showing the compounding effect of not getting primary school learning right.
Figure 5: South African mathematics learning trajectories by national socioeconomic quintiles using a variable standard deviation for a year of learning (0.28 in grade 3 to 0.2 in grade 8 with interpolated values for in-between grades (Based on NSES 2007/8/9 for grades 3/4/5, SACMEQ 2007 for grade 6 and TIMSS 2011 for grade 9, including 95% confidence interval (See Spaull & Kotze, 2015: p.21)
Education priorities for reform:
- (1) Stop the decline in real per-learner education expenditure: It is difficult to think of any scenario where the South African education system becomes significantly more equitable with fewer resources than it has now. If anything, a decline in public funding is likely to exacerbate inequalities since it would increase the resource gap between fee-charging and no-fee schools. Although initially caused by a spike in births and above-inflation teacher wage increases, this decline is likely to be sustained with increasing funding pressure from Free Higher Education commitments and low economic growth
- Response: Appoint a Task Team & address in budget speech. The Minister of Finance should constitute a small task team to determine the causes, extent and consequences of the decline in per learner real expenditure and increase funding in the February Budget Speech. Any additional funds should be explicitly ring-fenced for evidence-based interventions like providing graded readers, reading coaches and lesson plans to all primary schools.
- (2) Radical prioritization and focusing on the Foundation Phase (Grade R-3): The first step towards fixing the education system is ruthless prioritization. South Africa does not have the financial resources, political capital or human expertise to solve many problems at the same time. Policy-makers and politicians need to accept that underperformance in matric and high drop-out rates are rooted in weak foundations in primary school and specifically in Grades R-3. If 78% of Grade 4’s cannot read for meaning in any language they are precluded from success at school. In mathematics, only a third of South African children are equipped to succeed which can reliably be traced back to primary school (Spaull & Kotze, 2015). We typically look at the approximately 360,000 matrics who pass (30%+) either Maths or Maths Literacy (2017) which is about 36% of the original cohort. Yet if we look at Grade 9 we see that only 34% of Grade 9’s could do basic maths (TIMSS 2015), and if we look even earlier at Grade 5 we see that only 39% of Grade 5’s acquired basic numeracy (TIMSS-N 2015). Clearly underperformance in high school and matric is driven by underperformance in primary school.
- Response: Fiscally prioritize Primary Schools. Institute an expenditure and hiring freeze on all additional programs and posts that are not targeted at numeracy and literacy in primary schools. At the most basic level the Post-Provisioning-Norms (PPN) should be adjusted to ensure fewer teachers for high-schools and more teachers for the Foundation Phase (Grades R-3). Both the Western Cape and the Eastern Cape have taken this approach and shown considerable success in doing so.
- Response: National Primary School Assessment. Implement a universal national assessment at Grade 3, 6 and 9 testing reading and mathematics. South Africa is the only country in the region without a nation-wide primary school exam. Without information on achievement one cannot target support or monitor progress.
- (3) A Ramaphosa Reading Plan: From the evidence presented above it is clear that the majority of South African learners are not receiving a quality education, or one that could be considered adequate. They leave primary school unable to read for meaning (basic literacy) or calculate with confidence (basic numeracy). The root of this can be found in the fact that 78% of learners do not learn to read for meaning in any language in the Foundation Phase. This is the source of the biggest problem and therefore must be the site of the biggest intervention.
- Response: (1) Provide graded reader anthologies to every child in Grades R-3. One of the most effective methods of teaching children to read is using what are called ‘graded-readers.’ These are available in all ex-Model C schools and are ubiquitous in OECD countries. They are a set of numbered stories that start with one word-texts (Story 1) and get incrementally more difficult until they are fully fledged texts (Story 66). These can be distributed together with the DBE Rainbow Workbooks simply by extending existing logistics and procurement contracts that are known to work (99% of DBE Workbooks reach their intended school). When using openly licensed graded readers (Vula Bula series) and printed in an anthology format (20 stories per book) the cost is drastically reduced. The ECDOE has proven the viability of this model in 2018 for use in 2019 when it distributed isiXhosa graded readers to every Foundation Phase child in the province. In September 2018, it printed 824,345 isiXhosa anthologies at a cost of R8 per color book (Personal Communication with DDG Penny Vinjevold) which were distributed in November 2018 to all primary schools in the province for use in 2019. To implement this in all Foundation Phase classes (Grade R-3) in the country would cost an estimated R24-million per annum. The print-ready files of these anthologies are already available in all official SA languages and have been evaluated and approved by literacy experts. They were used in Gauteng Primary Literacy and Mathematics Strategy (GPLMS), the Early Grade Reading Study (EGRS) and by the National Education Collaboration Trust (NECT). Given the low cost and potential high-impact of this intervention it is, as they say, a no-brainer.
- Response: (2) Recruit, train and employ a small army of Foundation Phase reading coaches. There is now strong evidence that the best way of improving learning outcomes throughout the system is by focusing on basic literacy and numeracy in the first three years of school. In South Africa, there have been a number of studies evaluating different methods of teacher training (centralized training, on-site coaching, cluster workshops etc.). The DBE’s Early Grade Reading Study (EGRS) Randomized Control Trials in the North West and Mpumalanga (200+ schools) have shown that the only method that improves reading outcomes significantly is a package of resources that includes (1) an expert reading coach that visits teachers in their classrooms, (2) lesson plans that guide teachers on how to use the resources, and (3) graded readers, Big Books and posters. In schools that received this intervention there was a 40% improvement in reading outcomes within two years as compared to control schools (Taylor et al., 2017). With a small army of reading coaches, resources, and lesson plans you could reach half of all primary schools within 8 years and it would cost approximately R1,3billion per year (Personal Communication, Stephen Taylor, DBE).
- Response: (3) Provide a minimum box of educational resources to all classrooms starting with Grade 1-3. The provision of the DBE Rainbow Workbooks to all primary schools in the country was arguably the largest single improvement to basic education since the advent of democracy. Although they are A4 and in full-colour, each book costs only R4 to print since they have no copyright and are printed in large volumes (Personal Communication Veronica McKay, 11 Jan 2019). This model of printing license-free (Creative Commons) materials in large volumes using a central government printer significantly lowers the cost of providing learning and teaching support materials. Rather than assuming teachers and schools have the time, knowledge and administrative capacity to select each textbook, workbook, poster etc and order these through cumbersome procurement processes (and therefore it doesn’t happen), the Department should centrally determine a “minimum box of resources” per grade that every teacher teaching that grade receives. For example, providing every Foundation Phase teacher with 40 Big Book Stories (one per week), 40 posters, Lesson Plans, Phonics Frieze, Alphabet Frieze, Phonics Cards, Alphabet Cards, and a basic set of stationery costs R2,770 per teacher (this is the LTSM cost per teacher per year of the Funda Wande Literacy Intervention in the Eastern Cape, i.e. using only Creative Commons licensed Vula Bula materials.) To provide this minimum box of LTSM for all primary school classrooms in the country would cost approximately R731million per year (There are approximately 33,000 teachers per grade in SA).
- Response: (4) Eliminate extreme class sizes. It is estimated that at least 10% of Foundation Phase learners in the Eastern Cape and Limpopo are in classes where the class size is 60 learners per class or higher (Spaull, 2016). Eliminating extreme classes of 50 or more learners per class, particularly in the Foundation Phase (Grade R-3), should be prioritized.
- Response: (5) Eliminate grossly inadequate physical infrastructure. The fact that SA is a middle-income country yet still has children that drown in pit latrines, and that hundreds of thousands of learners and teachers are forced to attend schools that do not have water, electricity or dignified sanitation should be a source of national shame. The President should appoint a task team (equipped with high-level politicians, civil engineering executives, union representatives etc.) to come up with a plan to eliminate all major infrastructure backlogs (water, electricity, sanitation) within the President’s first term. Note every South African president since the transition has promised to eliminate these unsafe schools yet here we are in 2019 and there are still thousands of them.
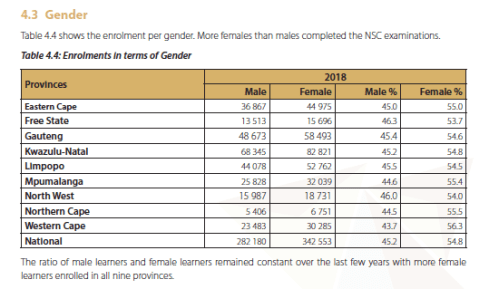
- Response: (6) Technology in education. There is currently a surge of interest in technology in education and specifically a new proposal to provide one-device-per-child. This is one area that has been studied quite extensively in various developing countries and the evidence consistently shows that providing technology to individual learners is not the most cost-effective method of improving learning outcomes and in every country where it has been implemented it was deemed a failure. (See Michael Trucano’s 2014 “Questions to ask (and not to ask) when your president tells you to buy 100k (or a million) tablets for students”). A sensible approach to increasing South African schools’ ICT readiness would involve (1) Prioritizing functional computer laboratories for high-schools (not primary schools), (2) providing all teachers with laptops, as well as (3) Ensuring more high-school learners take Computer Applications Technology (CAT) as a subject and increasing the number and quality of teachers who can teach this subject. For example, the number of Grade 12 learners passing Computer Applications Technology (CAT) is quite low at about 35,000 (7% of all candidates) and is actually declining (2018 NSC Report, p. 57). The ‘Action Plan 2019’ makes explicit mention of the severe inequalities that prevail with respect to access to more technical subjects (p. 31). For example, half of white males take technical subjects, against 5% for black African males. Only a quarter of schools writing the NSC offer CAT, and these are concentrated in quintiles 4 and 5: 67% of quintile 5 schools and 46% of quintile 4 schools offer CAT, against just 14% in quintiles 1 to 3 (in quintile 1 it is a mere 6%). Breaking the patterns of white and middle-class advantage by giving access to technical subjects is an important step towards a more equitable education system. This could be achieved by a goal to “Ensure that by 2024 half of quintiles 1 to 3 schools will begin offering Computer Applications Technology facilitating employment in the 21st Century workplace”.
- South Africa: There have been a number of initiatives in South Africa to implement various ICT-related programs and roll-outs, particularly in Gauteng and the Western Cape. A recent overview by Ostrowick (2016) summarizes the evidence (see Appendix B; see also Meyer & Gent, 2016). An evaluation of the Khanya Computer Labs project in the Western Cape (Louw et al, 2008) found “substantial variability in implementation” but did find a positive impact for those that used it. The Western Cape’s ‘e-Education Game Changer’ and Gauteng’s experimentation with SmartBoards and laptops for children are both instructive about the logistical complexities with using technology in education. There is also a recent MSDF-funded report conducted by AC Kearney (Draft copy 15 Jan 2019) on “Education Data and Tool Landscape Diagnostic review e-education in South Africa” that will be published at the end of January 2019.
Figure 6 below indicates that South African high-schools lag behind other developing countries when it comes to access to computers. However the evidence-based approach to remedy this is (1) focus on ensuring all high-school have functional computer laboratories (rather than one device per child, (2) piloting and evaluating teacher development programs on the use of ICT-in-teaching, (3) piloting and evaluating different software and apps to see which of these are most likely to be beneficial to learners and teachers.
Figure 6: Comparison of access to computers in high schools using TIMSS Gr8 2003-2015 (Source: Martin Gustafsson, 2019).
Summary of the evidence from comparison countries:
- Global review (Colombia, Peru, China, Netherlands, US, India, Israel, Romania, England, Netherlands, Ecuador): In a recent rigorous review of 26 studies on the use of hardware in teaching published in the American Economic Review, Muralidharan et al., (2018) find that the bulk of studies (67%) in 11 countries find no result at all (40%) or an ambiguous result with some positive and some negative results (27%). Only 27% of the studies found positive results and a minority found negative results (6%). Sample sizes for studies with “no impact” were often large and program intensity was substantial (Muralidharan, Singh & Ganimian, 2018: Appendix C). These studies are summarized in Appendix A below.
- Peru: Large-scale randomized control trial in 319 primary schools of the roll-out of One-Laptop-Per-Child in rural Peru: “No evidence is found of effects on enrollment and test scores in Math and Language…the time allocated to activities directly related to school does not seem to have changed. The program did not affect attendance or time allocated to doing homework. Second, it has been suggested that the introduction of computers increases motivation, but our results suggest otherwise. Third, there is no evidence the program influenced reading habits…Finally, the program did not seem to have affected the quality of instruction in class” (Inter-American Development Bank, 2012: p3).
- Colombia: Randomised Control Trial evaluation of “Computers for Education” in 97 schools in Colombia. The findings showed no improvement in learning outcomes: “Overall, the program seems to have had little effect on students’ test scores and other outcomes. These results are consistent across grade levels, subjects, and gender. The main reason for these results seems to be the failure to incorporate the computers into the educational process. Although the program increased the number of computers in the treatment schools and provided training to the teachers on how to use the computers in their classrooms, surveys of both teachers and students suggest that teachers did not incorporate the computers into their curriculum” (World Bank, 2009: p2).
- Kenya: USAID conducted a large-scale Randomized Control Trial comparing three interventions aimed at improving early literacy using technology: (1) student e-readers, (2) teacher tablets, and (3) tablets for Instructional Supervisors. “The Kisumu ICT study allowed for a comparative analysis of the impact of ICT on learning outcomes in Kenya when interventions took place at three different levels in the education system: student, teacher, and instructional coach. The results of all three of the Kisumu County interventions showed that literacy outcomes can be improved. Despite great excitement over ICT interventions to support literacy, however, technology is not a cure-all for the poor literacy outcomes in Kenya and other countries in sub-Saharan Africa. In this case, whereas technology may have helped TAC tutors to better provide instructional support, we found no evidence that providing tablets to teachers or e-readers to students was more effective than the base PRIMR literacy program that was implemented without expensive ICT. When costs are considered, there are non-ICT interventions that could have larger impacts on learning outcomes with lower costs.” (Piper et al., 2016: p213).
- Los Angeles: In March 2013 the largest school district in the United States (Los Angeles Unified School District, LAUSD) entered into a $1,3-billion contract with Apple and Pearson to provide 650,000 iPads and a Pearson-developed digital curriculum. Despite a functional and somewhat sophisticated education bureaucracy the project was deemed an outright failure: “In March 2014 [1 year after implementation] nearly all schools had stopped the usage of the Pearson curriculum due to crippling technical problems and incompleteness… Due to immense pressure and criticism, Deasy [The Superintendent General] resigned from the school district in October 2014. In December 2014 LAUSD officially terminated the contract with Apple as a result of frequent problems on the daily use of the curriculum, which frequently interrupted normal learning in schools. Based on these problems and following the termination of the contract, LAUSD sought a refund from Apple” (Alami, 2016: p65).
- Depoliticize the bureaucracy: Teacher unions play an important role in South Africa advocating for the interests of teachers. There is no reason why members of the national and provincial education bureaucracies should be allowed to be members of a teacher union if they are not teachers and do not work in a school. The interests of teachers and those of the government are often contradictory (for example managing a bloated budget on the one hand and wanting to increase teacher salaries on the other). If high-level officials in the DBE are paid-up teacher union members (as all the DDGs in the DBE are) the union technically sits on both sides of the bargaining table. The widespread perception that promotion in the provincial and national bureaucracies is only possible with SADTU is problematic for accountability and creates a conflict of interest.
- Response: Separate bureaucratic and teachers’ unions. While obviously members of the provincial and national Departments of Basic Education should be allowed to unionize, they should not be allowed to join a teacher’s union, given that they are not teachers. There is no reason why Departmental officials and in-school teachers need to e part of the same union. This would require passing legislation requiring that for someone to be a member of a teacher union they cannot work for the national or provincial Department of Basic Education.
References:
- Kerney. 2018. Education Data and Tool Landscape Diagnostic in South Africa. December 2018 Draft (162 pages)
Alami, A. (2016) Why do Technology Projects Fail? Procedia Computer Science 100 (2016) 62 – 71
Alvaredo, F., Chancel, L., Piketty, T., Saez, E., & Zucman, G. 2018. World Inequality Report 2018. Online. Available: http://wir2018.wid.world/ [Accessed: 26 June 2018]
Department of Basic Education. 2016. Report of the Ministerial Task Team Appointed by Minister Angie Motshekga to Investigate Allegations into the Selling of Posts of Educators By Members of Teachers Unions and Departmental Officials in Provincial Education Departments. Department of Basic Education. Pretoria
Inter-American Development Bank. (2012). Technology and Child Development: Evidence from the One Laptop per Child Program. IDB Working Paper Series No. IDB-WP 304.
Martin Gustafsson, 2018. “Understanding the sharp primary level enrolment increases beginning in 2011,”Working Papers 08/2018, Stellenbosch University, Department of Economics.
Mullis IVS, Martin MO, Foy P, Hooper M (2017) Pirls 2016: International Results in Reading. International Association for the Evaluation of Educational Achievement
Muralidharan, K., Singh, A., & Ganimian, A. J. (2018). Disrupting education? Experimental evidence on technology-aided instruction in India. American Economic Review, Working Paper.
Orthofer, A. Welath inequality in South Africa: Evidence from survey and tax data. REDI3x3 Working paper 15. June 2016.
Piper, B., Zuilkowski, S., Kwayumba, D., & Strigel, C. (2016). Does technology improve reading outcomes? Comparing the effectiveness and cost-effectiveness of ICT interventions for early grade reading in Kenya. International Journal of Educational Development 49 (2016) 2014-214
Ramphele, M. 2012. Education system worse than under apartheid: Ramphele. Mail & Guardian 23 March 2012. (Online). Available: https://mg.co.za/article/2012-03-23-education-system-worse-than-under-apartheid-ramphele [Accessed: 26 June 2018]
Schotte, S., Zizzamia, R., & Leibbrandt, M. (2018). A poverty dynamics approach to social stratification: The South African case. World Development 110 (2018) 88-103.
Spaull, N. and Kotze, J. (2015). Starting behind and staying behind in South Africa: The case of insurmountable learning deficits in mathematics. International Journal of Educational Development. Vol 41 (March) pp12-24
Spaull, N. (2016). Excessive class sizes in the Foundation Phase. Research on Socioeconomic Policy (RESEP). Policy Brief. Apr/2016.
Trucano. M (2016). Questions to ask (and not to ask) when your president tells you to buy 100k (or a million) tablets for students. World Bank. EduTech. (Online). Available: https://blogs.worldbank.org/edutech/educational-tablets-questions-to-ask
Van Broekhuizen, H. 2016. Graduate unemployment and Higher Education Institutions in South Africa. Stellenbosch Economic Working Paper Series WP08/2016. Stellenbosch, South Africa.
Van Broekhuizen, H., Van der Berg, S., & Hofmeyr, H. (2016) Higher Education Access and Outcomes for the 2008 National Matric Cohort. Stellenbosch Economic Working Paper 16/16 (Online). Available: http://resep.sun.ac.za/wp-content/uploads/2018/07/wp-16-2016_1.pdf
Van der Berg, S. & Gustafsson, M. (2019). Educational Outcomes in Post-Apartheid South Africa: Signs of Progress Despite Great Inequality. In “South African Schooling: The Enigma of inequality (Eds: Spaull, N & Jansen, J). Springer.
Van der Berg, S., Spaull, N., Wills, G., Gustafsson, M., & Kotzé, J. (2016) Identifying the Binding Constraints in Education. Report commissioned by the South African Presidency and funded by the European Union’s Programme to Support Pro-Poor Policy Development (PSPPD) initative.
Venkat, H. and Spaull, N. 2015. What do we know about primary teachers’ mathematical content knowledge in South Africa? An analysis of SACMEQ 2007. International Journal of Educational Development. Vol. 41 Mar. p.121-130.
World Bank. (2009). The Use and Misuse of Computers in Education: Evidence from a Randomizes Experiment in Colombia. Policy Research Working Paper 4836.
Appendix A: Summary table of Muralidharan et al.’s, (2018) overview of technology in education interventions

Appendix B: Status of Technology in SA Schools (Source: Ostrowick, 2016)


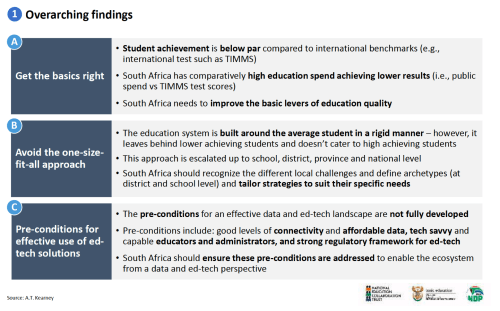
Appendix C: Over-arching findings of MSDF-funded AC Kearney report “Education Data and Tool Landscape Diagnostic in South Africa” (2019)
[1] This is based on my own calculations on the Matric 2014 National Senior Certificate data (i.e. it does not include IEB candidates, but does include independent schools that write the NSC. ‘Top’ here is defined as the largest number of mathematics distinctions (80%+). In almost all of these schools there are at least 9 mathematics distinctions per school. Note also that 23 of the 200 schools are independent schools writing the NSC exam.
[2] This is based on my own calculations using Treasury’s Estimates of Public Revenue and Expenditure (EPRE) data which is available on their website.
[3] This demographic phenomenon has been confirmed by Home Affairs birth registration data as well as age-specific data in the Department of Basic Education’s Annual Survey of Schools (ASS) and the Learner Unit Record Information Tracking System (LURITS). The leading explanation is that the rise in births coincides with the roll out of Anti-retroviral (ARV) treatment. Thus larger cohorts of children have been moving through the schooling system, with the ‘surge’ reaching Grade 8 in 2018