Category Archives: Newspaper articles

“Tito’s business unusual” – Our FM article on #Budget2020

tito

  • by Nic Spaull & David Carel

In the SONA it’s easy for the President to promise everything to everyone. A Sovereign Wealth Fund for you, a State Bank for you. You get a car, you also get a car, everyone gets a car. The budget speech is different because you now have to pay for all those cars. If you can’t find the money, you can’t spend it. And in this year’s budget the message came across loud and clear: we have reached the end of the road.

Minister Mboweni showed the courage to wake us up from the political twilight zone we have been in for too long: “We cannot go on like this. Classroom sizes are growing, hospitals are getting fuller and our communities are becoming increasingly unsafe.” We are close to a recession (economic growth in 2019 was 0,3%), debt is spiralling, and there are serious unresolved existential risks, such as Eskom. There is no more business as usual.

Government has finally decided to confront what it has been speaking about for a decade: reducing public sector wages. Mboweni announced that over the next three years government will cut the public sector wage bill by a colossal R160-billion. For the last ten years the public sector wage bill has been increasing much faster than inflation, much faster than economic growth and much faster than government’s ability to collect new revenue to pay for it. Those chickens have now come home to roost.

The 2020 allocation to Basic Education has decreased from R250,2-billion to R248,6-billion, falling R12-billion short of what was needed just to keep up with inflation. Because Basic Education is still the largest single line item in the budget and is also the largest employer in the country (with over 400,000 teachers on payroll), it provides the perfect case study of rising public sector wages and the crowding out of other essential expenditures. Over the last ten years teacher salaries have risen 45% faster than inflation, outstripping increases in budget allocations and hobbling provinces.

The two biggest consequences have been rising class sizes and the imposition of hiring freezes across provinces. The government’s own analysis shows that Learner:Teacher ratios have been consistently rising since 2010. Nationally representative independent studies (PIRLS) show that between 2011 and 2016 average class sizes at the Grade 4 level increased from 40 to 45 learners per class. For the poorest 60% of learners, who feel these increases most acutely, the increase was from 41 to 48 learners per class over the same period.

This is the outcome of above-inflation wage increases since there is always a trade-off between head-counts (the number of teachers employed) and salaries (what you pay them). That means larger class sizes and fewer personnel when wages rise in the face of capped budgets. The way provinces hire fewer teachers and save costs is by implementing hiring freezes, which virtually all have had to resort to (see KZNDoE circular 3 of 2018). Government payroll data from 2012 and 2016 shows that there was a 16% decline in school managers employed countrywide despite there only being 2% fewer schools (school managers are more expensive than teachers). There were double digit declines in the number of principals employed in the North West (-12%), Limpopo (-13%), and the Free State (-14%). In Limpopo alone there were 2,996 principals employed on payroll, yet there are 3,867 schools in the province. That is to say 23% of schools in Limpopo have no employed principal.

What’s clear is that this budget has drawn the lines along which factional battles will be fought over the coming year, both within the ANC, and between the ANC and COSATU. It is wrong and simplistic to see confining public sector wages as anti-poor. As we’ve seen with rising class sizes and withering school leadership teams, large wage increases in a time of almost no economic growth has real consequences for schools — especially for the poorest government schools.

We will soon see if the last decade’s crisis in political leadership will continue unabated or if the President has the leadership and backing to broker the needed compromises and new social compacts to move us forward. Minister Mboweni claims support from Cabinet and the President in confronting the wage bill. The big question now is whether the ANC will actually implement these policies, renegotiate already-signed wage agreements, and withstand the considerable heat that will be coming from COSATU. This will be the President’s biggest test to date and we should throw the full weight of our support behind him.

//

Dr Nic Spaull and David Carel are researchers in the Research on Socioeconomic Policy (RESEP) group at Stellenbosch University.

This article first appeared in the Financial Mail on the 27th of February 2020 with the title “Tito’s business unusual”

“Matric really does start in Gr1” – my M&G/Teacher article on TIMSS 2015

screen-shot-2017-01-31-at-7-05-23-am

(The article below first appeared in The Teacher magazine in January, and in the Mail & Guardian on the 27th of January 2017)

The month of January is an interesting one in the South African calendar. It seems that this is the one time in the year when everyone cares about education, or more accurately, cares about matric. And in some senses there is a good reason for this; matric is the gateway to higher education. If we look at 25-35 year olds in the 2011 Census data we see that for those with less than a matric, 47% were unemployed (using the broad definition), compared to 33% among those whose highest qualification was a matric and only 8% for those with a bachelors degree. While matric used to be the big distinguisher between the haves and have-nots, increasingly the difference is between those with some kind of tertiary qualification and everyone else. And in 2016, as usual, mathematics proved to be a tough gateway subject for those who want to study further. Only one in three learners who wrote Mathematics in 2016 got 40% or more in the subject, with a recent study showing that only about 15,000 matrics achieved 70% or more in mathematics. That’s about 1,5% of students who start school in Grade 1.

As anyone familiar with maths will tell you, the subject is a hierarchical one that builds upon itself. You need to understand multiplication and division before you can understand fractions or rate and proportion. So where do the wheels come off? Is it just before matric, perhaps in Grade 9 or 10? Or even earlier in Grade 4 or 5? To shed some light on this question we can turn to some recent mathematics research published by the Human Sciences Research Council (HSRC) at the end of last year. Every four years South Africa participates in an international study of mathematics achievement called the Trends in International Mathematics and Science Study or TIMSS. We test a nationally-representative sample of Grade 5 and Grade 9 learners on a standardised international test, which is the same test that is written by thousands of other students in other countries and allows us to compare ourselves to these other countries. (Although almost all the countries test their Grade 4 and Grade 8 students on these tests). The most recent round of tests was done in 2015.

The results showed that only 34% of our Grade 9 learners could do basic mathematics, i.e. could reach the lowest international benchmark. That is to say that 66% of our learners could not do basic computations or match tables to bar graphs or read a simple line graph. They had not acquired a basic understanding about whole numbers, decimals, operations or basic graphs. However there was one piece of encouraging information that emerged from the study and that was that the number of students that could do basic mathematics increased from 24% in 2011 to 34% in 2015 in South Africa, one of the fastest improvements seen internationally.

But if 66% of our Grade 9 learners can’t do basic maths, when did these gaps emerge? In 2015, for the first time in our history, South Africa also participated in the primary-school level of TIMSS that usually tests Grade 4 learners – we tested our Grade 5 learners. It showed that 61% of Grade 5 learners could not reach the Low International Benchmark. Learners who do not reach the low international benchmark at the primary level cannot add and subtract three or four digit whole numbers like 218 and 191. They do not recognise familiar geometric shapes or parallel and perpendicular lines. They cannot read and complete simple bar graphs and tables. For example, according to our curriculum, multiplying a 3-digit number by a 1-digit number is meant to be covered in Term 1 of Grade 4 yet only 41% of our Grade 5 learners could calculate “512 x 3 =____”, which was one of the questions in 2015. So almost 60% of our Grade 5 learners are already significantly behind the curriculum in 2015.

The conclusion that the root of our problems is not in high school but rather much earlier, in the lower grades of primary school is not a new finding – there are many studies showing this from at least 1999. In a report published nearly 10 years ago, one South African education researcher (Dr Eric Scholar) analysed the mathematics achievement in 154 schools across the country. He concluded that the low levels of achievement we see in the higher grades are rooted in weak foundations in primary school. To quote his exact conclusion:

‘‘The fundamental cause of poor learner performance across our education system is a failure to extend the ability of learners from counting to true calculating in their primary schooling. All more complex mathematics depends, in the first instance, on an instinctive understanding of place value within the base-10 number system, combined with an ability to readily perform basic calculations and see numeric relationships … Learners are routinely promoted from one Grade to the next without having mastered the content and foundational competences of preceding Grades, resulting in a large cognitive backlog that progressively inhibits the acquisition of more complex competencies. The consequence is that every class has become, in effect, a ‘multi-Grade’ class in which there is a very large range of learner abilities and this makes it very difficult, or even impossible, to consistently teach to the required assessment standards for any particular Grade. Mathematics, however, is a hierarchical subject in which the development of increasingly complex cognitive abilities at each succeeding level is dependent on the progressive and cumulative mastery of its conceptual frameworks, starting with the absolutely fundamental basics of place value (the base-10 number system) and the four operations (calculation)’’

While as a country we continue to obsess about the matric pass rate, the research is really quite clear. The majority of our young people are acaquiring learning deficits early on in primary school and then carrying these with them as they move through school. As they are promoted into higher grades there is a decoupling between what learners know and can do and what the curriculum expects from them. We need to acknowledge that matric starts in Grade 1 (and even earlier), and that it really is possible to improve primary schooling if that is where we focus most of our time, energy and resources.

My M&G article on Universities in 2017

screen-shot-2017-01-08-at-1-10-29-pm

(The above article was published in the Mail & Guardian on the 6th of January 2016 and is available in PDF here).

Students contest the status quo 

Over the last two years, universities in South Africa have become increasingly contested spaces. Student movements like RhodesMustFall and FeesMustFall have categorically rejected the status quo as unacceptable and are working to reorder not only the principles that govern universities, but ultimately the principles that govern the country. Of course the first order of business is challenging our current assumptions about who should go to university, what it should look like, and who should pay for it. And on all three fronts they have been phenomenally successful. It is really quite remarkable that a loose group of students who lack a political mandate, who have not been elected by anyone, and have virtually no resources have managed to achieve so much so quickly. They have brought whole universities to their knees and prompted the creation of a Presidential Task Team. Most significantly they garnered enough support to essentially force the government to allocate an additional R17 billion to higher education in the Medium Term Budget.

About 200 years ago, Napoleon Bonaparte famously quipped that a revolution is simply an idea which has found its bayonets. In the context of the various student movements I think it’s worthwhile to try and identify the underlying idea, its animating principle. As the student movements assemble and reassemble under different names (seemingly quite effortlessly), I think there is a leitmotif running through all of them; the unfinished business of 1994. There is a generation of young Black South Africans who feel that the terms of the negotiated settlement were unjust and let White South Africans off the hook. Dr Amos Wilson. a theoretical psychologist and social theorist, makes the logic behind this position explicit in the following quote:

“Justice requires not only the ceasing and desisting of injustice but also requires either punishment or reparation for injuries and damages inflicted for prior wrongdoing. The essence of justice is the redistribution of gains earned through the perpetration of injustice. If restitution is not made and reparations not instituted to compensate for prior injustices, those injustices are in effect rewarded. And the benefits such rewards conferred on the perpetrators of injustice will continue to “draw interest,” to be reinvested, and to be passed on to their children, who will use their inherited advantages to continue to exploit the children of the victims of the injustice of their ancestors. Consequently, injustice and inequality will be maintained across generations as will their deleterious social, economic, and political outcomes.”

Thinking that the various incarnations of the student movements are primarily about universities is a mistake. RhodesMustfall was not about a statue; it was about reclamation and power and history. Similarly, the challenge today is not only about who should pay fees, but who should own the land. The discontent and anger about the ‘pay-to-play’ market system that we have – where only those who can pay for quality get it – is as much about private hospitals and Model-C schools as it is about universities. The true contested space at our universities at the moment is really about the principles that currently order our society and reimagining different ones.

Fighting for a different future

There are students in South Africa today who look at our country and refuse to accept that the way we are currently doing things is the only way they can be done. How is it that in a country with considerable wealth and resources that we still have 10 million people living on less than R10 a day? Whenever I land at Cape Town International Airport and get an aerial view of Khayelitsha, I think to myself “How the heck can we, as a country, not find a dignified solution to housing for the poor?” In Cape Town we have 400,000 people living in shacks a mere 40-minute drive from the house that sold for R290-million in Bantry Bay. We have decadent opulence living next to extreme poverty. It’s not right.

And so we come back to the contested space at universities where people have different ideas about how we get from where we are to a better future. Students associated with Black-First-Land-First argue for land expropriation without compensation. The Nobel Laureate Thomas Piketty motivates for much steeper wealth and inheritance taxes to level the playing field. The Wits SRC has proposed a once-off ‘apartheid windfall’ tax on “companies that benefited unfairly by abusing state resources” under apartheid.

But since the current discussions at universities are still centred on fees and access to university, let’s start there and think about what 2017 might hold for universities, and put some numbers on the table. Personally I think we will actually find a sustainable solution to student financing at universities, possibly even in 2017. Sizwe Nxasana – the head of the Presidential Task Team – has developed a highly sophisticated and workable model of student funding called the Ikusasa Student Financial Aid Programme (ISFAP) that is being trialled at seven universities this year, focussing on students studying medicine, engineering and accounting. This is essentially a public-private partnership which aims to “significantly increase the funding and resources which are made available to support students from working class families to graduate and find employment by leveraging private sector funding.” One can think of it as a three-tier model with the poorest students being fully funded with grants and the missing-middle with a combination of grants and income-contingent loans (to be repaid only if the recipient does graduate and earns above a certain amount). Then finally, those at the top that can pay fees do pay fees. While it isn’t free education for everyone – and the vanguard may therefore not accept it – if implemented properly it has a good shot at ensuring that no student is excluded from university on financial grounds. That would be a significant achievement.

Thankfully, many in the sector are now realising that needs-blind allocations to higher education – where all students are equally subsidised – are socially regressive and anti-poor. This is largely because the children of the wealthy attend fee-charging schools that give them a much better shot at qualifying for university than the children of the poor. We know that less than 1 in 10 children from the poorest 70% of households qualify to go to university compared to 1 in 2 or 3 children (40%) among the wealthiest 10% of households. And because of this, if one allocated an additional R10bn to higher-education in a blanket fashion, then about R6,8bn (68%) will end up benefitting the wealthiest 20% of South African households because it is their children who are disproportionately at university (according to two fiscal incidence studies). A recent study showed that 60% of students that qualified for university came from the 30% of high schools that charged fees. What is the point of raising revenue by additional taxes on the richest 20% only to give two thirds of that money straight back to them in the form of indirect subsidies to their children?

So if we agree that the rich should not be subsidised (usually defined as those in households with annual income of more than R600,000), how many students would need funding? Professor Servaas van der Berg’s analysis of household surveys has shown that about 60% of the current university-going population would be eligible for funding. (This assumes that income is under-captured in surveys by about 30% . Importantly, this would cover 73% of Black African university students and 30% of White university students.

While ending financial exclusion at university won’t solve the thornier issues in South Africa – about land, inequality, restitution, primary education, unemployment – it would serve as a powerful and invigorating example that things really can be different to what they are now. It would be poetic if the start of a successful campaign for a different South Africa could trace its origins to the toppling of a statue of Cecil John Rhodes.

Dr Nic Spaull is an education researcher at the Research on Socioeconomic Policy (RESEP) group at Stellenbosch University. He is on Twitter @NicSpaull


“Higher education: Free for the poor not free for all” (my ST article)

stdonald1

(The article below first appeared in the Sunday Times on the 16th of October 2016)

Across the country student protests have shut down universities with demands for “free higher education for all” prompting a Fees Commission and more recently a Presidential Task Team of Ministers to help solve the crisis. At the root of the issue is the righteous indignation about the fact that academically deserving students are excluded from university (either initially or subsequently) because they cannot pay their fees or living expenses. After overcoming countless barriers to simply get to university, these resilient students are then excluded simply because they are poor. This is unacceptable. I whole-heartedly agree with the underlying principle that no student should be excluded from university on financial grounds, which is unfortunately the status quo. Note that this is not the same as saying I think we should have “free higher education for all.” I think that subsidizing the richest 10% of South African households is unconscionable and unjustifiable, and “free education for everyone” is exactly that: a subsidy for the rich. Let me explain why.

Firstly we have to ask who makes it to university? A recent study published last month by my colleagues Dr Hendrik van Broekhuizen and Professor Servaas van der Berg shows that of 100 children that started school, only 14 will qualify for university, 12 will actually enrol and only 6 will get some kind of undergraduate qualification within 6 years. So when we speak about university we are really speaking about the 12% of students that actually make it to university. And who are the students that qualify? In a recent matric cohort, about 60% of those that qualified came from the wealthiest 30% of high schools (quintile 4 and 5), most of which charged fees. And who attends fee-charging schools? Largely those wealthier students whose parents can afford the fees. We can also look at this by race; about half (47%) of white matriculants go to university compared to less than a fifth of Black (17%) and Coloured (20%) matriculants.

This explains why blanket fee-free education is considered to be highly regressive or anti-poor. In contrast to a free-for-the-poor system which is pro-poor. The fact that the children from the wealthiest households are many times more likely to get in to university means that they would benefit disproportionately from a blanket fee-free system. It should thus come as no surprise that the World Bank (2014) and Van der Berg (2016) both estimate that as much as half (48%) of the university funding in South Africa accrues to the richest 10% of households. And two thirds (68%) accrues to the wealthiest 20% of households. As Van der Berg notes, this constitutes an “extreme bias towards spending on the rich if all students are equally subsidised.”

What is the point of raising revenue by additional taxes on the richest 20% only to give two thirds of that money straight back to them in the form of indirect subsidies to their children? No, instead we should use all the revenue raised from the additional taxes – however much that might be – to properly fund the poorest 80% of students who manage to qualify against all odds and who really need the funding.

The next question then becomes what the best modality is for ensuring that no student is excluded from university on financial grounds. While ideologically students may be demanding ‘free-education for all’, the existing economic environment of depressed economic growth and fiscal consolidation means that it is not easy to find an additional R60bn of recurrent expenditure. It is not a cop-out when Treasury says that it cannot simply ‘find’ an additional R60bn every year. To put this in perspective, the entire government budget of the Western Cape is R55bn. Health, housing, education, everything. We also need to grapple with the issue that additional money allocated to higher education is likely to crowd out other budget items like the progressive realisation of other constitutional imperatives such as universal health care (National Health Insurance) or universal housing.

Personally I am in favour of raising taxes (the skills tax and the capital gains tax) to fund poor and working class students who are currently financially excluded from university. Yet we need to go further than that to cover the “missing middle.” I think that a hybrid system of grants, subsidized loans and fees would lead to the largest reduction in financial exclusion, irrespective of how much is raised. The poorest students would receive ‘free’ education in the form of adequate grants that cover both fees and living expenses. The missing middle would qualify for government backed loans whose repayment was contingent on graduating and earning above a certain threshold (income-contingent loans), and the wealthy would pay fees, as they are currently doing. Those students who get government-backed loans would carry little financial risk, receive subsidized interest rates and capped loan repayments that would only revert in the event that they earn above a certain threshold. The leveraging effect of using the existing financial markets and banks means that, for example, R15bn of additional revenue could stand surety for loans of up to R60bn. So while it might only be possible to raise an additional R15bn – through a 1% rise in the Skills Levy for example -, one could ensure that no students are excluded on financial grounds. This is not politically sexy or glamorous, and doesn’t have a catchy hashtag (yet) but it does grapple with the budgetary realities we face as a country.

It is not at all clear to me why the different student movements are insisting on free education for everyone (including the rich) in spite of all the evidence that this would be fiscally irresponsible and socially regressive. Subsidizing the rich wastes precious tax income that could otherwise have supported more poor and working class students. Furthermore, if we can shift the conversation from an ideological (but unworkable) “Free Education For All” to a pragmatic “Funding For All” we will be taking a big step in the right direction.

Shaky data skews literacy results (M&G article on SACMEQ IV)

screen-shot-2016-09-25-at-11-26-28-am

(The article below was published by the Mail & Guardian on the 23rd of September 2016)

Every few years South Africa participates in international tests of reading, mathematics and science in an attempt to see what our students know and can do, and how this is changing over time. These tests are independently set and usually comparable over time. Every 4 or 5 years we test our Grade 9 students in maths and science (Timss) and our Grade 4/5 students in reading (Pirls), and every 6 years we test our Grade 6 students in reading and mathematics (Sacmeq). 2016 happens to be the year when all the results of these assessments are released to the public. The 2015 Timss and Pirls results will be released in November/December this year and the 2013 Sacmeq results were presented to Parliament earlier this month, which is what I will focus on here.

In what would have been the biggest news of the post-apartheid period – at least if it were true – Parliament heard that South Africa’s primary education system improved faster than any other education system in the history of international testing, i.e. since 1967. Our alleged improvement was more than twice as large as the fastest improving country in the world, Brazil. To be specific, South African Grade 6 students’ test scores improved by more than 0.9 standard deviations between 2007 and 2013 or the equivalent of an extra 3 full years worth of learning. To put this in perspective, this is the same as taking Thailand- or Mexico’s education system and making it equal to Finland’s or Canada’s in 6 years. It makes for a great story or a wish from a Fairy Godmother, but not for plausible results from a psychometrically-rigorous international test. Note that it is not only South Africa that experienced these colossal ‘gains’, but all Sacmeq countries, which is even more suspicious. A big part of the alleged Sacmeq improvements actually arise from different methodologies employed in 2007 and 2013, making them incomparable until they are properly equated.

The results presented to Parliament compare data from 2007 and 2013, yet the way these results were calculated in each period was not the same, and I should I know. I was appointed by Sacmeq itself earlier this year to analyse the results for the international Sacmeq report. After analysing the data I raised a number of serious technical concerns about the data that significantly affect the comparability and validity of the findings, and especially the fact that the weaker students had been excluded from the final analysis. I advised the Sacmeq Secretariat to address these concerns before any publication of the results since doing so would be misleading. Based on the subsequent response from the SACMEQ Secretariat indicating that this would not happen I explained that I could not in good conscience continue with the analysis and chose to resign on technical grounds in August this year. The issues I raised have not been addressed since the results presented to Parliament were the same as those that I identified as problematic. At the same time this was going on I emailed the Department flagging my concerns and cautioning against publishing the results.

The Department of Basic Education itself was shocked by the unprecedented improvements. In the presentation to Parliament they explain: “Given the significant improvements, the South African national research team requested SACMEQ to double check the results and were subsequently reassured on their accuracy.” This is simply not good enough.

The lack of comparability between 2007 and 2013 is so glaringly obvious one doesn’t need inside knowledge of the data to see how implausible the results are. At the same time that the student reading scores soared (rising by 0.9 standard deviations), the teacher reading scores plummeted (dropping by 0.8 standard deviations), which is extremely peculiar. If we are to believe the results, by 2013 basically all South African students could read, with illiteracy rates dropping from 27% in 2007 to 3% in 2013. This is totally at odds with the other main international test we do, Pirls in 2011, which showed that 29% of Grade 4 students were reading-illiterate and 58% could not read for meaning, confirming a host of smaller studies showing the same thing.

If we dig a little deeper, the Department’s presentation to Parliament apparently showed that the biggest improvers were Limpopo and the Eastern Cape. Go figure. These are the very same provinces that were placed under administration (Section 100) in 2011 because they were so utterly dysfunctional. To use the Minister’s own words, these are the education system’s “pockets of disaster” whose 2015 matric results were a “national catastrophe.” Yet Sacmeq would have us believe that illiteracy in Limpopo has been totally eradicated, dropping from 49% in 2007 to 5% in 2013. In stark contrast, our other major international test (Prepirls) showed that of the more than 2900 Grade 4 students that were tested in Limpopo in 2011, 50% were reading-illiterate and 83% could not read for meaning.

For those unfamiliar with the norms of psychometrics and testing, it is perhaps helpful to explain by analogy. The scale of the ‘improvements’ in test scores shown in SACMEQ 2013 is tantamount to saying that Usain Bolt and all the other athletes in the race ran the 100m in 5 seconds without ever wondering whether there was something wrong with the stopwatch. The sad thing about all of this is that it does seem that South Africa is really improving – other reliable evidence points to this – but not nearly as fast as the SACMEQ IV test scores would have us believe. According to the presentation, the Sacmeq questionnaire data also encouragingly shows that students’ access to their own textbooks increased substantially over the period from 45% to 66% for reading textbooks and from 36% to 66% for maths textbooks. This is good news.

In the latest turn of events the Department explained that apparently the results presented to Parliament were in fact “preliminary”, that an “extensive verification process” is currently underway, and that it is “fully aware of the issues raised in this regard.” Yet why then did it choose to go ahead and present questionable results to Parliament? Apparently researchers – AKA me – have “mislead the public” and my motives are “unclear.” There is nothing unclear about my motives; there is a major technical concern and the public should not be mislead into trusting these results presented to Parliament. There is also no uncertainty about whether the Sacmeq IV results should have been presented to Parliament. They should not have been presented while there is still so much uncertainty around the comparability of the results, end of story. The Department has been aware of the serious technical concerns around the results for some time now, since I emailed a number of members of the Department’s own research team many months ago drawing attention to these problems and cautioning against publishing any results until they could be rectified.

What I do not understand is why the Department would undermine their own technical credibility by presenting obviously questionable results to Parliament. Personally I would also not be surprised if the Sacmeq data – once comparable – did show an improvement in line with those of other studies. Soon we will also have the Pirls results of 2015 as another data point to verify what is going on. In South African education there is probably already a good story to tell, why muddy the waters by reporting such obviously impossible improvements based on dodgy data? The Department and Sacmeq must make sure the results of Sacmeq 2007 and 2013 are strictly comparable before reporting any further results and causing additional confusion.


My M&G article responding to the Statistician General

Spaull M&G 13 May

This was first published in the Mail & Guardian on the 13th of May 2016. The PDF of the article is also available as text below:

Black graduates have doubled in last 10 years – Dr Nic Spaull

As someone who has written quite extensively about the failings of our education system, I was unusually surprised by the quotes emerging in the media coverage of a recent Stats SA report and even more so by the Statistician General Pali Lehohla’s comments last week. Following publication of the report, titled “The Social Profile of Youth”, the Business Day was quick to inform us that apparently black youth were less educated now than 20 years ago.” The Daily Maverick ran a similar headline: “Stats SA claims black youth are less skilled than their parents”, with equally alarmist coverage in Times Live, ENCA, SABC etc. Unfortunately StatsSA did not denounce the media’s claims. The story seems to have grown legs, with former president Thabo Mbeki calling it a “national emergency” and the Shadow Minister of Basic Education speaking of “the collapse of education in poor communities.”

Of course none of this is true. As we shall see, Black youth have higher levels of educational attainment today than at any other point in South Africa’s history. There are more Black matrics, more black high level passes in mathematics and science, and many more Black university graduates. (Note that this is both as a proportion of the Black population and in absolute terms). In this article I will focus on black university graduates since everyone agrees that there have been large increases in black youth passing matric and achieving bachelor’s passes.

If we cut to the chase the confusion all centres on one strange graph (Figure 4.2) appearing on page 64 of the 2015 Stats SA report “Census 2011: A profile of education enrolment, attainment and progression in South Africa” and the misinterpretation of what that graph apparently shows. That graph shows that the proportion of black and coloured youth that graduate with a bachelor’s degree “after completing matric” has been declining for 20 years, while for whites and Indians it has been increasing. This is very strange and does not seem to agree with other, perhaps more reliable data sources. Unlike when trying to measure things like the unemployment rate or wages (where you have to turn to household survey data or the Census), when counting the number of university degrees awarded it’s a little easier. We can look at surveys, but we can also just look at the Higher Education Management Information System (Hemis) the record-keeping system stating who has been granted what degree and when. All degrees that are granted must be recorded on this database. So what does Hemis tell us about the number of black youth actually getting degrees over the last 20 years?

Fortuitously, this exact question was addressed in a Stellenbosch Economic Working Paper (08/16) published last week by my colleague Dr Hendrik van Broekhuizen. In that paper he shows that “while the number of White graduates produced annually has increased only moderately from about 27 500 to just over 35 000 in the past 25 years, the number of Black graduates produced has increased more than 16-fold from about 3 400 in 1986 to more than 63 000 in 2012.” For this article I was particularly interested in degrees rather than diplomas or certificates) and he kindly provided the figures for degrees only by race (see figure below). The changes have been equally dramatic. Between 1994 and 2014 the number of black graduates with degrees being produced each year has more than quadrupled, from about 11,339 (in 1994) to 20,513 (in 2004) to 48,686 graduates (in 2014). Even if one only focuses on the recent period between 2004 and 2014 Black graduates increased by about 137% (compared to 9% for whites), while the black population grew by about 16% over the same period.

This might lead us to yet another famous South African myth; that graduate unemployment is high (it isn’t) or increasing (it’s not). Again, rigorous research by Dr Van Broekhuizen and Professor Servaas van der Berg convincingly debunks this hoax. They conclude their research report as follows: “The frequently reported ‘crisis in graduate unemployment’ in South Africa is a fallacy based on questionable research. Not only is graduate unemployment low at less than 6%, but it also compares well with rates in developed countries. The large expansion of black graduate numbers has not significantly exacerbated unemployment amongst graduates….Black graduates are, however, still more likely to be unemployed than white graduates.” (Note: in 2015 black graduate unemployment was about 9% compared to 3% for whites.) [Their extended article is here]

 Another colleague of mine, Dr Stephen Taylor in his response to the Statistician General (Business Day, 29 April) has shown why Stats SA’s Figure 4.2 is so misleading (essentially the increase in black matrics was larger than the increase in black graduates, but both increased substantially). Unfortunately the SG has simply lashed out at Dr Taylor referring to his critique as “technically incomprehensible and policy irrelevant” (Business Day, 5 May). To avoid a similar riposte let me be clear: Black graduates have more than doubled in the last ten years. The black population hasn’t. Therefore, black youth are more likely to get degrees than 10 years ago. I think this is both technically comprehensible and policy relevant.

The argument that “black youth are regressing educationally” feeds a dangerous narrative that is not supported by any education data in South Africa. Not improving fast enough, yes. Regressing, no. Black youth have higher educational attainment now than at any point in South Africa’s history. This does not change my firmly held view that our education system is in crisis and that we need meaningful reform, that goes without saying. The egregious levels of educational inequality between working class and middle-class families, and between whites and blacks should cause alarm. And yes, our youth unemployment problem is monumental and unsustainable; there is widespread and legitimate research to show that. But spreading fallacious rumours and causing doubt where there is none, helps no one. Together with a number of colleagues and officials I would ask the Statistician General to please clarify his comments on black graduates and set the record straight.

//

Dr Nic Spaull is a Research Fellow at the University of Johannesburg, the University of Stellenbosch and the OECD.  

Workings for graphs (thanks Hendrik van Broekhuizen!)

Year Black Coloured Asian White
Y1986 2957 1131 1532 17601
Y1987 3153 1280 1692 19064
Y1988 3546 1349 1771 20494
Y1989 4043 1760 1930 21613
Y1990 4862 1958 1975 22747
Y1991 7115 2230 2170 23800
Y1992 8130 2270 2363 24901
Y1993 8661 2392 2621 24571
Y1994 11339 2127 3023 25538
Y1995 13123 1833 2506 16885
Y1996 15781 1785 2479 16363
Y1997 17367 1869 2713 16385
Y1998 17181 1949 2796 15650
Y1999 19093 1785 2175 15410
Y2000 20379 1909 3193 15896
Y2001 17017 1913 3430 16017
Y2002 16222 2075 3712 17094
Y2003 17234 2322 3776 17948
Y2004 20513 2640 4307 18757
Y2005 21052 2916 4505 19860
Y2006 22508 3097 4805 20732
Y2007 23356 3480 4840 20522
Y2008 25373 3677 4984 20482
Y2009 27869 3866 4774 20555
Y2010 31453 4366 4690 20456
Y2011 34209 4456 5109 20248
Y2012 40001 4778 5089 20303
Y2013 45948 5291 5748 21548
Y2014 48686 5622 5529 20510

*These include the following: General Academic Bachelor’s Degree; Professional First Bachelor’s Degree; Baccalaureus Technologiae Degree; Professional First Bachelor’s Degree; First National Diploma (3 years); First National Diploma (4 years)

Figures refer to the number of HE awards and will thus be at least as large as the number of graduates produced in each year. Includes only undergraduate degrees. (Thus excludes all UG   diplomas, and certificates

Black youths are NOT educationally worse off than 20 years ago – Dr Stephen Taylor

Screen Shot 2016-04-30 at 7.45.40 AM

Figure 1: Proportions of the population achieving secondary education (left) and a bachelors degree (right). (Source: Stats SA (2015): CENSUS 2011: A profile of education enrolment, attainment and progression in South Africa, page 41.)

On the 18th of April the Business Day published a piece titled, “Black youth less educated now than 20 years ago.” This statement is simply wrong and unsupported by any data set. Yet the story is now gaining momentum and has been published by other news outlets, such as the Daily Maverick, reporting that “Stats SA claims black youth are less skilled than their parents.”

The article asserts that “black and coloured youths have regressed in their educational achievements” and that the proportion of black and coloured youth that complete a university degree as a share of the population has decreased. This is factually incorrect.

The article references a recent Stats SA report on the status of the youth as well as comments by the Statistician General, Pali Lohohla, as the basis for these assertions.

But in fact, the Stats SA published reports (as with all other analysis I have seen or done) indicate that the proportions of black and coloured youths who attain grade 9, grade 12, and a university degree, have all increased consistently in recent decades and are still increasing. It is thus not clear where this misconception arose.

I suspect the mistake may have arisen through a misunderstanding of a statistic which has been presented by the Statistician General recently and which appears in Stats SA’s report on educational enrolment, attainment and progression (December 2015). The statistic shows that the proportion of black and coloured youths who achieve a bachelors degree “after completing grade 12” has been declining over the last 20 to 30 years.

It needs to be understood that this statistic is the proportion of matriculants who go on to attain a degree. In other words, the denominator in this calculation is matriculants as opposed to the entire black and coloured population.

The improvement in matric attainment among black and coloured youth has been larger than the improvement in degree attainment among black and coloured youth, but – and this is the important part – there have been big improvements in both. The fact that the increase in degree completion has been slower than the increase in matric completion is not at all an indication that youth are worse off now than 20 years ago.

So the ‘bad’ news is that degree completion, although it has increased, has not kept pace with the fast increase in the attainment of matric amongst black and coloured youths. But this certainly does not mean that educational outcomes are worse than 20 years ago.

So what do the numbers actually say? The Stats SA report issued in December shows that the proportion of black people completing matric has been consistently increasing from about 20% to about 50% over the last 50 years. That report also indicates that the proportion of black people completing a degree has increased from about 2% to about 4% over the same period.

Whether you read official Stats SA reports or do your own calculations on the various Stats SA datasets – I have analysed Census data from 1996, 2001 and 2011 as well as General Household Survey data from 2002 to 2014 – it is clear that both matric attainment and degree attainment has been increasing amongst the black and coloured population.

It is also useful to consider the Department of Basic Education’s matric statistics from recent years. In 1990, there were 191 000 matric passes. By 2015 this number had more than doubled to 465 863. This increase has been driven mainly by growing numbers of black youth passing – and this growth has easily outstripped population growth, which has been about 1% a year. Even since 2008, the number of black matric passes has increased from about 250 000 to over 350 000. And the number of black people achieving a bachelors pass in matric has increased from about 60 000 to about 120 000 since 2008.

I am by no means suggesting that everything is fine in our education system. Despite the progress, there are still too many youths who do not get to grade 12, the main reason being that educational foundations laid in earlier grades have been inadequate. And completion rates at our higher education institutions should worry us. But there have been improvements in both of these areas relative to 20 years ago.

Although improved access at lower levels of education (primary and secondary school completion) has been faster than access at higher levels, paradoxically the solutions must focus on the early grades if sustainable progress is to be made.

The most alarming education statistics to me are the low proportions of children achieving basic literacy and numeracy in the early grades. International assessments of education quality point to serious deficiencies in this area, even compared to some other countries in the region. If children are not learning to read in the early grades, they will not be able to make it to higher education.

But even in the area of learning quality, the evidence points to improvement. The Trends in International Mathematics and Science study (TIMSS) showed substantial improvements in mathematics and science achievement at the grade 9 level between 2002 and 2011. However, this improvement is off a very low base.

Educational outcomes in South Africa remain far too low, especially amongst youths from poor communities. But claims that education was better under apartheid or that outcomes have deteriorated over the last 20 years are alarmist and have no basis in reality.

Dr Stephen Taylor is a researcher in the South African Department of Basic Education. His work includes impact evaluation of education interventions, measuring educational performance and equity in educational outcomes. In 2010 he completed a PhD in economics at the University of Stellenbosch, analysing educational outcomes of poor South African children.

(This article first appeared in the Business Day on Friday the 29th of April 2016)


The Biggest Solvable Problem in SA: Reading

book

Whenever I travel overseas I am asked the question “What is the biggest problem in South Africa?” And I typically respond, “The biggest problem or the biggest solvable problem?” In the 2000’s the biggest problem was HIV/AIDS. After hundreds of thousands of unnecessary deaths – the equivalent of a small genocide – the government ceded to the courts and offered life-saving ARVs to those infected with HIV and saved their lives. HIV was, and is, a solvable problem. Unfortunately the three biggest problems in South Africa today – too few jobs, too little growth, and too much inequality – are not easily solvable. And because we don’t exactly know how to ‘create’ jobs or growth, we don’t really know how to decease inequality much further.

Of course everyone has theories about how we can increase jobs, but the evidence is pretty thin. Depending on your political fancy and chosen economic guru there are various concoctions ranging from youth wage subsidies, eliminating red-tape, decreasing taxes, increasing taxes, digging holes, filling holes…you get the picture. Ask the top labour-economists in the country how to create jobs and you won’t get a straight answer (This is partly a provocation to said labour economists to tell us if there is in fact any coalesced consensus). You won’t even get consensus on the next three steps towards finding the answer; which is, incidentally, not a uniquely South African problem. So what to do? I think the best response is to keep cracking away at the problem; experimenting, evaluating, moving forward. But in the mean time we should also be allocating time, energy and resources to solvable problems; those we haven’t currently cracked but have a pretty good idea of how to do so. Epidemic HIV; distribute free ARVs. Crippling poverty; introduce the child support grant. Widespread malnutrition; provide free school meals to most children. The government should be heavily praised for all of these important initiatives.

But the problem I want to focus on here is the fact that most kids do not learn to read in lower-primary school. South Africa is unique among upper middle-income countries in that less than half of its primary school children learn to read for meaning in any language in lower primary school.

Irrespective of how tenuous or strong you believe the relationship is between education and economic growth, teaching all children to read well is a unanimously agreed upon goal in the 21st century. It is necessary for dignified living in a modern world, it is necessary for non-menial jobs, it is necessary for a functioning democracy. It also usually helps with ignorance, bigotry and a lack of empathy. In a modern context illiteracy is a disease that is eradicable, unlike unemployment or inequality. Like polio, illiteracy practically does not exist in most wealthy or even middle-income countries (defined here as basic reading). Illiteracy rates among those who have completed grade 4 are in the low single digits in wealthy countries like England (5%), the United States (2%) and Finland (1%) and less than 50% in most middle income countries such as Colombia (28%), Indonesia (34%), and Iran (24%). It’s difficult to get directly comparable estimates for the whole country but the best estimate from the recent pre-Progress in International Reading Literacy Study (PIRLS) surveys is about 58%. That is to say 58% of Grade 4/5 students cannot read for meaning in any language. And why is Grade 4 a critical period? The South African curriculum (like most curricula) prescribes that in the first three years of schooling children must ‘learn to read’, then from grade 4 onwards they must ‘read to learn’. The fact that almost 60% cannot learn through reading means that these children cannot really engage with the curriculum beyond grade 4. It really isn’t much more complicated than that

Reading for meaning and pleasure is, in my view, both the foundation and the pinnacle of the academic project in primary school. Receiving, interpreting, understanding, remembering, analyzing, evaluating and creating information, symbols, art, knowledge and stories encompasses pretty much all of schooling. Yet most kids in South Africa never get a firm hold on this first rung of the academic ladder. They are perpetually stumbling forward into new grades even as they fall further and further behind the curriculum.

Based on my reading of the academic literature – which may differ from others – there are three main reasons why the majority of kids don’t learn to read in lower primary school.

  1. Foundation Phase teachers (grades 1-3) do not know how to teach reading in a systematic way and pre- and in-service courses teaching this topic are unsystematic, inadequate or nonexistent.
  2. Text-poor environments; the School Monitoring Survey showed that half of schools in quintiles 1-3 (i.e. poorest 60%) had no school or classroom library or even a book corner. (Importantly, research has shown that even when there are libraries they are frequently mismanaged, have inappropriate materials and they are not integrated into reading lessons),
  3. Wasted learning time; A number of South African studies have aimed to measure opportunity-to-learn and have frequently found that less than half of the official curriculum is being covered in the year and fewer than half of the officially scheduled lessons are actually taught. In one study in the North West Grade 6 teachers only taught 40% of scheduled lessons for the year (compared to 60% among schools across the border in Botswana). It is not clear what was happening on the days where there was evidence of teaching or learning.

For me the solution is simple: we need to address these three problems: (1) decide how to teach existing and prospective teachers how to teach reading (as is done all over the world in contexts as linguistically and socioeconomically complex as our own), (2) ensure that all primary schools have a bare minimum number of books and that these are managed effectively, (3) monitor how often teachers are actually teaching and introduce meaningful training first and real consequences second for those teachers who are currently not teaching.

We may not have consensus on how to create jobs or increase growth, but there is consensus on how to teach children to read: with knowledgable teachers who have books and provide their students with enough opportunity to learn. If you want to improve matric, you need to start with reading. It’s not rocket science.

*This article first appeared in The Star on Tuesday the 29th of March 

**Image from here

Afrikaans universities perpetuate racial divisions (our M&G article)

black and white

[Image: Norman Akcroyd]

[This article first appeared in the Mail & Guardian on the 4th of March 2016]

Afrikaans universities perpetuate racial divisions – Nic Spaull & Debra Shepherd

In the last 2 weeks we have seen a number of protests erupt at former Afrikaans-only universities, specifically at the University of Pretoria and the University of the Free State. The reasons for the protests were numerous and included workers’ wages, accommodation, fees and the use of Afrikaans as a medium of instruction. At Stellenbosch University, a court case between AfriForum and the University was settled out of court last month and seemed to involve a reversal from the position of making English the primary medium of instruction at the University and instead giving English and Afrikaans equal status. For too long the issue of language in education has been dominated by ideological viewpoints that have little appreciation for, or understanding of, the empirical reality in South Africa. Of course language is inherently political – dealing as it does with issues of power, culture and identity – but those promoting or opposing a particular view need to show how those views square up with the linguistic, historical and socioeconomic context that we find ourselves in. Our aim here is to put some empirical evidence on the table so that we can move away from the anecdotes and ideologies that are currently driving policy and public-perception.

For over 50 years the apartheid government nurtured and resourced White-only schools and universities – both English and Afrikaans – while systematically under-resourcing institutions serving Black students. At the height of apartheid, the government allocated the same amount of resources to one White student at school as it did to 10 Black students at school. Even at the end of apartheid the average White child was receiving three and a half times as many resources from the government as the average Black child in one of the homelands. This legacy lives on in the post-apartheid period with ‘ex-Model-C’ schools continuing to be well-resourced as a result of the inertia of institutional functionality and the on-going investment by parents (of all races) that can afford fees, bequests and donations. The same can be said for former-White-only universities.

At universities the three major barriers preventing Black students accessing high-quality institutions are fees, language and weak academic results (from attending dysfunctional schools). The evidence of financial exclusion and financial inaccessibility is now well known. A research note published by our colleagues earlier this year showed that the cost of a BA degree at Stellenbosch had increased 30% between 2006 and 2015 and now requires 44% of average adult income. However there is far less evidence on the table about how many students are excluded from Stellenbosch because of language.

Of those students who qualified with a bachelor’s pass in matric 2014, every single student in the country took either English Home Language or English Second Language. In contrast, 61% of matrics who qualified with a bachelor’s pass did not take any Afrikaans subjects, either as a Home Language or a Second Language. If one looks at Black African students only, then 86% took no Afrikaans at all. It is reasonable to assume that 86% of Black African students who qualify to go to university understand no Afrikaans at all. How then are these students meant to understand some of their university subjects in Afrikaans if they are accepted at our university?

Frequently these students are told “If you don’t speak Afrikaans then go to one of the English universities”, as if there were an abundance of high-functioning English universities. There are only a limited number of ‘first-choice’ universities, and Stellenbosch is one of them. Under apartheid Stellenbosch, like it’s English White-only counterparts, was heavily resourced for 50 years and cannot now be ‘claimed’ by only one group. Stellenbosch has some of the best facilities and the best faculty in the country and should be available to all students, not only those that understand Afrikaans.

It is an uncomfortable truth that not all of South Africa’s 26 universities were born equal or are equal today – much like the born-frees. In the recent QS University ranking Stellenbosch was ranked the second best university in South Africa (after the University of Cape Town). In contrast, during the last 5 years three South African universities were placed under administration due to gross maladministration and bankruptcy. Of course the QS Rankings (like any rankings) are always dodgy, but Stellenbosch remains in the top 5 universities in the country irrespective of the measure you choose; NRF rated professors, research output, PhD production, students’ ‘first-choice’ etc.

At Stellenbosch there still exist dual-medium English and Afrikaans classes where lecturers switch between the two languages as they teach, essentially excluding (or confusing) those students who do not understand Afrikaans. In some courses there are also interpretation services. (Importantly this is usually from Afrikaans to English, not the other way around). A common thread of student protests at Stellenbosch has been that the interpretation services – referred to as ‘ghost whisperers’ – are inadequate, frustrating and create second-class students in the lecture hall. Having a mediated, second-hand learning experience is extremely frustrating and alienating. The issue of ‘separate’ English/Afrikaans classes and separate residence allocation based on language (which is against policy) is also highly problematic. It often leads to White-only Afrikaans classes or accommodation, which exists alongside mixed English classes and accommodation. How does this lead to integration and mutual understanding?

In a multilingual country like South Africa the ideal would be the development and use of all languages to the exclusion of none. The thing is, we have 11. This is simply not feasible in the short or even medium term. It is our view that in the balancing act between the right to access a historically well-resourced and currently highly-functional university; and the (qualified) right to learn in a home language, the former outweighs the latter. 100% of students that qualify for university do understand English while only 40% understand Afrikaans. Among Black African students, only 14% of those who qualify for university took any Afrikaans at school. We cannot see how excluding 86% of Black students from accessing Stellenbosch University is fair given our apartheid history, or how the University will become more representative of the country without transforming its language policy. In our view, ensuring that all courses are offered in at least English (without translation) is the least bad alternative of those available. It is not the responsibility of public universities to protect and defend any one language or culture. This is especially so when the patterns of historical and current privilege and exclusion are essentially one and the same.

Nic Spaull & Debra Shepherd are researchers in the Economics Department at Stellenbosch University.

Matric 2015 standardisation matters

denial

OK so I got a little frustrated with explaining the whole matric standardisation vibe to a million people, so here’s the deal once and for all…

Soon after the matric results jamboree ended and people went back to work, there were a few unanswered questions about how the matric exams of 2015 were standardised by Umalusi. Already in September of 2015 I was asking some Departmental officials whether the Minister was going to report the matric results of progressed and non-progressed learners separately (which is what I would’ve done). The logic being that the public (wrongly) view the matric exam as the main indicator of the health of the education system and that if progressed learners were lumped with non-progressed learners there would be excess pressure to ensure that the matric pass rate did not drop too much. But this is not the approach that the DBE took. I also emailed someone in Umalusi to ask how they were planning on doing their standardisation given that the two groups of matrics (2014 and 2015) were so different, with the latter having many more students due to the progressed learner policy.

After comparing the publicly-available Umalusi statement and the publicly available DBE NSC Technical Report 2015 it became possible to see how large the Umalusi adjustments were this for 2014 and 2015 for nine subjects – see table below.

Screen Shot 2016-01-24 at 1.27.52 PM

I won’t rehash my full argument here (if you’re interested read my article Matric Cracks Starting to Show). The yellow highlighted subjects are those that had big jumps in enrolments, for example there were an extra 76,791 learners taking maths-literacy in 2015 compared to 2014. Notice that the pass rates increased substantially between the raw pass rate and the pass rate after (1) Umalusi adjustment, (2) language compensation, (3) school-based assessment. The gist of that article was to say that the progressed learners of 2015 were not properly accounted for in the Umalusi standardisation process and that the most logical reason for a drop in performance of the raw marks was the inclusion of extra (weaker) learners, i.e. progressed learners, rather than a much more difficult exam.

bother

Subsequent to my article, the CEO of Umalusi, Dr Rakometsi, wrote a reply titled “Promoted pupils had no big effect on matric rates” and clarified a number of issues. For the sake of brevity I will summarize the most salient points here:

  • Umalusi was told by the DBE that there were only 66,088 progressed learners
  • If one excludes these 66,088 progressed learners then the failure rate within subjects increased by between 1% and 4%.
  • He confirmed that “the pass rate on raw marks is at 38% for maths-literacy
  • The maximum adjustment that Umalusi can make is 10 percentage points which was applied for mathematics literacy “because the paper turned out to be more difficult in 2015 compared to previous years. As a results of this maximum adjustment, 27% of learners who scored between 20-29% obtained a pass”
  • One paragraph in the article is particularly important and so I quote it verbatim:

“The report indicates that the impact of progressed learners to the individual subjects was minimal. As a result, there was no basis to standardise the results of the progressed learners separately. What we call progressed learners is actually only the KNOWN progressed learners. The argument that there were more is an assumption. Umalusi can only work on the information before it, not on assumptions and extrapolations.”

From the above we can draw two important conclusions:

(1) The 66,088 progressed learners were not excluded when the results were standardised relative to earlier years, despite knowing that these learners were weaker students. This seems totally bizarre. We know that these are weaker learners, why would we include them in the norm-referencing curve and compare to earlier years were these students did not exist? Even if they only contributed to a drop in the pass rate of between 1-4% why were they excluded?

2) (the most important conclusion) Umalusi only looked at the 66,088 “officially” progressed learners and ignored all the other information suggesting that there might be additional weaker learners who were actually progressed learners but were not captured as progressed learners, what I called “quasi-progressed” learners in my article. We know that provinces are not recording who is a progressed learner with the same accuracy.

Perhaps the most telling evidence is just to ask how many extra matrics there were in 2015 compared to 2014? The answer is 111,676 (644,536 in 2015 compared to 532,860 in 2014). But if there were only 66,088 progressed learners, where did the remaining 45,588 learners come from?

dissolve

Some have suggested that it’s from a change of age policy that happened in 1998, but that lead to a small cohort in 2011/2012 not now, as Stephen Taylor has shown using EMIS data. The table below (taken from here) shows the different enrolment numbers by year and grade. What we can see is that the matric class of 2011 was always going to be small  If we look at the matric class of 2011 there were 534,498 learners in matric and only 930,019 learners in grade 8 four years earlier. Basically we knew that the matric class of 2011 was going to be smaller. Whereas if we look at the matric class of 2015 (with 687,230 learners according to this table) this is unexplainably big. If we look at the grade 8 cohort of 2011 we see that there were 1,008,110 which is only about 7000 learners more than the grade 8 class of 2010. So how are we to explain the massive difference we see when we compare the 2014 and 2015 matrics (111,676)?

Screen Shot 2016-01-24 at 2.04.53 PM

In my mind the answer is straight-forward – the extra learners in matric 2015 are the direct result of trying to decrease grade repetition by “promoting” weaker learners into higher grades rather than fail them. If this is correct then we needed to exclude the full 111,676 learners when standardising relative to earlier years. Umalusi will (and has) argued that this was not possible and that they did not even try to take into account of quasi-progressed learners.

head banging

So those of you that’ve read this far might be asking “So who cares? Why is this even important?” and the answer is that it matters a lot for universities and the labour-market if Umalusi gets this wrong.  If the standardisation process assumed that a drop in the raw marks was only due to an increase in test difficulty (which is what Umalusi did) when a more plausible explanation was that it was because we included an extra 21% of weaker learners, then the real value (and signal) of a basic matric is actually declining over time.

On page 171 of the 2014 Ministerial Task Team Review of the NSC we read the specifications of when Umalusi can and cannot adjust matric marks:

“Reasons for differences may include: cohort differences, changes in curriculum, changes in setters of the examination papers, disruptions in the schooling processes and security leakages. In the absence of evidence of such possible reasons, it is then generally accepted that the differences are due to deviations in the standards of the examination or marking and therefore marks are adjusted to compensate for the deviations (Umalusi 2007a, 29).” [emphasis added]

Personally I do think that some of these tests increased in difficulty, but it is ludicrous to think that adding 21% more students who are KNOWN to be weaker students would not decrease the marks. Also this is the first year where basically all adjustments were upward. There was not a single downward adjustment. Coincidence much?

thats messed up

Just because Umalusi could not identify the quasi-progressed learners doesn’t mean they can just ignore them. Hence the cartoon above. It would seem that Umalusi has essentially said “Yes we can see that the cohort is much bigger. Yes we can see that there was a clear policy intervention to progress weaker learners. Yes we can see that the official numbers of progressed learners do not match with the full increase in the size of the cohort. But we are going to pretend that there were only 66,088 progressed learners. We refuse to accept any other reality because we can’t do anything about it anyway so what’s the use in knowing.

The fact that the marks were pushed up primarily at the bottom (probably too much) means that students passed in 2015 who would not have passed in 2012. It means students have qualified to study basic degrees in 2015 who would not have qualified if they wrote in 2012. So, if I’m right, any of the following could result:

  • There will be a flood of applications for degrees and diploma’s that require the lowest levels of matric points. Thousands more students will have ‘met the criteria’ and the universities would not have not anticipated this. In fact I have already heard that UNISA has had an unprecedented increase in applications, Edgewood at UKZN has been swamped. Damelin has a huge spike in applications. If I’m right then these students should never have qualified for university and will fail. They might incur debt, move province, make life decisions based on incorrect signal. (Let us not speculate on how the surge in applications for NSFAS will stoke the FeesMustFall fire and mean that there is less to go around and more angry students with hopes and dreams that the State cannot fulfil.
  • Universities will see students that are not even remotely prepared for higher academic study and will have to increase their access programs and expect higher failure rates.
  • As a result of the above the universities will increase the matric-point requirements for entry into their programs for 2017 (particularly programs like B.A, B.Soc-Sci, B.Ed etc.). They will also start to rely more on the National Benchmarking Tests in their selection criteria. [Sidebar, researchers should compare NBT results with matric results in 2013, 2014 and 2015 to see if there are any differences that might be attributable to wrongly-boosted matric marks]. 
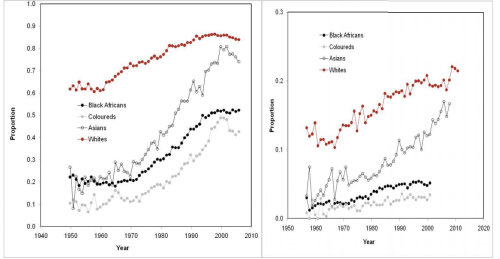
  • The gap between the earnings of those with a matric and those with a matric+degree will grow (note it is already large, see graph below). This is largely because the adjustment was primarily at the bottom meaning there are many more students with a low-level-matric who have, in effect, lower levels of knowledge and skill than low-level-matrics of 5 years ago.

Screen Shot 2016-01-24 at 2.30.15 PM

(Source: Hendrik van Broekhuizen, 2013, here)

As I said, none of the above precludes the fact that the tests were more difficult in 2015 (although this is still speculation). I am only saying that there is no way in my mind that including an extra hundred thousand weaker learners didn’t play any part in the drop in the raw marks. And, in essence, that is what Umalusi is arguing.

oprah no

Dr Rakometsi and I will be discussing this on the Redi Hlabi show at 10am tomorrow (25 Jan 2016). It should be an interesting discussion 🙂

redi-tlhabi_detail.jpg

“Matric Cracks Starting to Show” – my ST article

crack

(The article below first appeared in the Sunday Times on the 10th of January 2016)

Like so many things in South Africa, this year’s matric results are a paradox of good policies badly implemented. This time it was the Minister’s bold ‘promotion policy’ that led to an extra 21% more learners writing matric (644,536 this year compared to 532,860 last year). The policy limits the number of times learners can repeat a grade to once every three years and means fewer students drop out, being ‘promoted’ instead. While her decisive action has led to increased efficiency and improved access, it has also inadvertently caused a huge crack in the matric standardisation process, one that is only now starting to become apparent. The fact that the Department did not properly identify all progressed learners, and that Umalusi did not (and perhaps could not) take account of all progressed learners in their standardisation process calls into question the massive upward adjustments in marks that took place behind the scenes.

As usual, some commentators have myopically focussed on the drop in the matric pass rate, from 76% (2014) to 71% (2015) as if this, in and of itself, were a meaningful indication of anything. It isn’t. Or that it signalled a decline in quality, or harder exams. It doesn’t. Yes, the matric pass rate went down but the number of learners passing it went up. And in fact the real question might not be why the matric pass rate dropped, but why it didn’t drop further. In comparing the media statement from Umalusi and the technical report from the Department, the answer is quite clear. The decision was made to raise the raw marks across the board, from Maths and Physical Science to Life Science, Maths Literacy, History, Accounting, Geography and 24 other subjects. Umalusi themselves make a point of emphasizing that this was an “unprecedented set of adjustments”. When the Maths Literacy pass rate is adjusted from 38% to the final (and publicly reported) 71%, this is most certainly unprecedented, and I would argue, unwarranted. Was the test really so much more difficult than previous years? (This is the only reason why one is allowed to adjust the marks at all). Why did the internal and external moderators not pick up the huge increase in difficulty? Is it not more plausible that the massive drop in pre-adjusted performance was actually due to the additional 112,000 weaker learners who would’ve otherwise dropped out? If so, Umalusi shouldn’t have adjusted.

This is not to say that the Minister was wrong in introducing the promotion policy. Quite the opposite; she was heeding local and international research which shows that excessive repetition is costly, inefficient and has no educational benefit to the learner. Yes, we do need to find ways of preventing and remediating the problem, but rooting out wasteful repetition in the mean time is prudent and wise. A positive effect of this policy and the extra-large class of 2015 meant many more learners taking and passing key subjects, with about 52,000 extra matric passes, 9000 extra maths passes and 15,500 extra bachelor passes.

Both Umalusi and the Department claim that there were only 65,671 progressed learners. Yet there were an extra 111,676 matrics this year. So where did the other 46,005 extra learners come from? The clear answer is that there was a big policy change preventing schools failing learners multiple times and encouraging them to promote weak learners and push them into matric. Secondly, the way provinces record and report who is a progressed learner is highly dubious and varies by province and district. So, although we have approximately 66,000 ‘officially’ progressed learners, we also have 46,000 ‘quasi-progressed’ learners (what Umalusi calls ‘borderline candidates’).

The reason why all of this matters is because it influences the decision of whether to adjust the matric results and by how much. Umalusi is only ever meant to adjust the marks up or down if they believe the exam was harder or easier than previous years. The core assumption in this standardisation process is that the different matric cohorts (2013, 2014 or 2015 matrics) are of equal ability. Thus, any differences between the years can only be because the paper was easier or harder. And this is where the crack emerges. There is simply no way that the 2015 distribution of 645,000 matrics (including progressed and quasi-progressed learners) are as strong as the distribution of 533,000 learners in 2014. Thus the reason the 2015 cohort did so much worse on the raw scores was because of the extra 112,000 weaker learners, not because the tests were harder. We know that Umalusi did not take this into account because there is no way of identifying the 46,000 quasi-progressed learners. In Umalusi’s defence they couldn’t have excluded them even if they had wanted to because provinces didn’t record them. But it doesn’t seem Umalusi excluded these 112,000 (or even the 66,000) learners when they standardised the 2014 and 2015 distributions. This is illogical.

In an unusual change from previous media statements, this year Umalusi included the raw failure rates of subjects (i.e. before any adjustments). This can be compared to the marks in the technical report issued by the Department. The only difference between the two figures are the Umalusi adjustment, a small change due to school based assessments and a small language compensation for second language learners (extra 4 percentage points). When I refer to ‘raw’ and ‘final-adjusted’ pass rates I mean before and after these are accounted for. The three subjects I will focus on here are Maths Literacy, Geography and Business Studies since they all have big increases in enrolments which suggests these were the subjects taken by the progressed and quasi-progressed learners. The differences between the raw pass rate and the final-adjusted pass rate are large for Geography (increased from 66% to 77%), for Business Studies (increased from 54% to 76%) and especially for Maths Literacy (from a shockingly low 38% to 71% after adjustments!). For a national assessment these are incredibly large adjustments.

This could only be justified if the 2015 exams were extraordinarily more difficult in 2015 than in 2014. I simply do not buy it. The internal and external moderators all agreed that these exams were set at the appropriate level. To warrant adjustments of this magnitude they would have had to have been way out in their judgements. Why are we looking for alternative explanations for the big drop in raw marks when this one is staring us in the face? The most logical and obvious reason for the drop is the inclusion of an extra 112,000 weaker learners in 2015. Paper difficulty is marginal by comparison. In maths literacy alone there were 76,791 extra candidates in 2015. Where did these learners come from? It is clear that these are the weaker progressed and borderline candidates and that they are the main reason why the raw marks dropped so much. If so then we cannot just adjust the raw marks upwards, as was done this year.

The Umalusi standardisation process is necessary and probably the best we can do when different papers are written year-on-year, but Umalusi needs to clarify what happened here and in future be more transparent in their standardisation process. Unfortunately, no amount of standardisation can solve the biggest problem in our education system which is the fact that most children attending the poorest 75% of schools do not learn to read for meaning by the end of grade three and are forever behind. Indeed, matric starts in grade 1.

Dr Nic Spaull is an education economist at Stellenbosch University. He can be found on Twitter @NicSpaull and his work can be found at nicspaull.com

“Early action key to improving maths” – my Business Day article

Teacher+January+28+2014

(The article below appeared in the Business Day on the 6th of July 2015.)

Early action key to improving maths” – Dr Nic Spaull

When people speak about the economic importance of maths and science my mind does not immediately jump to technological innovations such as Google, Tesla or SpaceX — all of which are impossible without the mathematical and scientific insight of their founders and engineers.

I am instead reminded of a tenacious African woman, who my good friend and colleague, Prof Veronica McKay, told me about a few years ago. McKay was assigned the mammoth task of developing a government adult education programme (Kha Ri Gude) for those excluded from education under apartheid, especially the illiterate and innumerate among them.

Asked why she had attended the six-month course, one of the participants replied: “Because I wanted to know how to count. I wanted to know when I have enough money to buy things at the shop. Before, I just had to hold out my hand with my money and the man at the shop would take the money and give me back the change. I don’t think he was giving me the right change, but now I can tell.”

SA aspires to much more than basic financial literacy, and the lofty curriculum and policy documents are testament to this.

There are many improvements in education for which the government does not get enough credit. It has implemented a good curriculum, rolled out workbooks and textbooks to almost all students, and launched annual national assessments that will one day provide the kind of useful information we need.

It also provides school meals to more than 8-million pupils every single day. This is no small feat.

Unfortunately, the major failure has been in meaningful teacher development where little has been done. This helps explain the current reality where the vast majority of pupils still do not acquire even minimal competencies in maths and science during their school years.

The most recent reliable international assessment, the Trends in International Maths and Science Study (TIMSS), tested our Grade 9 students on the international Grade 8 test.

To those outside of academia, it is difficult to convey how abysmally low SA’s average TIMSS maths (352) and science (332) scores really are.

They mean that three-quarters (76%) of Grade 9 pupils in 2011 still had not acquired a basic understanding of whole numbers, decimals, operations or basic graphs and could not recognise basic facts from the life and physical sciences.

Here are some example questions from the test to help illustrate the problem:

  • “Kim is packing eggs into boxes. Each box holds six eggs. She has 94 eggs. What is the smallest number of boxes she needs to pack all the eggs?”

Only 12% of South African Grade 9 students could answer this. The results are poor even in the best-performing province, the Western Cape, which scored 20% on this question, and in the wealthiest 20% of schools where 33% could answer it correctly.

  • “The fractions 4/14 and q/21 are equivalent. What is the value of q?” Only 33% of our Grade 9 students can answer this correctly.
  • Only 61% of Grade 9 students knew that 3/5 is equal to 0.6. This was the easiest question in the test and is covered in the Grade 6 curriculum.

Research that I and others have conducted shows that about 80% of our Grade 9 pupils are achieving at a Grade 5 level in mathematics and that the backlog starts in Grades 1 to 3.

My best reading of the research base in mathematics in SA leads me to conclude that it is ludicrous to focus our efforts on interventions in Grades 9 to 12, when it is clear these learning deficits are already present in Grade 3 — where less than one third of students can calculate a Grade 3-level problem such as “270 + 28 = __”.

Half of Grade 5 students cannot calculate “24 ÷ 3 = ___”.

It is near impossible to remediate four years of backlogs in one or two years. We need to focus on improving the quality of teaching and teacher training in primary schools. The later in life we try to repair early deficits, the costlier the remediation becomes.

//