Monthly Archives: May 2021

Hunger in SA

Food crisis: 2.5 million South Africans experience hunger ‘every day’

– Nic Spaull & Mark Tomlinson

As many as 10 million adults and nearly three million children experienced hunger in the past week in South Africa in 2021, and 2.5 million adults and 600,000 children were experiencing perpetual hunger, hunger every day or almost every day.

When people are asked the question, “What does it mean to live in poverty?” you get a whole variety of answers. Some people talk about a lack of income to buy what they need, others talk about a lack of shelter or the absence of choices. These are all quite difficult things to nail down. How much income is “enough”? What is ‘adequate’ when it comes to housing? How do you define ‘agency’? However, there is one universally accepted and universally understood measure of extreme poverty, and that is hunger. If you crave food but have no means of getting it (involuntary hunger) you are living in extreme poverty.

Apart from the obvious anguish and discomfort of experiencing hunger, there are many reasons why hunger is bad. Those who are perpetually hungry are more likely to be depressed, to experience anger and be less able to parent well or work effectively. We also know that the scourge of hunger is detrimental to children, and especially so to infants and pregnant or nursing mothers. Children that experience chronic undernutrition are more likely to be stunted which has profound implications for their being able to cope in school and engage in meaningful employment across the life course. There is increasing evidence that caregivers who are hungry are more likely to experience mental health difficulties, which in turn may impact on the development of their children. Compared to those who are not hungry, preschool children that are hungry will experience higher levels of chronic illness and are more likely to be shy and withdrawn when interacting with their friends.  Sadly, we also know that the parents and caregivers often report feelings of shame about the hunger of their children, further worsening their mental state.   

Exactly how bad were hunger and malnutrition before the pandemic?

South Africa is in the fortunate position to have up to date and reliable data on the extent of hunger in the country, both before the pandemic and now. Before the pandemic there were numerous household surveys estimating rates of hunger, stunting and malnutrition. The General Household Survey (GHS) administered annually since 2000 shows the percentage of households who report child hunger because there wasn’t enough food in the past 12 months. (Note this is an annual figure). Encouragingly this rate of child hunger has halved in the last two decades. Between 2000 and 2018, the rate of child hunger among households with children in them declined from 35% to 16%, largely attributed to the successful roll-out of the Child Support Grant and improving economic conditions over this period. However, hunger is only one measure of malnutrition. One might have food to eat, and therefore not be hungry, but the quality of that food may be poor. Meals composed primarily of processed carbohydrates are far less nutritious than those that include protein, vegetables and healthy fats. We know from research that inadequate diets like this lead to stunting as well as poor attention which impacts on schooling.  

In a paper published this year Professor Servaas van der Berg and his co-authors show that before the pandemic child hunger had declined significantly but stunting had not. In 1995 approximately 30% of children under 5 were stunted in South Africa, but by 2017 this figure was still 27%. UNICEF estimates  that in many other middle-income countries like Brazil, Iran, and China the prevalence of stunting is much lower at 5 or 6%. As van der Berg concludes “It would seem that the improvement in people’s economic circumstances, induced by the Child Support Grant, was not enough to translate into consuming more nutritious food, rather than consuming more food.”

How has hunger changed during the pandemic?

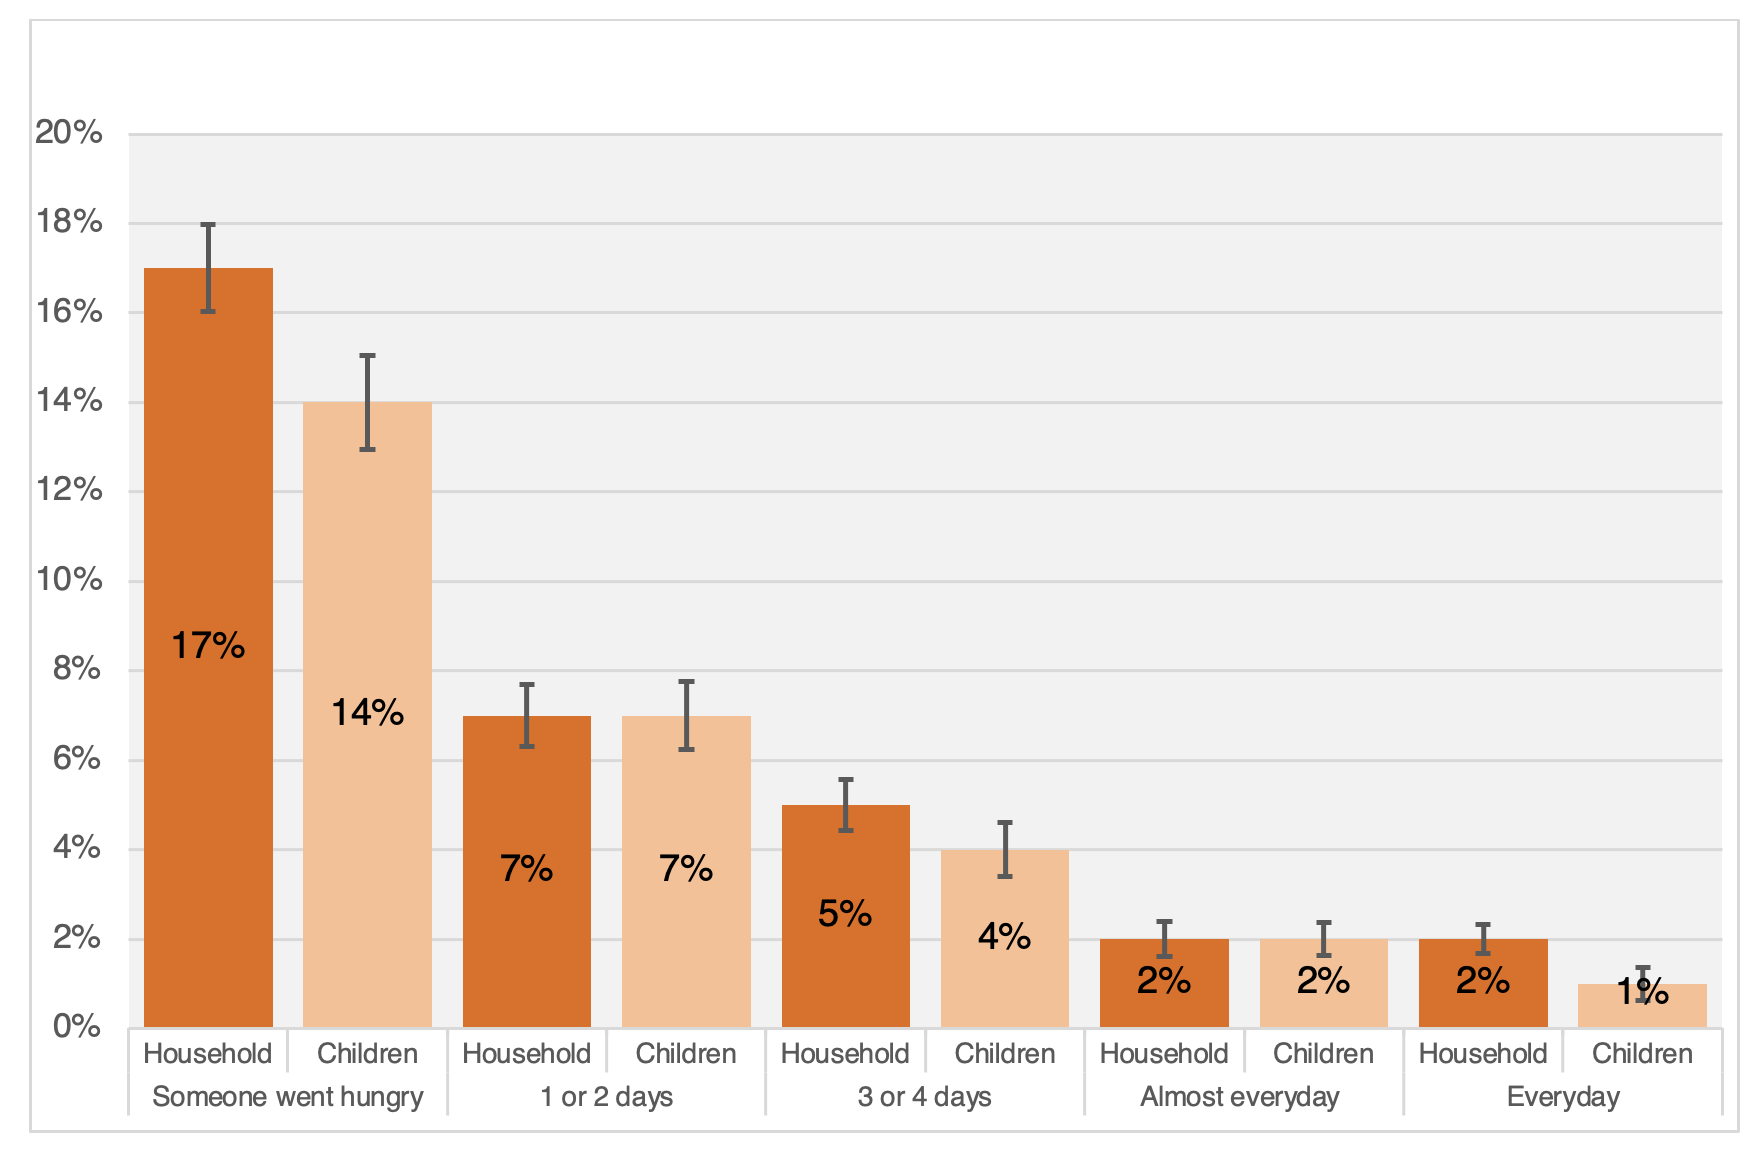
The National Income Dynamics Study Coronavirus Rapid Mobile Survey (NIDS-CRAM) has collected data on a broadly nationally representative sample of South African households covering the period from May 2020 to March 2021. It showed that there was a huge spike in reported household hunger in May and June 2020 following the hard-lockdown, with one in four South African households (23%) reporting hunger in the previous week. This has subsequently come down, but seems to have settled at a somewhat lower (but still very high) level of 16-17% of households. The NIDS-CRAM survey has asked households three questions related to hunger: (1) whether they ran out of money to buy food in the last month, (2) whether anyone in the household experienced hunger in the last week, and (3) if there were children in the household, did a child experience hunger in the last week. If anyone experienced hunger in the last week the respondent was asked a follow-up question about how often they had gone hungry (Never, 1 or 2 days, 3 or 4 days, Almost every day, Every day). The most recent data reports on hunger in February and March this year (2021). Van der Berg and his co-authors find that 14% of respondents who live with children said that a child had gone hungry in the past seven days, and 3% said that a child had gone hungry ‘every day’ or ‘almost every day’. Given that this represents extreme deprivation, this is extraordinarily high. By contrast, in 2019 the GHS shows that 15% of households reported a child had gone hungry at least once in the last year.

Figure 1: Reported hunger in the last 7 days (asked separately for “anyone in the household” and “children”) Source: Grace Bridgman’s analysis of NIDS-CRAM Wave 4 (February/March 2021).

But what do those numbers actually mean?

Statistics South Africa estimates that there are approximately 20-million children aged 0-17 years in South Africa. If for a moment we assume that children are equally distributed across households with children in them (a conservative assumption), this would mean that 2,8-million children experienced hunger weekly in South Africa in 2021 and 600,000 children experienced perpetual hunger (i.e. hunger every day or almost every day). Applying a similar approach to the rates of hunger across households, of the 60-million South Africans 10,2-million (17%) experienced hunger in the last week, and approximately 2,4-million (4%) experienced perpetual hunger (every day or almost every day). Clearly, we are not doing enough to alleviate this extreme form of suffering and deprivation.    

The NIDS-CRAM data also allows us to see how households have fallen into and out of food insecurity over the last year. Because we have conducted the survey four times and returned to the same person each time, we can see how their responses change over time. The four time periods cover the months of May/June, July/August and November/December in 2020 and February/March in 2021. The graph below shows that among households with children in them, one third (32%) reported that a child went hungry in the past week in at least one of these four waves of the survey, and 72% of respondents said that their household had run out of money to buy food in at least one of the four waves. Therefore, the “once-off” rates of child hunger and household hunger underestimate the extent of hunger in the country since many households are falling in and out of food insecurity on a regular basis.

Figure 2: Prevalence of running out of money to buy food, weekly household hunger and weekly child hunger in South Africa reported over the four waves of NIDS-CRAM 2020/2021 (all households with children in them). (Source: Shepherd et al, 2021: p.17)

When we think about these disturbingly high rates of child hunger and household food insecurity, we must ask ourselves how is it that we are willing to accept this gross assault on the dignity and humanity of children and adults? Is this the type of country that we want?

South Africa is arguably the most prosperous and modern country on our continent. It has the most sophisticated financial system, the best universities, an independent media, and a highly functional tax collection agency. Yet it also has 10-million people experiencing hunger every week? The ANC claims that it is the only party that can eradicate poverty (Radebe, 2019) and it is true that it was the ANC that initiated and rapidly expanded the Child Support Grant of R440 per month – an incredibly effective, well-targeted grant that reaches 13-million children. It was largely responsible for the big decline in child hunger over the last two decades and is one of the biggest successes of post-apartheid South Africa. But clearly poverty and hunger persist. Why has progress stalled? While economic growth is the long-term solution to poverty eradication, we simply cannot wait for economic growth before addressing the hunger crisis that is clearly all around us. If the government is serious about hunger, and protecting the dignity of the poor, the status quo is not enough.

Hunger is universally condemned across the political spectrum. Those who oppose additional measures to address hunger should be shamed on moral grounds and a lack of conscience. If the ANC is serious about eradicating hunger in this decade then it must announce new and bigger policies to radically address the hunger crisis.  This is a crisis, and one that existed before the pandemic. If bold action is not taken the generational impact will be profound.

//

This article first appeared in the Daily Maverick on the 27th of May 2021.

On a similar topic, Mark and I, together with Xanthe Hunt (SU) and Dan Stein (UCT) wrote an editorial for the latest edition of the South African Medical Journal (SAMJ) titled “Hunger as a driver of depressive symptoms: Optimising responses to mental health aspects of the COVID-19 pandemic

“Vaccine war effort needed” (My FM article on vaccines and learning losses)

SA is in flux: we’re waiting for what we know we need, even as we gird ourselves for disappointment. We’re waiting for an uptick in the economy; waiting for jobs; waiting for the ANC to sort out who is suspending who — but most of all, we’re waiting for vaccines.

The latest results of our National Income Dynamics Study — Coronavirus Rapid Mobile Survey (Nids-Cram), released this week, show that in February and March this year, the vast majority of South Africans (71%) said they would take the vaccine if they could. The problem is, there is none available.

By May 4, SA had vaccinated only 353,000 people. This is less than half those vaccinated in Kenya (853,000) or Ghana (850,000), and lower than in poorer countries like Senegal (417,000) or Zimbabwe (452,000). This picture is even more sobering if you consider the population size. Only 0.6% of SA has been vaccinated — less than Iraq (0.8%), Somalia (0.8%), Afghanistan (1%), and Libya (1.2%), and also less than the vaccination rate in 140 other countries.

Why is this? SA has the resources. It has the expertise. It has the health infrastructure. Instead, it would seem, there was a failure to strategically plan, and to hedge bets. Given the uncertainty around new vaccines, many countries sourced multiple types in the hope that at least one would work. SA came late to that party, then put all the eggs in the AstraZeneca basket — which proved less effective against the local variant. So here we are, back to square one.

Fingers crossed, May could be a turning point. Health minister Zweli Mkhize says SA will get 6-million Pfizer-BioNTech vaccines and 1-million Johnson & Johnson vaccines this month. And President Cyril Ramaphosa says the government has bought vaccines to cover more than 40-million people. All these vaccines, we are told, will arrive at some point in 2021. However, Ramaphosa hasn’t given specifics. So when those vaccines actually arrive, and how quickly they’re administered, remains to be seen. All while a third wave of Covid threatens to break.

Vaccine hesitancy

While SA has been preoccupied with supply problems (how to get more vaccines), it will, like other countries, soon confront a demand problem: how do we get people to take the jabs we do have? Today, the US has vaccinated about 150-million people (45% of its population), but the average number getting a first or single dose has fallen by nearly 50% since April 13.

That was the day that US health officials announced they would temporarily stop the rollout of the Johnson & Johnson (J&J) vaccine, because a tiny proportion of people getting the vaccine had developed blood clots.

This was a huge failure of judgment by the US — and by SA, which slavishly followed that approach. The US had other vaccines to offer, while SA simply paused its entire rollout without any other alternative. Among 7-million US adults vaccinated with the J&J jab, six people (0.00009%) developed blood clots. One died. Oxford researchers have shown that you are 8-10 times more likely to get a blood clot if you get Covid than from the vaccine, and 3,000-times more likely to get a blood clot from birth control pills (a 0.3% chance).

While regulators said they pressed pause due to “an abundance of caution”, it was a failure of judgment on multiple levels. SA (unlike the US) had no other vaccine at the time. The US stopped J&J, but continued with Pfizer and Moderna — but SA stopped rolling out the only vaccine it had. Apart from the fact that the mortality risk from Covid is orders of magnitude greater than the infinitesimal risk of blood clots, it means South Africans will have died unnecessarily due to that pause. But there is another more insidious cost: the increase in vaccine hesitancy, since people are now more wary of the vaccine.

Few genuinely understand that you are as likely to get struck by lightning (one chance in a million) as you are to get a blood clot from a vaccine. It’s not going to happen — but thousands of people who were on the fence may now opt against vaccination. The latest Nids-Cram (wave 4) results, released this week, shed light on whether these communication blunders are likely to have an impact on SA’s rollout. While the survey showed that 71% of South Africans are willing to get a vaccine (higher than many countries), the flip side is that nearly a third were vaccine hesitant. The three main reasons for hesitancy were: concern about side effects (31%); lack of belief in effectiveness (21%); or general lack of trust in vaccines (18%). To combat vaccine hesitancy, we need to know not only why people are hesitant, but also who they are.

This new data shows that those most at risk of Covid (the elderly and those with chronic conditions) are more willing to get the jab. By contrast, those least at risk — people aged between 18 and 25 — were less willing, with only 63% saying they would have a vaccination. This isn’t entirely surprising. As research has revealed elsewhere, those who trust social media as an information source (predominantly young people) were significantly more likely to be vaccine hesitant. One unexpected finding from the survey results was that a respondent’s home language was also a significant predictor of vaccine hesitancy, with 42% of Afrikaans home-language respondents being vaccine hesitant. This is higher than the national average of 29% and far higher than in people belonging to seven of the 11 language groups.

Though Nids-Cram is not provincially representative, in light of the predominance of Afrikaans in the Western Cape and Northern Cape, it accords with the finding that people from these provinces had higher vaccine hesitancy rates of 42% and 41%. More research is needed to understand this finding. But it is a key insight because vaccines are being rolled out provincially and the media that reaches them is predominantly segmented by language.

To what extent have the communication blunders affected these figures? It must be said that already in the Nids-Cram data in February and March, high rates of hesitancy were observed among certain groups — even before the temporary pause of the J&J rollout. However, this past weekend Gauteng premier David Makhura revealed that the J&J suspension did seem to be affecting vaccine registrations in his province. In the past three weeks, of the 1.3-million Gauteng residents older than 60, only 235,000 (18%) had registered to get a vaccine.

It shows there is no room for fuzzy messaging around the efficacy and safety of the jab, if we want a successful roll-out. But the bungle around the J&J vaccine points to what I believe is a bigger underlying problem: politicians are slavishly following the recommendations made by medical experts and trying to minimise deaths, rather than weighing up all sources of harm.  Mkhize’s Ministerial Advisory Committee (MAC) is currently made up of 51 doctors and medical academics, but not a single social scientist. Perhaps if there were people from the social sciences (like communications experts, economists and sociologists), the J&J debacle wouldn’t have happened.

Of course, it is a welcome change that the president and his health minister are listening to medical experts — a notable change from the Mbeki or Zuma eras, when Aids denialism was rampant — but we mustn’t fall off the horse on the other side. Medical experts are trained to measure medical risks, and make judgment calls about the efficacy of trials and rates of transmission. But a vaccinologist will be the first to admit he or she knows little of the non-medical risks like increasing unemployment, rising hunger, and growing learning losses. Measuring the social and economic costs of a nationwide lockdown isn’t part of a vaccinologist’s expertise. Instead, it is the politicians’ job to make the call as to what the right course of action is, when it comes to lockdowns, or opening schools.

Take schooling. Medical experts say the social distancing guideline to prevent the spread of Covid should be 1m-2m. Education officials reply that classrooms were not designed to have such large spaces between children — so if we need that distancing, we need “rotational timetables”, where only 50% of children can attend school on any one day. Last year, SA’s National Coronavirus Command Council accepted the experts’ distancing advice for schools without question, leading to rotational timetables in almost all no-fee schools, which make up more than 70% of the country’s schools. But how does one measure the costs of 5-million children not attending school on any one day for an entire year, or two?

Do the hypothesised benefits of limiting the spread of Covid justify these long-term costs to children? That’s not a decision for the medical experts, but for politicians — who are elected to use their judgment about what is in their population’s best interests, by weighing up the costs and benefits. Let’s consider these nonmedical costs.

Learning losses and school feeding

The rotational timetables that have been implemented in no-fee schools have created two major problems. The first is a loss of school days and learning; and the second is the loss of school meals, since poorer children generally don’t get meals on days they don’t go to school. The phased re-opening of public schools and implementation of rotation timetables means that in 2020, primary school learners lost 60% of a possible 198 school days.

For the first time since the pandemic started, we now also have data on learning outcomes for children affected by the pandemic. This makes it possible to estimate the true educational costs of lost schooling. In a paper published this week, Debra Shepherd and her co-authors examine these learning losses. This research was possible because the department of basic education, together with independent researchers, collected new data from two studies of 130 no-fee primary schools in Mpumalanga, and 57 no-fee primary schools in the Eastern Cape.

By comparing learning gains in 2020 against 2019, researchers estimated the impact of Covid and rotational timetables in no-fee schools in grade 2 and grade 4. The results confirm the worst fears: primary school children in these no-fee schools learnt 50%-75% less in 2020 than normal. Put differently, grade 4 learners in 2020 learnt a quarter of what their peers learnt in 2019.

This is all the more disturbing since education is a cumulative process, where subsequent learning depends on prior learning. Using that same data, we can compare the learning trajectories of children who were in grade 1 in 2019 and see how they fare in grade 2 in 2020. The graph shows how the learning trajectory of those children affected by school closures and rotational timetables flattened in 2020. The impact is likely to be felt for years to come, with some suggesting we will be able to get back to pre-pandemic learning outcomes only by 2030. 

And schools are about more than learning. In 2019 it was estimated that 9-million learners benefited from free school meals. The Nids-Cram survey asked respondents with children at school if their child had received a school meal in the previous seven days. For the dates that schools were open in February and March this year, less than half (43%) said their child had had a meal in the previous seven days. This suggests the feeding programme still hasn’t recovered — it is well below the pre-pandemic level of 65% in 2018 — and the main reason is the rotational timetable. Given the extraordinarily high costs that children are paying, educationally and nutritionally, because of rotational timetables, it is unsurprising that most parents and caregivers support the full re-opening of schools. In November 2020, Nids-Cram respondents with children in their households were asked: “Do you think children should be able to attend school every day?” In all, 58% answered yes. Given all the evidence, it’s unclear why SA still practises rotational timetables.

Risks to learners and teachers

At the start of the pandemic, when there was still so much uncertainty, closing schools was a rational and justified response. We didn’t know if children caught and spread the virus like adults, or if they were at severe risk from Covid.We know now. The risks to children of getting ill or dying from Covid are exceedingly low. To date, 194 children aged between five and 19 have died of Covid in SA — 0.4% of the total 51,527 deaths. For perspective, Stats SA estimates that of those aged between five and 19, about 12,870 die of “regular” causes in a given year. The issue, of course, is that it’s not only children who are at risk if schools increase transmission — there are also teachers and parents to consider.

Again, we have more evidence now than we had last year. In January, the National Institute for Communicable Diseases (NICD) released a report revealing “no consistent changes in incidence trends, associated with the timing of opening or closing of schools”.

But that’s for the general population — what about teachers specifically? In a report released this week, professor Martin Gustafsson analysed the department of basic education’s national teacher payroll database (Persal) for 2020, to calculate the number of excess teacher deaths from Covid compared to 2019. This is an incredibly accurate source of information on teacher mortality. When teachers die, they are removed from the payroll database. The analysis showed that these “excess deaths” map almost perfectly onto the first and second “waves” of the pandemic (see graph above), indicating they are almost certainly related to Covid. (The slight difference between the red and black lines is due to the delay in reporting national deaths since payroll data is less delayed.) Critically, however, this study reveals that there is no discernible relationship between teacher deaths and when schools are open.

Of the 401,327 teachers on the payroll, 1,678 are estimated to have died from Covid between the end of March 2020 and the end of February 2021. While tragic, it reveals that most “excess teacher deaths” occurred when schools were closed. We don’t see substantial excess deaths among teachers between September and November 2020 — when all grades were attending school. The SA Medical Research Council estimates that SA’s total excess deaths up to January 23 was 125,744. So, excess teacher deaths make up 1.3% of total excess deaths, with the other 98.7% coming from other fields of work and the unemployed. The analysis also shows that teachers at secondary schools are not at higher risk of Covid transmission than teachers at primary schools. This supports the claim that schools are not the main cause of Covid infection among teachers.

Vaccinate like our lives depend on it

According to Mkhize, SA will enter phase 2 of the vaccination strategy on May 17. The plan is to have 40-million people aged 18 years and older vaccinated by February 2022 — all using Johnson & Johnson and Pfizer-BioNTech vaccines.

To reach that goal, SA needs to administer 188,000 doses a day, every day, for the next 287 days. Yet in the past three months we administered only 353,000 shots. Granted, these were part of the Sisonke trial of health-care workers. But if you do the maths regarding the envisioned rollout rate, this would make SA the world leader in vaccine administration — faster than Chile, the UK or Israel, the three fastest countries to date.

The world leader, Chile, managed “only” 117,000 a day for 132 days. So SA — which now ranks 140th in the world in administering jabs — will have to vaccinate faster than the fastest countries in the world. Most experts I speak to know this is not possible, which is why the thinking has shifted from herd immunity to epidemic control. Covid, like the flu, will be with us for the foreseeable future, with top-up shots to protect against new variants.

The strategy will centre on vaccinating (and re-vaccinating) the elderly and those at high risk. This is still a mammoth task akin to the roll-out of antiretrovirals at the peak of the HIV/Aids epidemic. The government needs to vaccinate like our lives depend on it. But we also need to accept that we are entering a new normal where schools are fully open, and children and teachers wear masks. If we continue to deny children 50% of their education, we are moving closer to the reality of writing off a generation of children, the lost “Covid kids”.

The human and financial costs associated with lockdowns, and an uncontrolled pandemic, are thousands of times higher than any conceivable costs of getting and distributing vaccines. This is why every other country has thrown everything they have at this.

Less than a decade ago, SA went from the country with the highest uncontrolled spread of HIV in the world, to the country with the largest antiretroviral programme. It was thanks to a system-wide urgency, and partnerships between the government, the private sector and donors. And it was only possible because it was treated as a war effort, prioritised above all else.

This is what SA needs to do again.

//

This article was first published in the Financial Mail on the 12th of May 2021.

For the full NIDS-CRAM Wave 4 Synthesis Report see here. For the full list of papers see here:

NIDS-CRAM Wave 4 Synthesis Report

Today we launched Wave 4 of our National Income Dynamics Study Coronavirus Rapid Mobile Survey (NIDS-CRAM). Only one more to go! (Phew!) I presented what I think are the 13 main findings from the 11 Working Papers at the launch, I’ve summarised them below. These are a little better summarised in our Synthesis Report which I would encourage everyone to read (it’s only nine pages). To download the full papers on which the Synthesis Report is based (or to get the questionnaires, do-files or panel user manual) go to the NIDS-CRAM Website, and if you want to download the data head to DataFirst.

Key findings from Wave 4:

(1) VACCINES: 71% of South Africans say that they would get vaccinated if a COVID-19 vaccine were available

(2) VACCINES: Vaccine hesitancy is highest among youth, those who trust social media, Afrikaans-HL respondents, and those in WC+NC. 

(3) SCHOOL MEALS: Less than half (43%)of respondents with kids reported that their child had received a school meal in Feb/March 2021 while schools were open (pre-pandemic it was 65%)

(4) LEARNING LOSSES: Children in no-fee schools have learnt 50-75% less in 2020 compared to what they normally learn 

(5) LEARNING TRAJECTORIES: Due to school closures and rotational timetables (only 50% of kids can attend on any one day) we’re seeing the flattening of learning trajectories

(6) TEACHER MORTALITY: Tragically, teacher mortality went up in 2020, but analysis of teacher payroll data shows that excess deaths from COVID follow SA trends NOT school opening/closing. 

(7) TEACHER MORTALITY: Teachers at secondary schools are not at higher risk of COVID-19 transmission compared to those at primary schools. 

(8) HUNGER: Weekly child hunger has declined from 16% in Nov/Dec 2020 to 14% in Feb/March 2021, although it is still nearly double pre-pandemic levels (8%)

(9) HUNGER: NIDS-CRAM has been administered four times in the last year. Two thirds of respondents (67%) said that in at least one of these waves their household had run out of money to buy food in the last month.

(10 HUNGER: One third of respondents (32%) in households with children in them said that in at least one of these four waves, a child had gone hungry in the past week in their household 

(11) EMPLOYMENT: Between Oct’20 and Jan’21 the % of employed adults in the NIDS-CRAM cross-sectional sample declined from 55% to 53% 

(12) EMPLOYMENT: Between October 2020 & January 2021 1/5th of those who were employed lost their jobs and 1/5th of those who weren’t employed found work. 

(13) ECD: Temporary ECD programme closure remains the primary reason (26%) for non-attendance at ECD programmes, and attendance in 2021 (19%) is still well below pre-pandemic levels (38%)