Monthly Archives: January 2017

“Matric really does start in Gr1” – my M&G/Teacher article on TIMSS 2015

screen-shot-2017-01-31-at-7-05-23-am

(The article below first appeared in The Teacher magazine in January, and in the Mail & Guardian on the 27th of January 2017)

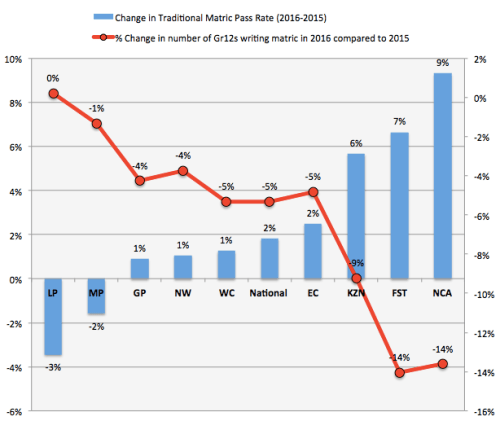
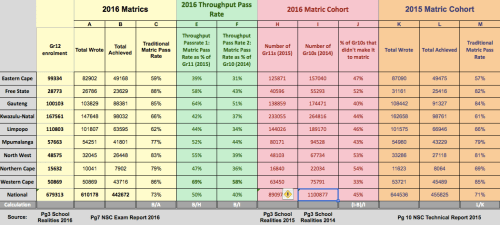
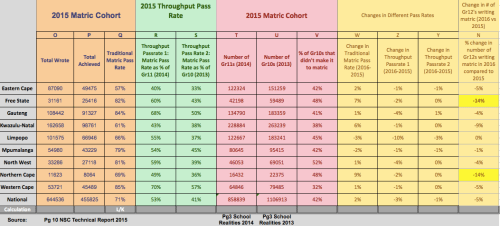
The month of January is an interesting one in the South African calendar. It seems that this is the one time in the year when everyone cares about education, or more accurately, cares about matric. And in some senses there is a good reason for this; matric is the gateway to higher education. If we look at 25-35 year olds in the 2011 Census data we see that for those with less than a matric, 47% were unemployed (using the broad definition), compared to 33% among those whose highest qualification was a matric and only 8% for those with a bachelors degree. While matric used to be the big distinguisher between the haves and have-nots, increasingly the difference is between those with some kind of tertiary qualification and everyone else. And in 2016, as usual, mathematics proved to be a tough gateway subject for those who want to study further. Only one in three learners who wrote Mathematics in 2016 got 40% or more in the subject, with a recent study showing that only about 15,000 matrics achieved 70% or more in mathematics. That’s about 1,5% of students who start school in Grade 1.

As anyone familiar with maths will tell you, the subject is a hierarchical one that builds upon itself. You need to understand multiplication and division before you can understand fractions or rate and proportion. So where do the wheels come off? Is it just before matric, perhaps in Grade 9 or 10? Or even earlier in Grade 4 or 5? To shed some light on this question we can turn to some recent mathematics research published by the Human Sciences Research Council (HSRC) at the end of last year. Every four years South Africa participates in an international study of mathematics achievement called the Trends in International Mathematics and Science Study or TIMSS. We test a nationally-representative sample of Grade 5 and Grade 9 learners on a standardised international test, which is the same test that is written by thousands of other students in other countries and allows us to compare ourselves to these other countries. (Although almost all the countries test their Grade 4 and Grade 8 students on these tests). The most recent round of tests was done in 2015.

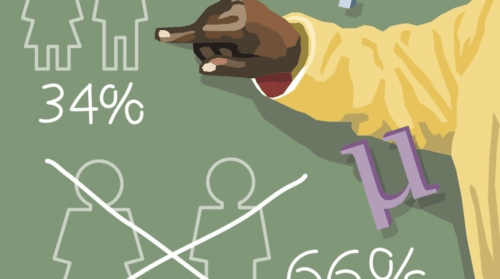
The results showed that only 34% of our Grade 9 learners could do basic mathematics, i.e. could reach the lowest international benchmark. That is to say that 66% of our learners could not do basic computations or match tables to bar graphs or read a simple line graph. They had not acquired a basic understanding about whole numbers, decimals, operations or basic graphs. However there was one piece of encouraging information that emerged from the study and that was that the number of students that could do basic mathematics increased from 24% in 2011 to 34% in 2015 in South Africa, one of the fastest improvements seen internationally.

But if 66% of our Grade 9 learners can’t do basic maths, when did these gaps emerge? In 2015, for the first time in our history, South Africa also participated in the primary-school level of TIMSS that usually tests Grade 4 learners – we tested our Grade 5 learners. It showed that 61% of Grade 5 learners could not reach the Low International Benchmark. Learners who do not reach the low international benchmark at the primary level cannot add and subtract three or four digit whole numbers like 218 and 191. They do not recognise familiar geometric shapes or parallel and perpendicular lines. They cannot read and complete simple bar graphs and tables. For example, according to our curriculum, multiplying a 3-digit number by a 1-digit number is meant to be covered in Term 1 of Grade 4 yet only 41% of our Grade 5 learners could calculate “512 x 3 =____”, which was one of the questions in 2015. So almost 60% of our Grade 5 learners are already significantly behind the curriculum in 2015.

The conclusion that the root of our problems is not in high school but rather much earlier, in the lower grades of primary school is not a new finding – there are many studies showing this from at least 1999. In a report published nearly 10 years ago, one South African education researcher (Dr Eric Scholar) analysed the mathematics achievement in 154 schools across the country. He concluded that the low levels of achievement we see in the higher grades are rooted in weak foundations in primary school. To quote his exact conclusion:

‘‘The fundamental cause of poor learner performance across our education system is a failure to extend the ability of learners from counting to true calculating in their primary schooling. All more complex mathematics depends, in the first instance, on an instinctive understanding of place value within the base-10 number system, combined with an ability to readily perform basic calculations and see numeric relationships … Learners are routinely promoted from one Grade to the next without having mastered the content and foundational competences of preceding Grades, resulting in a large cognitive backlog that progressively inhibits the acquisition of more complex competencies. The consequence is that every class has become, in effect, a ‘multi-Grade’ class in which there is a very large range of learner abilities and this makes it very difficult, or even impossible, to consistently teach to the required assessment standards for any particular Grade. Mathematics, however, is a hierarchical subject in which the development of increasingly complex cognitive abilities at each succeeding level is dependent on the progressive and cumulative mastery of its conceptual frameworks, starting with the absolutely fundamental basics of place value (the base-10 number system) and the four operations (calculation)’’

While as a country we continue to obsess about the matric pass rate, the research is really quite clear. The majority of our young people are acaquiring learning deficits early on in primary school and then carrying these with them as they move through school. As they are promoted into higher grades there is a decoupling between what learners know and can do and what the curriculum expects from them. We need to acknowledge that matric starts in Grade 1 (and even earlier), and that it really is possible to improve primary schooling if that is where we focus most of our time, energy and resources.

DBE needs you (2 vacancies)

we-need-you

My good friend and colleague Dr Stephen Taylor (who is the Director of Research in the National Department of Basic Education (DBE) in Pretoria) is looking for 2 people to join his team in the Research Monitoring and Evaluation unit. The full job advertisement is here and I’ve included screenshots of the relevant position below. I’ve done a Q&A with Stephen (and Martin Gustafsson who is also in DBE) to give you a flavour of the kind of people they are. I would whole-heartedly recommend Stephen as a boss and a person 🙂 they are creating a really impactful team (Janeli Kotze and Mpumi Mohohlwane have also recently been appointed there full-time). If you are looking for an excellent team, to have an impact in education and have good quantitative skills – apply! (Deadline 17 Feb).

screen-shot-2017-01-30-at-8-01-34-am

screen-shot-2017-01-30-at-8-01-43-am

PS I should totally get a finders fee for this kind of thing 🙂

Yale Young African Scholars Program 2017 (high-school students)

yyas-2017-flyer

If you know of any outstanding high-school students across the continent, this looks like a great opportunity to help prepare them for the US university admission and financial aid processes. Please forward it on to them. Deadline is the 31st of January 2017.

See excerpt from the email below

In 2016 YYAS brought 300 of Africa’s most talented high school students to programs in Rwanda, Ghana and Zimbabwe where they engaged in the sorts of robust intellectual exchanges that are crucial to understanding Africa’s most pressing challenges and exciting opportunities. With participants from over 20 countries across the continent, the students also gained exposure to the ideas and perspectives of a very diverse group of peers and took part in leadership skills development activities. Critically, however, the main focus of the YYAS program is to introduce the participants to U.S. universities’ admission and financial aid processes. Workshops led by Yale students as well as university admission representatives equipped YYAS participants with a thorough understanding of these processes, and we also offered standardized test preparation sessions plus ongoing mentorship that will see each student through his or her university application cycle.

I am very proud to be joining this exciting program and for the opportunity to help YYAS further its reach and scale across the continent. And I’m thrilled to announce that the 2017 YYAS program application is open! I hope you will share our promotional materials (see attachments) with secondary school students or organizations that work with secondary school students in Africa. Moreover, we do anticipate that many of our program’s alumni will apply to your university or programs in the near future. Please watch out for YYAS on their applications! We are certain that the academic standing and caliber of our alumni will make them excellent members of your community and hope that you will see YYAS as a stepping stone to great success in their university studies.


My M&G article on Universities in 2017

screen-shot-2017-01-08-at-1-10-29-pm

(The above article was published in the Mail & Guardian on the 6th of January 2016 and is available in PDF here).

Students contest the status quo 

Over the last two years, universities in South Africa have become increasingly contested spaces. Student movements like RhodesMustFall and FeesMustFall have categorically rejected the status quo as unacceptable and are working to reorder not only the principles that govern universities, but ultimately the principles that govern the country. Of course the first order of business is challenging our current assumptions about who should go to university, what it should look like, and who should pay for it. And on all three fronts they have been phenomenally successful. It is really quite remarkable that a loose group of students who lack a political mandate, who have not been elected by anyone, and have virtually no resources have managed to achieve so much so quickly. They have brought whole universities to their knees and prompted the creation of a Presidential Task Team. Most significantly they garnered enough support to essentially force the government to allocate an additional R17 billion to higher education in the Medium Term Budget.

About 200 years ago, Napoleon Bonaparte famously quipped that a revolution is simply an idea which has found its bayonets. In the context of the various student movements I think it’s worthwhile to try and identify the underlying idea, its animating principle. As the student movements assemble and reassemble under different names (seemingly quite effortlessly), I think there is a leitmotif running through all of them; the unfinished business of 1994. There is a generation of young Black South Africans who feel that the terms of the negotiated settlement were unjust and let White South Africans off the hook. Dr Amos Wilson. a theoretical psychologist and social theorist, makes the logic behind this position explicit in the following quote:

“Justice requires not only the ceasing and desisting of injustice but also requires either punishment or reparation for injuries and damages inflicted for prior wrongdoing. The essence of justice is the redistribution of gains earned through the perpetration of injustice. If restitution is not made and reparations not instituted to compensate for prior injustices, those injustices are in effect rewarded. And the benefits such rewards conferred on the perpetrators of injustice will continue to “draw interest,” to be reinvested, and to be passed on to their children, who will use their inherited advantages to continue to exploit the children of the victims of the injustice of their ancestors. Consequently, injustice and inequality will be maintained across generations as will their deleterious social, economic, and political outcomes.”

Thinking that the various incarnations of the student movements are primarily about universities is a mistake. RhodesMustfall was not about a statue; it was about reclamation and power and history. Similarly, the challenge today is not only about who should pay fees, but who should own the land. The discontent and anger about the ‘pay-to-play’ market system that we have – where only those who can pay for quality get it – is as much about private hospitals and Model-C schools as it is about universities. The true contested space at our universities at the moment is really about the principles that currently order our society and reimagining different ones.

Fighting for a different future

There are students in South Africa today who look at our country and refuse to accept that the way we are currently doing things is the only way they can be done. How is it that in a country with considerable wealth and resources that we still have 10 million people living on less than R10 a day? Whenever I land at Cape Town International Airport and get an aerial view of Khayelitsha, I think to myself “How the heck can we, as a country, not find a dignified solution to housing for the poor?” In Cape Town we have 400,000 people living in shacks a mere 40-minute drive from the house that sold for R290-million in Bantry Bay. We have decadent opulence living next to extreme poverty. It’s not right.

And so we come back to the contested space at universities where people have different ideas about how we get from where we are to a better future. Students associated with Black-First-Land-First argue for land expropriation without compensation. The Nobel Laureate Thomas Piketty motivates for much steeper wealth and inheritance taxes to level the playing field. The Wits SRC has proposed a once-off ‘apartheid windfall’ tax on “companies that benefited unfairly by abusing state resources” under apartheid.

But since the current discussions at universities are still centred on fees and access to university, let’s start there and think about what 2017 might hold for universities, and put some numbers on the table. Personally I think we will actually find a sustainable solution to student financing at universities, possibly even in 2017. Sizwe Nxasana – the head of the Presidential Task Team – has developed a highly sophisticated and workable model of student funding called the Ikusasa Student Financial Aid Programme (ISFAP) that is being trialled at seven universities this year, focussing on students studying medicine, engineering and accounting. This is essentially a public-private partnership which aims to “significantly increase the funding and resources which are made available to support students from working class families to graduate and find employment by leveraging private sector funding.” One can think of it as a three-tier model with the poorest students being fully funded with grants and the missing-middle with a combination of grants and income-contingent loans (to be repaid only if the recipient does graduate and earns above a certain amount). Then finally, those at the top that can pay fees do pay fees. While it isn’t free education for everyone – and the vanguard may therefore not accept it – if implemented properly it has a good shot at ensuring that no student is excluded from university on financial grounds. That would be a significant achievement.

Thankfully, many in the sector are now realising that needs-blind allocations to higher education – where all students are equally subsidised – are socially regressive and anti-poor. This is largely because the children of the wealthy attend fee-charging schools that give them a much better shot at qualifying for university than the children of the poor. We know that less than 1 in 10 children from the poorest 70% of households qualify to go to university compared to 1 in 2 or 3 children (40%) among the wealthiest 10% of households. And because of this, if one allocated an additional R10bn to higher-education in a blanket fashion, then about R6,8bn (68%) will end up benefitting the wealthiest 20% of South African households because it is their children who are disproportionately at university (according to two fiscal incidence studies). A recent study showed that 60% of students that qualified for university came from the 30% of high schools that charged fees. What is the point of raising revenue by additional taxes on the richest 20% only to give two thirds of that money straight back to them in the form of indirect subsidies to their children?

So if we agree that the rich should not be subsidised (usually defined as those in households with annual income of more than R600,000), how many students would need funding? Professor Servaas van der Berg’s analysis of household surveys has shown that about 60% of the current university-going population would be eligible for funding. (This assumes that income is under-captured in surveys by about 30% . Importantly, this would cover 73% of Black African university students and 30% of White university students.

While ending financial exclusion at university won’t solve the thornier issues in South Africa – about land, inequality, restitution, primary education, unemployment – it would serve as a powerful and invigorating example that things really can be different to what they are now. It would be poetic if the start of a successful campaign for a different South Africa could trace its origins to the toppling of a statue of Cecil John Rhodes.

Dr Nic Spaull is an education researcher at the Research on Socioeconomic Policy (RESEP) group at Stellenbosch University. He is on Twitter @NicSpaull


My take on Matric 2016…

screen-shot-2017-01-06-at-10-29-18-am

screen-shot-2017-01-06-at-10-29-36-am

Every year there is a big song and dance about the matric exams and if the pass rate went up or down, which province came out on top etc. etc. Thankfully some organisations like Equal Education are directing our attention to where the root issue is: the weak foundations students get in primary schooling. There is ample evidence of this in maths and reading as the foundational bell-weather subjects that pretty much everything else is built on.

Throughput pass rates

As I’ve mentioned before we need to move beyond our myopic obsession with the matric pass rate and start seeing the results in light of other statistics, notably the throughput pass rate. Rather than calculating the number of students passing matric divided by the number of students writing matric (the traditional matric pass rate) we should also be calculating the number of students who pass matric relative to the number of students in grade 10 two years earlier and those in grade 2 ten years earlier (throughput pass rates). This gives us an idea of how many kids are dropping out along the way and if this is increasing or decreasing over time. (Note that this is also affected by the changing number of students repeating Grade 10. Because we don’t know the number of non-repeating students we have to use the total number of students enrolled in Grade 10).

From the above graph and table we can see the following:

  • The throughput pass rate and the traditional matric pass rate do not always move in tandem. For example, between 2014 and 2015 the traditional matric pass rate went down while the throughput pass rate went up, indicative of the much larger cohort of students who did worse on average but because there were so many more students this meant a higher throughput pass rate (as I ‘ve discussed here and Nick Taylor has made the same argument in 2011).
  • The throughput pass rate has been steadily increasing over time, which is a good thing.
  • Less than half of the cohort (whether Grade 2 or Grade 10) actually pass matric. In our system about 60% of South African youth leave the schooling system without any proof of their educational status.

Standardisation and grade inflation

Secondly there is the issue of standardisation and adjustment. The quality-assurance body Umalusi is tasked with standardising the matric results so that no one year is disadvantaged relative to another. If the exams are more difficult/easy then Umalusi is allowed to adjust the marks upwards/downwards (by a maximum of 10 percentage points). As I discussed last year the presence of an extra 120,000 matrics in 2015 made the process of standardisation much more complicated than it had been in the past. We know these are weaker students and thus would have dragged down average performance, yet the decline in average performance in 2015 was attributed to more difficult papers.

“Was the test really so much more difficult than previous years? (This is the only reason why one is allowed to adjust the marks at all.) Why did the internal and external moderators not pick up the huge increase in difficulty? Is it not more plausible that the massive drop in pre-adjusted performance was actually due to the additional 112,000 weaker pupils who would have otherwise dropped out? If so, Umalusi shouldn’t have adjusted. (from here)”

In my view the standardisation of raw marks should be done without progressed learners included and then applied to progressed learners after the fact. You cannot compare the 2015 and 2016 cohorts (and to some extent the 2014 cohort) with earlier cohorts because they did not have progressed learners. I think this remains an open question and I am quite anxious about the very large adjustments that Umalusi is making, assuming that the tests are getting much more difficult when the most plausible explanation is the inclusion of many more weaker students that typically would have dropped out in the past. (In 2015 the number of students passing maths literacy increased from 38% to 71% and there were similarly large adjustments in 2016).  If I am right about this, and there is essentially a lot of grade-inflation going on, then we are likely to see universities increasing their NSC points entrance criteria and – something which we have already seen over the last 6 years – the use of other criteria like the National Benchmarking Tests.

Provincial performance and sample selection

Every year the media likes to highlight which province has done the best in the matric exams. The competition is usually between our two wealthiest provinces (surprise surprise!), which are Gauteng and the Western Cape. In 2016 the Free State had the highest matric pass rate of 88% and so MEC’s and bureaucrats were all commending the Free State for their achievement. But if we dig a little deeper there are a few thorny questions here…

In 2011 Nick Taylor argued that changes in the matric pass rate can be driven by many things, including the difficulty of the exams, subject combinations and the number of students that actually make it to matric. This later point is the one I want to highlight here – the practice of not letting weaker students get to matric, sometimes referred to as gate-keeping or — and I hate this term — ‘culling’).

When I heard that the Free State and the Northern Cape had increased their matric pass rates significantly (7 and 9 percentage points respectively), my first question was “But did they hold back more students than last year?” So let’s see what the numbers say. Does there seem to be a relationship between the number of Grade 12s writing matric between 2015 and 2016 and a change in the pass rate over the two years? Let’s see…

screen-shot-2017-01-06-at-11-24-36-am

So, the three provinces with the largest increases in their matric pass rate also had the biggest declines in the percentage of students writing matric. That’s pretty strange. So if we do a similar analysis to the throughput pass rate above but at a provincial level what do we see? The Free State is no longer first but 4th of the provinces with the Western Cape and Gauteng at the top. And the Northern Cape and KZN are now only marginally better than Limpopo – the second worst performing province.

screen-shot-2017-01-06-at-11-15-04-am

screen-shot-2017-01-06-at-11-15-19-am

There may well be a legitimate explanation for this but our first port of call when seeing a big change like this is a change in the underlying sample. Before we start asking what interventions the Free State implemented we should be asking if the ‘increase’ is legitimate. At least at face value there seems to be a lot more sample selection in the provinces with the highest increases in matric pass rates. And judging from the Grade 10 (2014) and Grade 11 (2015) cohorts it doesn’t look like there was a population decline in these provinces.

So to sum up the above I’d say the following:

  1. We shouldn’t be obsessing about the matric pass rate in isolation or as much as we do.
  2. The biggest problems that should occupy our time, energy and resources are getting the foundations right in primary school.
  3. At least part of the reason why the Free State, the Northern Cape and KZN did better in 2016 than in 2015 is that they held back a higher proportion of their Grade 10 and Grade 11 students than the other provinces.
  4. I think there are still big question marks about the way Umalusi is treating progressed learners in the standardisation process and we may be witnessing quite significant grade inflation.
  5. Universities are likely to feel the brunt of this when their first years are not as well-equipped to succeed as their grades seem to indicate.

So now, I need to get back to Foundation Phase reading research 🙂

The excel file with the above tables/graphs/figures is here in case anyone wants to do their own calculations/graphs.