
Every year there is a big song and dance about the matric exams and if the pass rate went up or down, which province came out on top etc. etc. Thankfully some organisations like Equal Education are directing our attention to where the root issue is: the weak foundations students get in primary schooling. There is ample evidence of this in maths and reading as the foundational bell-weather subjects that pretty much everything else is built on.
Throughput pass rates
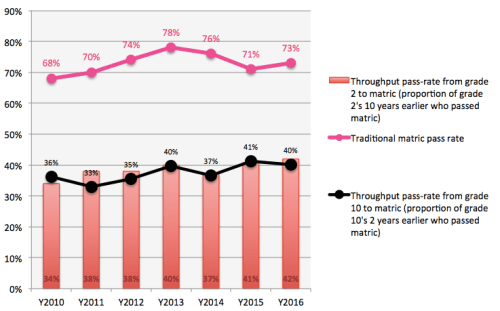
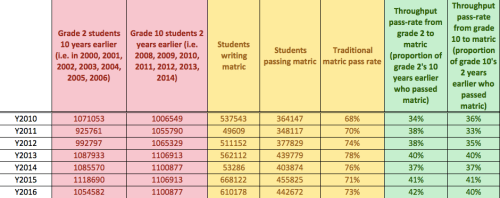
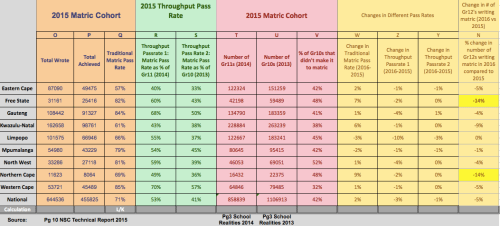
As I’ve mentioned before we need to move beyond our myopic obsession with the matric pass rate and start seeing the results in light of other statistics, notably the throughput pass rate. Rather than calculating the number of students passing matric divided by the number of students writing matric (the traditional matric pass rate) we should also be calculating the number of students who pass matric relative to the number of students in grade 10 two years earlier and those in grade 2 ten years earlier (throughput pass rates). This gives us an idea of how many kids are dropping out along the way and if this is increasing or decreasing over time. (Note that this is also affected by the changing number of students repeating Grade 10. Because we don’t know the number of non-repeating students we have to use the total number of students enrolled in Grade 10).
From the above graph and table we can see the following:
- The throughput pass rate and the traditional matric pass rate do not always move in tandem. For example, between 2014 and 2015 the traditional matric pass rate went down while the throughput pass rate went up, indicative of the much larger cohort of students who did worse on average but because there were so many more students this meant a higher throughput pass rate (as I ‘ve discussed here and Nick Taylor has made the same argument in 2011).
- The throughput pass rate has been steadily increasing over time, which is a good thing.
- Less than half of the cohort (whether Grade 2 or Grade 10) actually pass matric. In our system about 60% of South African youth leave the schooling system without any proof of their educational status.
Standardisation and grade inflation
Secondly there is the issue of standardisation and adjustment. The quality-assurance body Umalusi is tasked with standardising the matric results so that no one year is disadvantaged relative to another. If the exams are more difficult/easy then Umalusi is allowed to adjust the marks upwards/downwards (by a maximum of 10 percentage points). As I discussed last year the presence of an extra 120,000 matrics in 2015 made the process of standardisation much more complicated than it had been in the past. We know these are weaker students and thus would have dragged down average performance, yet the decline in average performance in 2015 was attributed to more difficult papers.
“Was the test really so much more difficult than previous years? (This is the only reason why one is allowed to adjust the marks at all.) Why did the internal and external moderators not pick up the huge increase in difficulty? Is it not more plausible that the massive drop in pre-adjusted performance was actually due to the additional 112,000 weaker pupils who would have otherwise dropped out? If so, Umalusi shouldn’t have adjusted. (from here)”
In my view the standardisation of raw marks should be done without progressed learners included and then applied to progressed learners after the fact. You cannot compare the 2015 and 2016 cohorts (and to some extent the 2014 cohort) with earlier cohorts because they did not have progressed learners. I think this remains an open question and I am quite anxious about the very large adjustments that Umalusi is making, assuming that the tests are getting much more difficult when the most plausible explanation is the inclusion of many more weaker students that typically would have dropped out in the past. (In 2015 the number of students passing maths literacy increased from 38% to 71% and there were similarly large adjustments in 2016). If I am right about this, and there is essentially a lot of grade-inflation going on, then we are likely to see universities increasing their NSC points entrance criteria and – something which we have already seen over the last 6 years – the use of other criteria like the National Benchmarking Tests.
Provincial performance and sample selection
Every year the media likes to highlight which province has done the best in the matric exams. The competition is usually between our two wealthiest provinces (surprise surprise!), which are Gauteng and the Western Cape. In 2016 the Free State had the highest matric pass rate of 88% and so MEC’s and bureaucrats were all commending the Free State for their achievement. But if we dig a little deeper there are a few thorny questions here…
In 2011 Nick Taylor argued that changes in the matric pass rate can be driven by many things, including the difficulty of the exams, subject combinations and the number of students that actually make it to matric. This later point is the one I want to highlight here – the practice of not letting weaker students get to matric, sometimes referred to as gate-keeping or — and I hate this term — ‘culling’).
When I heard that the Free State and the Northern Cape had increased their matric pass rates significantly (7 and 9 percentage points respectively), my first question was “But did they hold back more students than last year?” So let’s see what the numbers say. Does there seem to be a relationship between the number of Grade 12s writing matric between 2015 and 2016 and a change in the pass rate over the two years? Let’s see…
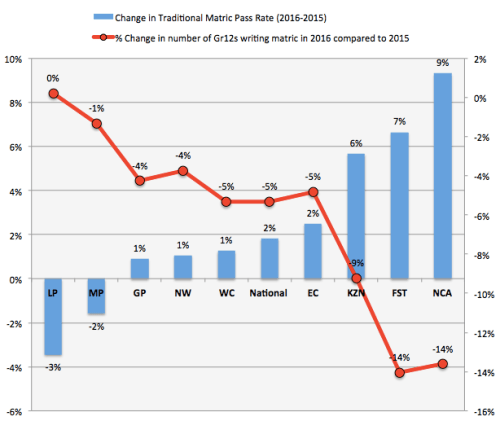
So, the three provinces with the largest increases in their matric pass rate also had the biggest declines in the percentage of students writing matric. That’s pretty strange. So if we do a similar analysis to the throughput pass rate above but at a provincial level what do we see? The Free State is no longer first but 4th of the provinces with the Western Cape and Gauteng at the top. And the Northern Cape and KZN are now only marginally better than Limpopo – the second worst performing province.
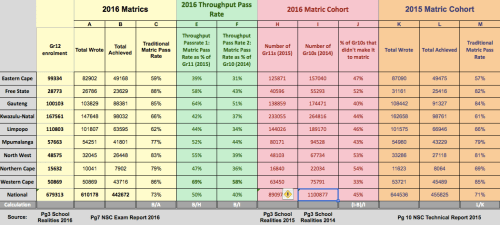
There may well be a legitimate explanation for this but our first port of call when seeing a big change like this is a change in the underlying sample. Before we start asking what interventions the Free State implemented we should be asking if the ‘increase’ is legitimate. At least at face value there seems to be a lot more sample selection in the provinces with the highest increases in matric pass rates. And judging from the Grade 10 (2014) and Grade 11 (2015) cohorts it doesn’t look like there was a population decline in these provinces.
So to sum up the above I’d say the following:
- We shouldn’t be obsessing about the matric pass rate in isolation or as much as we do.
- The biggest problems that should occupy our time, energy and resources are getting the foundations right in primary school.
- At least part of the reason why the Free State, the Northern Cape and KZN did better in 2016 than in 2015 is that they held back a higher proportion of their Grade 10 and Grade 11 students than the other provinces.
- I think there are still big question marks about the way Umalusi is treating progressed learners in the standardisation process and we may be witnessing quite significant grade inflation.
- Universities are likely to feel the brunt of this when their first years are not as well-equipped to succeed as their grades seem to indicate.
So now, I need to get back to Foundation Phase reading research 🙂
The excel file with the above tables/graphs/figures is here in case anyone wants to do their own calculations/graphs.


Thank you so much for this summary Nic!
Best wishes,
Kirstin OâSullivan
Education Programme Officer
The ELMA Philanthropies Services (Africa) (Pty.) Ltd.
ABSA Building, 20th Floor
2 Riebeek Street
Cape Town 8001
Mailing: Postnet Suite 23, Private Bag X3, Roggebaai, 8012, South Africa
T: +27.21.446.2940 F: +27.21.421.1145
Check out our website and blog: http://www.elmaphilanthropies.org/
Follow us on Twitter: http://www.twitter.com/ELMAPhilanthro
[Description: Description: ELMA 13GG2CLEARSMALL copy (4)]
A decade of investing in thriving children and communities
Excellent analysis the bureaucrats cannot argue with! Focus must be on ECD and FP education, provision and support, and scaffold those gains upwards and onwards from there.
Something most of us in the Foundation Phase have been saying for years. Concentrate on ECD as well as Foundation Phase. Develop a thirst for knowledge, something that previously happened at home with perhaps a parent is not happening anymore as everyone needs to work. Perhaps “culling” the fly by night day mothers would be a good start. This would be a good start.
Well done on excellent analysis! Highlights many of the real issues. Primary schooling in need of enormous help, not only in ECD and FP but the lingering lost in the Intermediate Phase where policy ‘dictates’ that teachers over-test and under-teach. One should also stop to consider rural as opposed to urban education as they remain worlds apart.
Most interesting. Thx.
The term “MATRIC’ is a misnomer. “Senior Certificate ” would seem to be the apt term.
“Matric” to my understanding is a university faculty specific entrance examination, which certain Senior Certificate achievers may be EXEMPTED from writing.
THIS IN TURN BEGS THE QUESTION I HAVE FOR THE AUTHOR :
Given my understanding as set out above, what are the true Matric vs SC figures , bearing in mind that in all probability cohort and promotion would significantly affect standards?
No, the matrices pass rate is important, but only if the standard is meaningful. You are right though to indicate that the problems start in the lower grades. But the biggest problem is in my view that the pass standard is too low. What should happen is that the pass rate should be moved back to 50% without delay, and I think something should then be done to assist those learners who previously passed with lower marks, although this will be difficult to do. A pass requirement will first of all force the teachers to start doing a better job, because if they don’t their merits will suffer. Secondly the learners will be better prepared for the next grades. I also believe that the whole mode of education should be changed to be based on computerized education and the whole education workforce retrained. This will enable more reasonable work conditions for the teachers on the one hand, but also give the education department the chance to get rid of teachers who are not committed and give the government the opportunity to get the control over education back out of the hands of the unions.
“Level of difficulty” is a measure of how students perform on an assessment task. It cannot be reliably estimated, even by expert evaluators, before results are known. There are too many intervening factors that affect students’ performance on any given question.
Reaching Grade 12 in an academic stream is unusual in most African countries. I welcome the initiative to broaden the scope of types of NSC to be offered in future – an academic stream, a technical/vocational stream and a technical stream. Perhaps this will help to deflate the NSC bubble that has prioritized university access above all other career options.
Pingback: 100% Matric Pass-rate. Top 20% Maths Nationally. - OLICO