
 Yesterday RESEP had our first internal education workshop of the year and it was a great success. One of the presentations was by Martin Gustafsson on various trends and shocks in the education system. I found it to be especially important and interesting and asked if I could include the presentation in blog format, which Martin kindly agreed to (see below). For those that don’t know Martin he is easily one of the top 3 most knowledgeable people about the SA education system.
The 2 main points that Martin makes are:
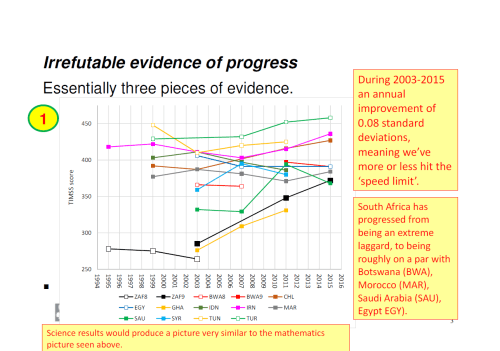
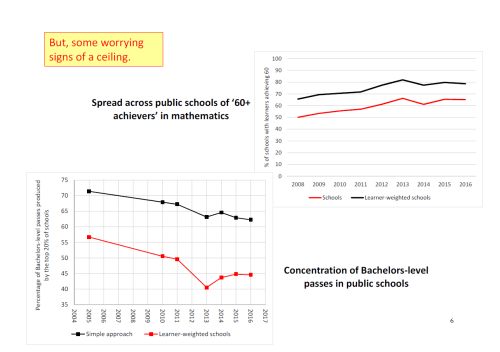
- There is irrefutable evidence that there has been real progress in learning outcomes in SA over the last decade,
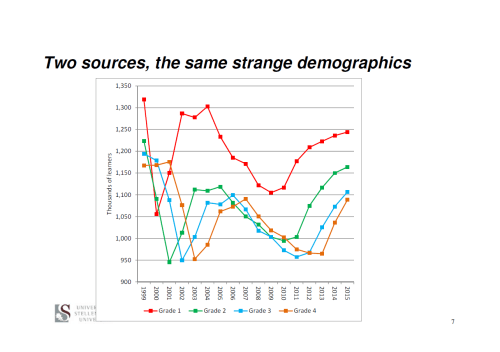
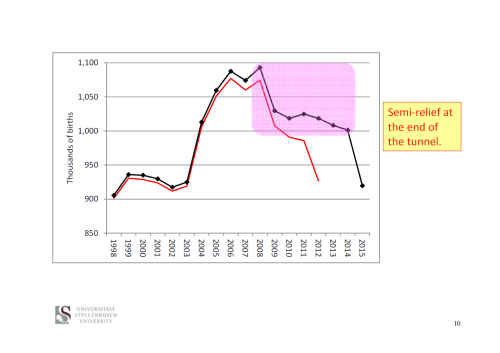
- That there is a very strange demographic trend in SA (confirmed by 2 independent data sources) that there was a large increase in births in 2004 and 2005 (in the order of 10%) which is extremely peculiar. Note this has significant implications for resource allocation, class sizes etc. This was discussed in the DBE 2016 Sector Review (see excerpt below), but hasn’t been given nearly enough attention.
Regarding #2, from discussions with Martin, who has been involved in reviewing the 2013 SACMEQ results, it seems clear that the 2007 to 2013 SACMEQ trend has indeed been positive for South Africa, and about as large as one could expect (and roughly in line with what has been seen in TIMSS). But these positive trends are smaller than the extremely large improvements, which I’ve argued are implausible, seen in earlier preliminary SACMEQ results presented to the Parliamentary Portfolio Committee on Basic Education in 2016. What the sector urgently needs is the finalising of the 2013 SACMEQ process and the release of official learner results for all SACMEQ countries.
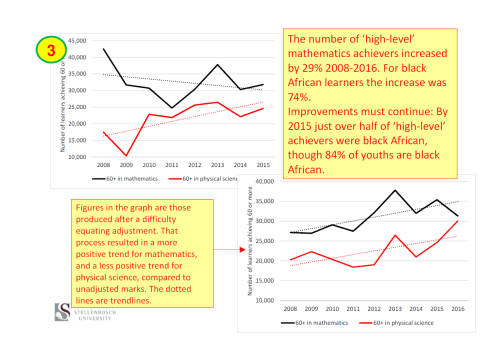
The trends seen in #3 below are from this 2016 paper of Martin’s.
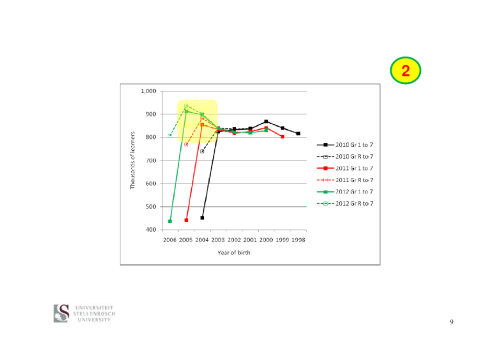
“At the lower primary level, what has clearly occurred is the entrance of a ‘wave’ of larger birth cohorts. In 2011, Grade 1 enrolments increased by 5.2% relative to 2010. In 2012, Grade 2 enrolments increased by 7.0%. By 2015, the increase had reached Grade 5, with enrolments in this grade increasing by 5.2% relative to 2014. As seen in Table 2 in the appendix, substantial increases were seen across all provinces, with the exception of Eastern Cape, which in fact saw a decline . The increases were strongest in Gauteng and Western Cape, almost certainly because these two provinces experienced a combination of two factors, both the demographic change in terms of larger birth cohorts, plus migration into these provinces. By 2015, grades 1 to 7 enrolments had reached 7,1 million in public ordinary schools, the highest figure since 2007 (when the enrolment total was also around 7.1 million). Moreover, total enrolment in just grades 1 to 5 was higher than it had been in any year since 2002. Projections indicate that the increases will continue to be felt in grades beyond Grade 5 in 2016 and beyond. ” Page 9 of this 2016 DBE Sector Report.
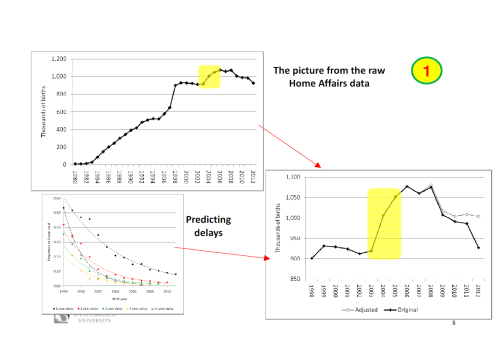
*Note in the graph s above (top left) the steady rise in births from 1982 to 1998 are simply because of better data-capturing rather than increased births. It stabilises from about 2000.
For those that haven’t read the DBE 2016 Sector Review I would strongly recommend doing so!


