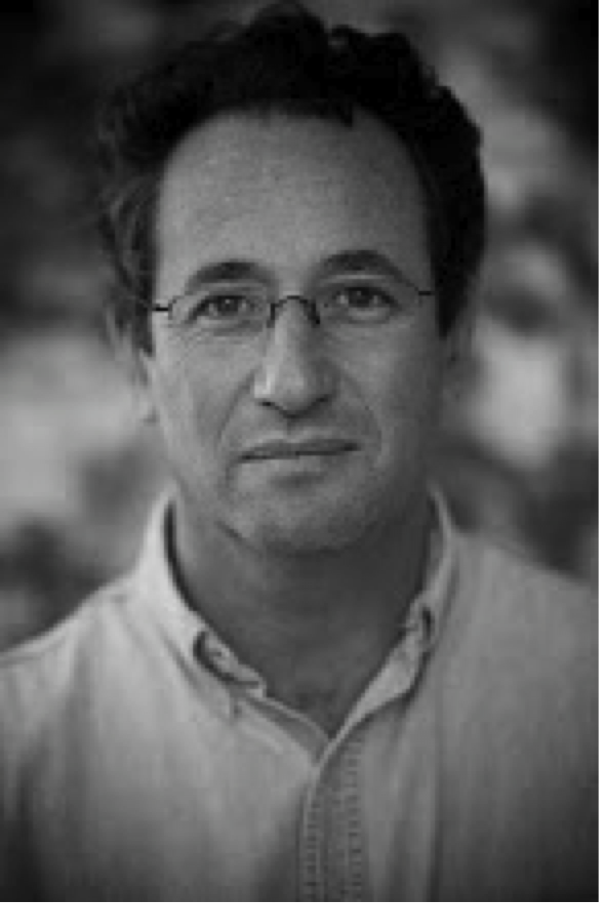
Q&A with Mary Metcalfe

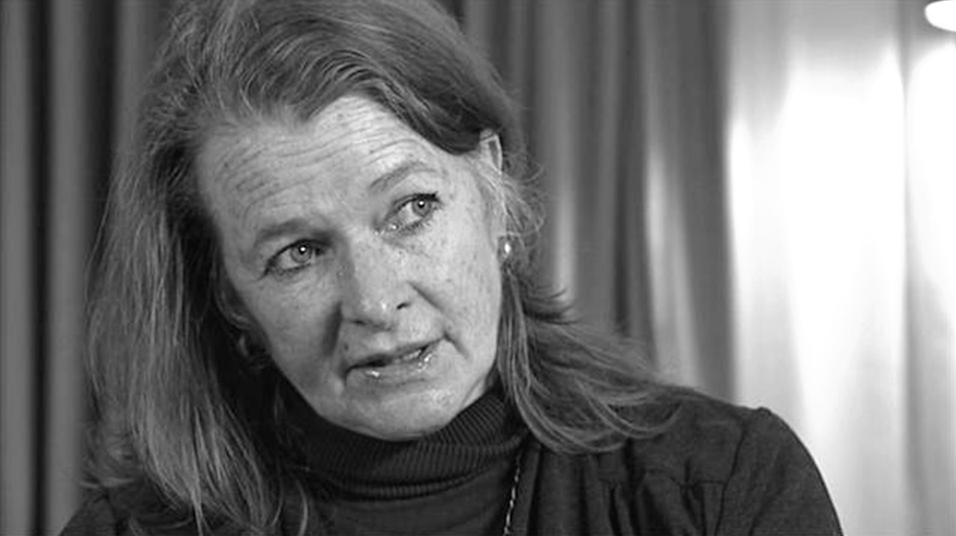
Mary2

The aim of the Q&A series is to get an inside look into some of South Africa’s leading education academics, policy-makers and activists. We start the series with Professor Mary Metcalfe…  

1)   Why did you decide to go into education?

“Originally it was the only way that I could get funding to study – a teaching bursary.  Although the broad field of education was not inconsistent with my fundamental interest in social service, I have stayed in education for 40 years  – I started teaching unqualified.

2)   What does your average week look like during the semester?

 I am a visiting adjunct professor at Wits PDM, but I only go there when I see postgraduate students for supervision.  I currently spend all of my time on PILO (the Programme to Improve Learning Outcomes), and on my work as Chair of the Education Advisory Board of the Open Society Foundations.  The latter keeps me traveling often during the year.  PILO keeps me busy in the Northern Cape and in KZN.   This means many early morning flights and late evening returns.  I tend to have very long working days and working weekends.  I usually work in the evening listening to music, and try to stop working an hour or so before I sleep – or my mind is still racing and I can’t sleep!

3)   While I’m sure you’ve read many books and articles in your career, if you had to pick one or two that have been especially influential for you which one or two would they be and why?

Most recently, the person who changed my thinking a great deal has been Richard Elmore.  I couldn’t accept his notions of opening the teaching space at first glance – my professional education was deeply rooted in the independent professional judgement of the educator.  It took some thinking to realize that this is actually a deeper professionalism.

4)   Who do you think are the current two or three most influential/eminent thinkers in your field?

Linda Darling-Hammond, Ben Levin, and Helen Timperley 

5)   What do you think is the most under-researched area in South African education?

The social context of secondary schooling and how this impacts on learning and retention – dropout, self-esteem, and the consequences of this for families.

6) If you could highlight one of the pieces of advice you regularly give your students, what would it be?  

I’m not sure that I have said anything stupendous.  I am very keen for students to construct arguments well and to be able to use the literature to do so without losing their own voice.

7)   If you ended up sitting next to the Minister of Education on a plane and she asked you what you think are the three biggest challenges facing South African education today, what would you say?

  1. To understand the constitutional framework for the roles and responsibilities of the national and provincial departments of education.  Norms and Standards are a critical instrument and have not been adequately used as an instrument for accountability, planning, and to create justifications for the financing to achieve the careful plans developed at provincial level. It is the provincial plans that matter, and it would be great if the national department used the norms and standards component of the South African Schools Act to assess these plans. Norms and Standards can be set for a variety of key elements of quality – and the provinces should report as envisaged in the Act.  Where there are careful plans with capacity, the funds might follow.
  2. I’d also highlight the internal efficiency of the system.   We are running short of funding – the personnel share is growing which has dire consequences for quality – and there is too much wastage in the system. Poor quality results in repetition, failure and drop out.  We need to move on the Grade 10 exam so that young people who leave before NSC have a credential, and to take the pressure off of the NSC which must assess so much.  
  3. A sense of hope amongst teachers that they will be supported – that they will be helped with the problems that they face. 

8)   If you weren’t in education what do you think you would be doing?

I have stayed in education because I believe that it is the key mechanism to change lives, and build development. Nothing can do this better.

9)   Technology in education going forward – are you a fan or a sceptic?

A great fan.  I think about this a lot and try to keep up to date.  In PILO we are using technology in some interesting ways – but it is “over-sold and underused” as Cuban has said.  Capacity must be there for the entire value chain, and there must be thorough M and E. We must insist on open education resources wherever possible, and work towards technology being an instrument of achieving equality.”

//

Some of the other academics on my “to-interview” list include Brahm Fleisch, Servaas van der Berg, Martin Gustafsson, Veronica McKay, Hamsa Venkatakrishnan, Ursula Hoadley and Stephen Taylor. If you have any other suggestions drop me a mail and I’ll see what I can do.
SACMEQ data archive available for download

sacmeq

The SACMEQ data for 14 sub-Saharan African countries is now available for download for anyone who registers on the SACMEQ website (it only takes 5 minutes). This is a tremendously rich dataset and I’d encourage anyone who is interested in the quality of education in Africa to download it and explore. For some background reading I’d recommend the following:

Links I liked…

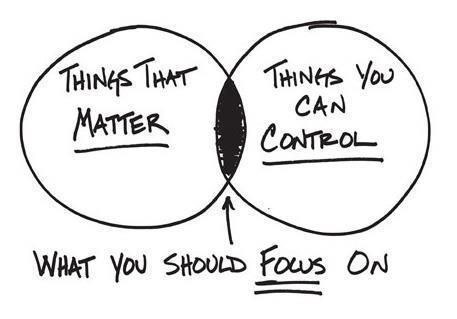
venn matters

  • As far as intellectual crushes go, I am a huge fan of Bill Easterly – listen to his EconTalk podcast on benevolent autocrats
  • The richest 300 people in the world have the same wealth as the poorest 3000,000,000 (3 billion) – absolutely illuminating and truly scary 3 minute infographic video
  • Sad day for LGBT rights in Nigeria as President Goodluck Jonathan bans same-sex marriage in the country.
  • Political prophet Alistair Sparks writes an insightful piece on what another 5 years of Zuma means for the ANC and South Africa.
  • Chart showing Africa from an LGBT rights perspective. Just another way that South African is different to the rest of Africa – it respects the rights of minorities irrespective of the size of the majority.
  • US parents are 2.5 times more likely to ask Google “Is my son gifted?” than “Is my daughter gifted” – NYT article showing the ongoing legacy of gender inequality and patriarchy.
  • Causal evidence that secular education reduces religiosity among girls in Turkey – no surprises there folks (see NBER paper here).
  • SAFM Forum at 8 – the podcast from my radio discussion on “Back to School“
  • Given the jamboree around the matric 2013 results I found myself on TV a few times this month 1) School dropout in South Africa: 550,000 – eNCA, 2) Teacher content knowledge in South Africa – News24, 3) Mathematics literacy in South Africa – News24. Fun times!
  • Mweli Mathanzima (acting DDG for curriculum) wrote a response to my article (ANA results are not comparable), his article titled “No ANA mess, they’re a success.” I’m still contemplating if I want to right a reply to his reply but I think I will wait for the inspiration to hit. The main criticism I have (encapsulated in the title of my article) is that the Minister should not be claiming “improvements” using ANA changes year on year – something that Mweli does not address. The question is pretty straight-forward, does he agree or disagree with the Minister that the ANA results prove that things are improving? The short answer is that they CANNOT be used to show improvements or deterioration because they aren’t psychometrically calibrated to be compared year on year…anyways I’ll probably write a short reply sometime.
  • The DBE has called for comment on its new policy “Incremental introduction of African Languages Policy” and asked for comment. If you feel strongly about the potential upsides/downsides then the call for public comment closes on the 12th of Feb.

Education in SA – Still separate and unequal (Extended version of CityPress article)

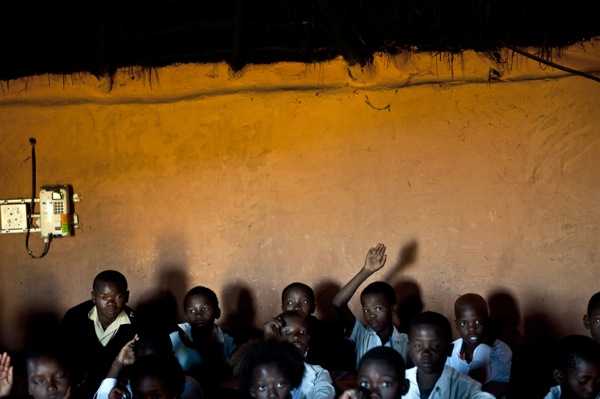
Mud schools, no lights or electricity, overcrowded. Madelene Cronjé

[The article below is an extended version of my article published in CityPress on the 12th of January 2014]

When the matric results were released on Monday this week, the Deputy Minister of Education Enver Surty chastised us in academia for “denigrating” the schooling system, claiming that now is not the time for pessimistic criticism but rather for celebration and “inspiring hope”. The Deputy Minister will have to forgive me because I find it incredibly difficut to celebrate when no one is really acknowledging the 550,000 students who started school 12 years ago but have been silently excluded from the schooling system, dropping out before matric. To be specific, of 100 students that started school 12 years ago, only 51 made it to matric in 2013, 40 passed and 16 qualified to go to university. These youth that drop out before matric are completely marginalized and pushed to the fringe of society, forgotten amidst the hype of those who passed. Minister Motshekga is no exception. In her 5000 word speech, she devoted all of 10 words to discussing the issue: “The sector needs to urgently reduce repetition and dropout  drastically.” That’s it. Two strong adjectives and a hat tip?

I’ve been told  by some that now is not the right time to talk about this. But when is the right time to talk about it? June? September? It’s never comfortable or convenient to talk about half a million children dropping out of school and facing unemployment or menial work – something that happens year in and year out.

By not addressing drop out and repetition Minister Motshekga did a disservice to the country, but perhaps even more disturbing were the sweeping statements that fly in the face of hundreds of research reports on South African education. In discussing the results the Minister claimed that: “Contrary to what some would like the nation and the public to believe – that our results hide inequalities, the facts and evidence show that the two top provinces (Free State and North West) are rural and poor…The truth is in terms of learning outcomes in the sector, education remains an equalizer between poor and rich.”

To address the second part of this statement first, if South Africa’s education is an “equalizer” between poor and rich, why is it that South Africa’s income inequality has increased since the transition? While it is certainly true that if quality education is offered to rich and poor alike it will lead to a situation of increased social mobility, this is not the case in South Africa. In South Africa we have two public schooling systems: one which is functional, wealthy, and able to educate students (about 25% of public schools); with the other being poor, dysfunctional, and unable to equip students with the necessary knowledge and skills they should be acquiring in their schooling career (roughly 75% of public schools).

Apart from a small minority, most black children continue to receive an education which condemns them to the underclass of South African society, where poverty and unemployment are the norm, not the exception. This substandard education does not develop their talents and abilities or expand their economic opportunities, but instead denies them dignified employment and undermines their own sense of self-worth. In short, poor school performance in South Africa reinforces social inequality and leads to a situation where children inherit the social station of their parents, irrespective of their motivation or ability. That is how income inequality increases.

The second part of her statement – that matric results do not hide inequalities – is also patently untrue. The matric results, like every other educational data set in South Africa, hide enormous inequalities that sometimes aren’t immediately apparent. Before getting to the matric 2013 results, let me summarize some of the findings from the numerous studies highlighting South Africa’s ongoing educational inequalities: 1) The SACMEQ study of 2007 showed that there are huge geographic inequalities in the country with 41% of rural Grade 6 children being functionally illiterate compared to only 13% of urban grade 6 children. The prePIRLS study of 2011 showed the large linguistic inequalities exist: Of those children whose home language was Xitsonga, Tshivenda or Sepedi, one in two (50%) could not read by the end of Grade 4 compared to one in ten (11%) for English and Afrikaans children, and 3) The General Household Survey of 2011 showed that there are large racial inequalities in matric attainment: only 44% of Black and Coloured youth aged 23-24 had attained matric compared to 83% of Indian youth and 88% of White youth. We could also look at the TIMSS study of 2011 or the NSES study of 2009 or any of the Annual National Assessments or a host of others – they all show the same thing – systemic inequalities and underperformance.

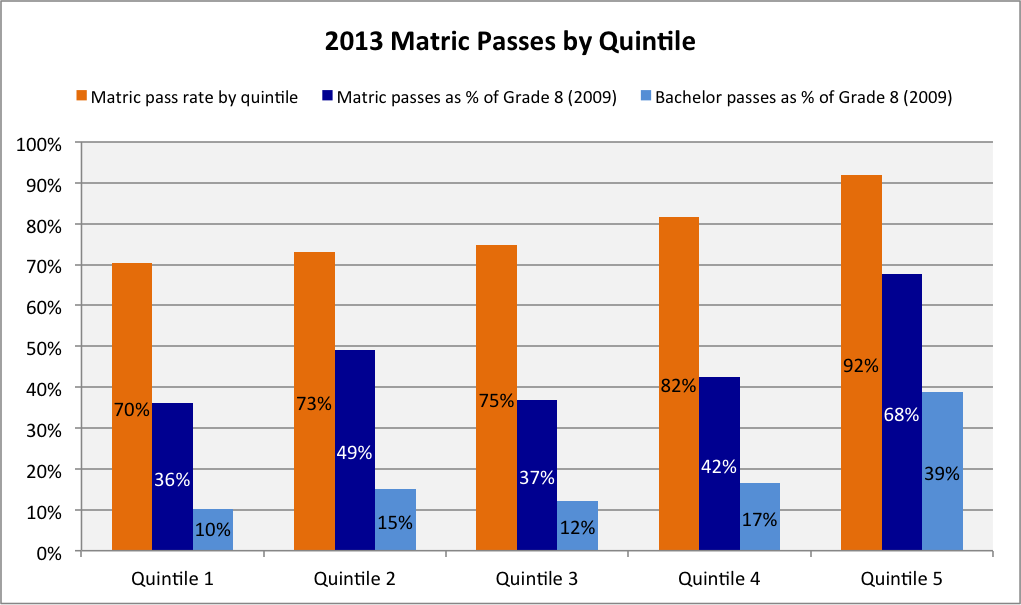
But if we take a closer look at the matric results for 2013 we will see that they too hide severe inequalities. When allocating funding to schools, the Department classifies them into one of five categories called quintiles. Each quintile is meant to have 20% of schools ranging from Quintile 1 (the poorest 20% of schools) all the way up to Quintile 5 (the richest 20% of schools). The funding allocations are pro-poor with Quintile 1 schools receiving R905 per learner and higher quintiles receiving progressively less funding all the way up to Quintile 5 schools which receive R156 per learner. On the surface the differences between the matric pass rate by quintile are not too large with 70% of matrics from Quintile 1 passing and 92% of matrics from Quintile 5 passing. But this hides the fact that pre-matric dropout is twice as high in Quintile 1 compared to Quintile 5. If we looked at the number of enrolments in Grade 8 in 2009 (i.e. when the matric 2013 class was in Grade 8) there were 206,031 students in Quintile 1 schools and 141,905 students in Quintile 5 schools (the numbers are not equal between quintiles because schools prefer to be classified in lower quintiles to receive higher subsidies). But by the time they got to matric there were only 105,954 Quintile 1 matrics and 104,344 Quintile 5 matrics. That is to say that 49% of Quintile 1 students dropped out between Grade 8 and Grade 12 but only 26% of Quintile 5 students dropped out between Grade 8 and Grade 12. So if we rather calculate the matric pass rate as a percentage of those enrolled in Grade 8 four years earlier the figures change drastically being 36% in Quintile 1 and 68% in Quintile 5, i.e. of 100 Grade 8 Quintile 1 students, only 36 made it to matric and passed. Of 100 Grade 8 Quintile 5 students, 68 made it to matric and passed. Similarly, the proportion receiving bachelor passes by quintile is only 36% for Quintile 1 matrics and 68% for Quintile 5 matrics But if we calculate it as a percentage of Grade 8 enrolments four years earlier the figures drop to an abysmal 10% for Quintile 1 and 39% for Quintile 5. As a proportion, the number of Quintile 5 students in Grade 8 that will go on to pass matric with a bachelor’s pass is four times higher than that for Quintile 1 students. These shocking results are not limited only to Quintile 1 – the graph shows that the results are very similar in Quintiles 2, 3 and 4.

quintile

In highlighting these results it is not my intention to be the prophet of doom of South African education. I actually do think things are improving and we should give praise where it is due. Minister Motshekga has presided over a number of very important reforms including the introduction of the Annual National Assessments (ANAs), the implementation of Curriculum Assessment Policy Statement (CAPS), the roll out of the workbooks and the establishment of NEEDU. By focussing on the basics the Minister has laid the foundation for improvement and I agree that we are beginning to see the fruits of these efforts. Because of this I also happen to think she is the best  Minister of Education we have had to date. But to claim that the results do not hide inequalities is absolutely unforgiveable. If there is one thing that is clear from the local and international research on South African education it is that our schooling system is egregiously unequal. That finding is simply not up for debate.

While the low-level equilibrium that South Africa finds itself in has its roots in the apartheid regime of institutionalised inequality, this fact does not absolve the current administration from its responsibility to provide a quality education to every South African child, not only the rich. Until such a time as the Department of Basic Education and the ruling administration are willing to seriously address the underlying issues in South African education, at whatever political or economic cost, the existing patterns of underperformance and inequality will remain unabated.

Nic Spaull is an education researcher in the Economics Department at Stellenbosch University. He blogs about education research at www.nicspaull.com and he can be followed on Twitter @NicSpaull. 

Additional reading:

Matric is failing SA’s lost children (M&G article)

matric


[This article first appeared in the Mail & Guardian on the 10th of January and is available on their website here]

Although the matric exams are an important institution in South Africa, they should not be used as the primary indicator of school-system performance.

When speaking about the state of education in South Africa it is both conventional and convenient to talk about the matric pass rate. This figure is easy to understand; it is published every year in all national media – and it is very misleading.

Although the matric exams are an important institution in South Africa – notably because they are quality assured by an independent body, Umalusi – they should not be used as the primary indicator of school-system performance. Matric results provide useful information for those  who reach and write matric, but tell us nothing about the more than 500 000 pupils who started school in 2002 but never reached matric, let alone passed.

The tale of the matric results is a story half-told.

If we look at the matric class of 2013, there were 562 112 full-time candidates, of whom 439 779 passed, yielding a matric pass rate of 78.2%. But how many pupils were there to begin with? If we look at the 2013 grade 12 cohort, we see that there were as many as 1 111 858 pupils in grade two (in 2003), 1 094 189 in grade 10 (in 2011) – but only 562 112 in grade 12 (in 2013). What happened to the other 549 746 that never made it to matric? Most dropped out in grade 10 and 11.

Rather than calculate the matric pass rate as the number who pass matric divided by those who wrote matric (that is, 439 779 divided by 562 112), what would the 2013 figure be if we instead calculated the number who pass matric divided by those who started school 12 years earlier (439 779 divided by 1 111 858). I use grade two figures rather than grade one because grade two is a better indication of the true size of the cohort, given the excess repetition we have in grade one.

The calculation I am suggesting we do yields a truly shocking cohort matric pass rate: 40%! That is to say, of every 100 pupils who started school, only 51 made it to matric in 2013, 40 passed and 16 qualified to attend university.

This analysis shows how the normal way of calculating the pass rate, which as we know yielded 78.2%, shrouds the reality that half of the cohort never reached matric, let alone passed.

Discussing the matric pass rate without also mentioning that hundreds of thousands of pupils drop out in grades 10 and 11, and thus never make it to matric, is disingenuous, misleading and disregards those children marginalised by the schooling system.

Although I would like to celebrate with the pupils who passed their matric exams, I find myself asking: “Who is going to speak up for the 550 000 children who started school 12 years ago, but have been silently excluded because of drop out? Given that we have no reliable pre-matric exam, what educational qualification do these children have?” Absolutely nothing. They are the first ones to fill the ranks of the unemployed, leading to a staggering unemployment rate of 50% – twice the national average – among youth (those from 18 to 24 years old).

Relative to other developing countries, South Africa actually has a higher than average proportion of pupils entering upper secondary school and an average proportion entering the last grade (grade 12). Yet the proportion that successfully completes secondary school is well below average for similar developing countries.

In South Africa only 40% of a cohort will graduate from upper secondary school, compared with much higher figures in Turkey (53%), Brazil (67%) and Chile (72%). This also explains why South Africa has comparatively few youth who reach and complete post-school education. Fewer than 10% of youths in South Africa attain 15 years of education (completion of a three-year degree, for example), compared with at least 15% in Columbia and Peru and 24% in the Philippines and Egypt.

Similar findings have previously been published, and numerous researchers have provided convincing explanations for the South African dilemma, particularly the analyses of Stellenbosch University academic Martin Gustafsson. His research points to four major factors: the low quality of primary and secondary education, financial constraints, teenage pregnancy and the lack of vocational opportunities.

The department of basic education has already begun to implement policies aimed at addressing these problems. These include:

  • Introducing an externally evaluated grade 9 exam over the next three years;
  • Implementation of the standardised Annual National Assessments, which test grades one to six and nine in numeracy and literacy (introducing these assessments has been a truly historic achievement, even though they do still have many problems);
  • Almost universal (99%) delivery of textbooks for this year;
  • The creation, publication and distribution of workbooks to all schools; and
  • Basic Education Minister Angie Motshekga’s finalising late last year of sensible minimum norms and standards for school infrastructure and her wisely chosen phased-in approach for their implementation.

We often overlook these quiet achievements when we are confronted with the shocking and unrelenting statistics of abysmal underperformance. The foundations are being laid for improvement and progress, but much, much more needs to be done if we are to achieve even our least ambitious goals.

I think there are three main points that summarise the concerns identified here and point the way forward:

  1. Placing excess attention on the matric pass rate is politically expedient, but educationally unsound; the real focus needs to be on the universal acquisition of basic skills in primary school and the quality of secondary schooling;
  2. The lack of any trustworthy pre-matric qualification means that most youths have no widely recognised proof of their educational status; and
  3. Pushing students through the schooling system in the absence of meaningful learning and external standardised assessments is detrimental to the students concerned and to the education system more generally.

We need to move beyond a single-minded and shortsighted focus on the matric pass rate and instead start focusing on the quality of primary and secondary schooling.

Looking more broadly, as we approach general elections this year, we can only hope that those in the corridors of power prioritise service delivery to the poor over patronage of the elite, accountability over cadre leniency and, perhaps most importantly, new and innovative ways of raising the quality of the teaching force. As research has shown time and again, no education system can exceed the quality of its teachers.

Nic Spaull is a researcher in the economics department at Stellenbosch University. His education-focused research can be found at nicspaull.com/research, and he can be followed on Twitter

The economic value of matric and the potential of further education colleges [My Africa Check article]

See below for a copy of my article published on Africa Check on the 10th of January (see here).

africa check

By Nic Spaull | 10th January 2014 (GMT)

Aiming for 100% matric pass rate would be truly misguided, argues economics and education researcher Nic Spaull. Rather, we should look to Further Education and Training Colleges to play a key role in educating and providing meaningful employment to millions of South Africans.

The school-leaving matriculation exam is one of the characteristic features of the South African education system. It would be rare to find a single South African citizen who did not know what the matric exam is, or be able to explain why people think it is important.

On Monday this past week, Basic Education Minister Angie Motshekga announced that of the 560,000 full-time students that wrote matric in 2013, approximately 440,000 passed, yielding a pass rate of 78%. This was up from 74% in 2012.

But the statistic can be misleading since it completely ignores the 550,000 students that started school 12 years ago and then dropped out of the schooling system, mostly in Grade 10 and 11. To be specific, of every 100 students that started school 12 years ago, 51 made it to matric in 2013, 40 passed and only 16 qualified to go to university.

Matric and labour market prospects

Dropping out of school or failing matric has serious labour market consequences.

Given that there is no pre-matric qualification that is widely acknowledged or accepted, a student who does not reach, write and pass matric, will have no proof of their educational status. Employers will not accept school reports since these are not nationally standardised and are thus unreliable indicators of achievement.

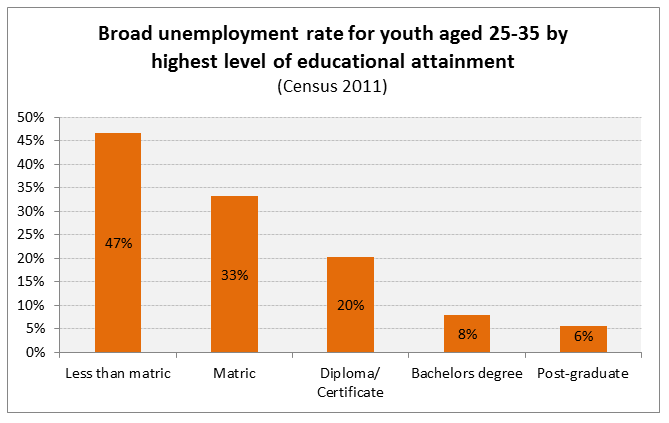
This can be seen when looking at the data from the 2011 National Census. The unemployment rate for 25 to 35 year olds who have “less than matric” was 47% in 2011, much higher than those 25 to 35 year olds that had a matric (33%), a diploma or certificate (20%), and about six times higher than for those with a bachelor’s degree or higher.

Clearly there are economic returns to passing matric, particularly because doing so provides access to further education and training which drastically improves one’s labour market prospects.

In addition to the labour-market importance of having a matric, it is also widely used by universities when determining who gets into what programs. However, many South African universities are now also using the results of the National Benchmarking Tests (NBTs) in their admissions criteria.

Assessing literacy and maths abilities of students

The NBTs were first introduced in 2005 by Higher Education South Africa as a way of assessing the extent to which students were ready for the academic demands of university courses. There are two NBTs, the first one is the Academic and Quantitative Literacy Test and the second is the Mathematics Test. Both tests are three hours in duration, written on the same day and are exclusively multiple-choice. They can be written at numerous times during the year.

Some courses require that students only write the Academic and Quantitative Literacy Test while others require that students write both tests. For example, if a student is applying to do engineering at the University of Cape Town, the matric results count for only half of their admissions points, with the Benchmarking Tests making up the other half.

In light of the above, you might think that the best outcome would be a 100% school retention rate and a 100% matric pass rate. That is both unattainable and undesirable. Such an approach ignores the potential value of an effective vocational education system or a pre-matric qualification that is a reliable indicator of achievement, both of which South Africa currently lacks.

Developing an effective vocational education system is necessary both for individuals whose talents, abilities and aptitudes are more suited to vocational careers, but also to fill the demand from industry for these professions. Even in advanced economies like the United States and the United Kingdom, the secondary school graduation rates are 77% and 87% respectively. One of the problems in South Africa is that there are few real options available to those who do not pass matric.

If we look at youths who do not hold a matric certificate, only 1% held some other non-Grade 12 school certificate of diploma issued by a Further Education and Training (FET) college for example.

Innovative thinking needed

Government’s National Development Plan (NDP) also highlights some of the other problems with the FET system: “Approximately 65 percent of college students are unable to find work experience, which is a requirement for completing National Technical Diplomas popularly known as N diplomas. The college sector is intended as a pathway for those who do not follow an academic path, but it suffers from a poor reputation due to the low rate of employment of college graduates.”

The problems inherent in a matric-or-nothing system are not going away anytime soon. The Department of Basic Education should begin to design and implement an externally evaluated Grade 9 exam and ensure that it does so in such a way that the exam has the trust and respect of the private sector and the public more generally.

While we certainly need to reduce grade repetition and dropout, to aim for universal matriculation would be truly misguided. The problems that face the vocational training sector in South Africa will only be solved with innovative thinking, experimentation and political will.

The aim of educating South Africa’s youth is to enable them to develop their talents and abilities and to lead the sorts of lives they have reason to value. To think that the only way to do this is through formal academic high school is short sighted and dismisses the potential for the FET sector to provide meaningful employment to millions of South Africa’s youth.

Nic Spaull is a researcher in the Economics Department at Stellenbosch University. His blog about education research at www.nicspaull.com and he can be followed on Twitter @NicSpaull

– See more at: http://africacheck.org/2014/01/10/the-economic-value-of-matric-and-the-potential-of-further-education-colleges/#sthash.okKjoERq.dpuf

The importance of matric/degrees for employment in SA

Census 2011 25-35 years olds

The above table was calculated from the Census 2011 data (thanks Hendrik Van Broekhuizen for his supercross skills) and reflects the employment status of those aged 25-35 years old in 2011. From the table it’s clear that those with higher levels of education are more likely to participate, more likely to be employed, and less likely to be discouraged. Only 39% of those who do not obtain matric were employed compared to 82% of those with a degree. It’s important to remember that the vast majority of the youth do not have degrees. For every one 25-35 year old that had a degree there were 11 who did not even have a matric. Given that this is for the 25-35 year old cohort (as at 2011), it’s not clear what the picture will be for the matrics of 2013. What we do know is that there have been worsening labour market prospects for those with matric, combined with a situation where more and more youth have a matric certificate. Consequently, it is understandable that many South African universities are now supplementing the NSC results with NBT test results when determining who gets into what programs. To get into UCT Engineering, for example, the admission points from the NBTs and those from the NSC are weighted equally. Even a cursory glance at the media coverage of the 2013 matric results would lead one to think that the days of blind faith in the quality of the matric certificate are rapidly coming to an end.

broad unempl

Links I liked…

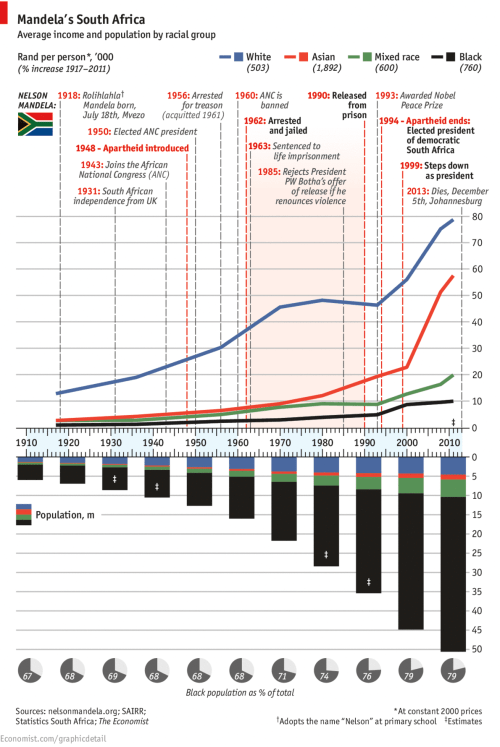
economist SA chart 20130713_gdc865

“The last chapter in any successful genocide is the one in which the oppressor can remove their hands and say, ‘My God, what are these people doing to themselves? They’re killing each other. They’re killing themselves while we watch them die.’ This is how we came to own these United States. This is the legacy of manifest destiny.” 

ANA 2013 results don’t make sense

See below for the article I wrote for the M&G which appeared in the print edition  (13 Dec 2013) and is now available online here.

M&G 05 DEC 2013 19:20 NIC SPAULL

  • Annual literacy and numeracy tests for grades one, six and nine aren’t comparable over time or across grades, so talk of improvement is misleading.
Annual National Assessment results not comparable over time or across grades makes all talk about improvement or trends misleading. (Madelene Cronje, M&G)

I have a love-hate relationship with the yearly publication of the national assessment results.On the one hand I am very proud of the annual national assessments and glad that we have them. Testing primary school children using standardised assessments is imperative to target support where it is needed and also to hold the basic education department and schools accountable. We definitely shouldn’t scrap them, since without them we would be stabbing in the dark.

On the other hand, I get depressed when the results are released because, given the way they are currently implemented, we actually are stabbing in the dark. For the national assessments to fulfil the function for which they were created, the results need to be comparable across grades, over time and between geographical locations. Unfortunately, given the sorry state of affairs that is the 2013 national assessment, none of these criteria are currently met.

The highlights version of last week’s release goes something like this: “Performance in grades one to three is adequate. Results for most grades show a steady increase. Grade nine performance is an unmitigated disaster.”

The unfortunate part is that the only statement I actually believe is the last one.

The reason is that Basic Education Minister Angie Motshekga, presumably shocked to the core by the grade nine mathematics average of 14%, appointed a ministerial task team to assess whether the 2013 grade nine test was fair, valid and reliable. They concluded it was.

This result is in stark contrast with the much higher mathematics averages in grades one (60%), two (59%) and three (53%). If the minister had asked the task team to look into those tests as well, my suspicion is that it would have reached the opposite conclusion.

The reason I think this is that all the existing research in South Africa points to the fact that children are not acquiring the foundational numeracy and literacy skills in primary school and that this is the cause of underperformance in higher grades. The 2011 pre-Progress in International Reading Literacy Study, for example, found that 29% of South African grade four students could not “locate and retrieve an explicitly stated detail” — that is, they were completely illiterate.

Yet in the assessment results, the home language average was 49% and the first additional language was 39% — higher than one would expect given previous grade-appropriate tests.

Likewise, the average score on the grade three national assessment numeracy test was 53%, up from 41% in 2012. Putting aside for a moment the fact that such gargantuan improvements have never been seen around the world — in any country, ever — the level is also way out.

The National School Effectiveness Study, published in 2011, found that grade three students scored an average of 29% on a grade three-level test. If South Africa improved at the fastest rate ever seen globally (which is 0.08 standard deviations a year), the score in 2013 would be about 38% in grade three — not the 53% Motshekga reported. These results don’t make sense.

Another peculiarity is the huge drop in mathematics performance between the relatively high grade six average of 39% and the depressingly low grade nine average of 14% only three grades later. From an educational assessment perspective, this is surely because the grade six test was much easier than the grade nine one, which, the task team established, was set at the appropriate level.

There are other possible reasons why the results in grades one, two and three are so high. One is that for grades one and two teachers were allowed to invigilate their own students during the test — which could obviously be problematic.

Another is that the grade three marks in unmonitored schools were significantly higher than those in the verification sample. In order to assess the fidelity of the administration, scoring and collating processes of the annual national assessments, 2 164 of the 24 355 schools were monitored by an external body. The exams from these schools were then marked and captured by an independent body.

The national unverified grade three literacy average was 51%, which was considerably higher than that found by the verification body, namely 42%.

But the report completely ignores these differences and rather focuses on the higher unverified scores, claiming that the verified scores are “not significantly different from the mean scores of pupils from the whole population” — something that is clearly untrue, as is evident from the report itself.

In some instances, the discrepancies are considerable. In the grade three literacy test, for example, the unverified provincial average for the Eastern Cape was 47% and for the Western Cape it was 50%.

This is in stark contrast with the true average found in the verification sample, which was 35% in the Eastern Cape and 49% in the Western Cape. And yet for some bizarre reason, the department decided to stick with the unverified marks for all grades and both subjects. There were also considerable discrepancies in the grade six and grade nine home language results.

Lastly, one simply cannot compare national assessment results over time. To do this, the tests would have to be calibrated and linked using psychometric analysis — something the department did not do. Last week’s national assessment report is somewhat bipolar on this point.

The report cautions: “The comparability of the tests from one year to the other cannot be guaranteed, which implies that comparability of the results from one year to the other may not be accurate.”

But these cautions did not seem to deter the minister, who said when releasing the results: “I am confident that performance in the education system is on an upward trend and all our interventions and programmes are beginning to produce the desired outcomes” — a confidence I, unfortunately, do not share.

Elsewhere the report says: “There is currently a strong emphasis on ensuring that tests from different years are comparable to each other, so that trends over years can be reliably monitored. In this regard a process is already under way.”

Is this meant to be reassuring? The fact that the process of ensuring psychometric comparability over time is “under way” is a half-baked admission that it was not ready or used for 2013, making any annual comparisons impossible.

Unfortunately, there is no technical report to confirm or deny this. Even without a technical report, the erratic and colossal changes occurring year on year are simply impossible.

In 2012, only 24% of grade six students had acceptable achievement (more than 50%) in the first additional language test — but this shot up to 41% in 2013 (a 71% increase) only one year later. By contrast, for grade nine students — only three grades later — the proportion achieving at an acceptable level came down from 21% in 2012 to 17% in 2013. Anyone familiar with educational assessments would balk at such large and inconsistent changes.

Many questions still remain unanswered. Who was the technical committee that advised the department on the national assessments of 2013? Why were their names not included in the report? What “process” of psychometric comparability is “under way” and where is the department in that process? Who was the “service provider” that verified the assessment results and why was it not listed, as the Human Sciences Research Council was in 2011?

One could also speak about the dangers of giving erroneous feedback to teachers or allocating resources based on faulty data — both of which are the spectres we will have to live with in the future. In testing seven million children the department has bitten off more than it can chew and, in the process, undermined its own technical credibility.

If we could trade ambition for competence, we may have a test that was actually telling us something clear instead of the muddled mess that is the national assessment for 2013. This testing must and should go on, but for heaven’s sake do it properly.

Gender equality – facts and figures

1561_A4_Email_Poster.indd

“The blunt truth is that men still run the world. This means that when it comes to making the decisions that most affect us all, women’s voices are not heard equally. Of the 195 independent countries in the world, only 17 are led by women. Women hold just 20 percent of seats in parliaments globally. In the November 2012 election in the United States, women won more congressional seats than ever before, bringing them up to 18 percent. In the United Kingdom, 22 percent of seats in Parliament are held by women. In the European Parliament, one-third of the seats are held by women. None of these figures are close to 50 percent.

The percentage of women in leadership roles is even lower in the corporate world. A meagre 4 percent of the Fortune 500 CEOs are women. In the United States, women hold about 14 percent of executive officer positions and 17 percent of board seats, numbers that have barely budged over the past decade. The gap is even worse for women of color, who hold just 4 percent of top corporate jobs, 3 percent of board seats, and 5 percent of congressional seats. Throughout Europe, women hold 14 percent of board seats. In the United Kingdom, women hold about 7 percent of executive directorships and 15 percent of board seats among the FTSE 100 companies. These numbers drop to 5 percent of executive directorships and 9 percent of board seats among the FTSE 250.”

This is an excerpt from Sheryl Sandberg’s book  Lean In. I actually bought the book as a Christmas present for a friend – to try and counteract the sexist, religious sub-culture she’s been socialized into – but started reading it pre-wrapping and will definitely buy a copy for myself. Another gem: “Warren Buffett has stated generously that one of the reasons for his great success was that he was competing with only half of the population.”

The stats presented above show that in 2013 we are nowhere near gender-quality, even in the world’s most liberal and progressive democracies. A little closer to home, in the Stellenbosch University Economics Department we have three times as many male professors (13) as we do female professors (4). Of course we can find reasons why this is the case but explanations are not justifications and this is an indictment as far as I am concerned. It’s also in stark contrast to the South African Parliament where almost half of MP’s (45%) are female. We clearly need more and stronger regulations which legislate and incentivise gender equality targets in government, in academia, in business, and in society. Until there is equal representation in the halls of power we will all lose out – men and women, but especially children.

The eloquence of the fake signing man – Sarah Britten

coral

I don’t repost other people’s articles often but this is too good not to – see Sarah Britten’s article on what the fake signing man says about SA politics below. Pritchett talks about this in his new book referring to it as isomorphic mimicry:

“In our conversation, Lant unpacks the problems inherent in what he calls “isomorphic mimicry”: building institutions and processes in weak states that look like those found in functional states. “They pretend to do the reforms that look like the kind of reforms that successful [countries] do, but without their core underlying functionalities,” says Lant. “Instead, countries wind up with all the trappings of a capable system—institutions, agencies, and ministries—without its functionalities.” from here

//

The Eloquence of the Fake Signing Man – Sarah Britten

I won’t lie. A lot of this is bloody funny (read some of the best jokes about it here). The fake sign language interpreter is now a cultural phenomenon, featuring on major US comedy shows and catalysing a new meme.

And yet, at the heart of this, is a terrible sadness. I felt tremendous pity for Thamsanqa Jantjieas I watched him interviewed by Karyn Maughan on eNews. Here was a man cornered, desperate: a man who could see his world falling apart in front of his eyes.

A modern Walter Mitty, he was holding on for all he was worth to his sense of self. I am a man, he said. I am a provider. His wife brought out a blue dustbin bag filled with medication. She looked resigned.

Chutzpah, I had first thought. It turns out that all you need to get past the CIA and an entire phalanx of men straight out of The Matrix is magnificent incompetence. To fake it till you make it next to the leader of the hypocritically free world takes cojones. “I am proud to be South African” said Anton Taylor of Jozi shore.

But the story is so much more complicated. A mentally unstable man with a history of violent outbursts stood a metre away from the most powerful leaders in the world and passed himself off as an interpreter. This was Mr Bean goes to the UN — only it was very serious.

This is what he said. As it turned out, his gibberish spoke volumes.

In South Africa, the signing man told the world, you don’t actually have to know what you are doing in order to get a job. You don’t have to have any ability whatsoever, as long as it looks, to most, as though you can go through the motions — whether you are a teacher, a police officer, a bureaucrat, a government official or (as some have suggested) a state president.

There are those who see through you and complain, but they are ignored. Ours is not a culture of accountability. So one gig leads to the next. You’ve done it before so you get to do it again, because everyone in a position of power agrees that the emperor’s new threads are stylish. You stand there and tell us that the appearance of something becomes more important than the substance of it. Your obvious inability to do your job does not prevent you from getting ahead, until you reach the most prominent stage in the world, and then pretending suddenly isn’t enough. Too many people noticed — too many people who couldn’t just be dismissed because of their politics or race, which is how criticism is normally dealt with.

Thamsanqa discovered that eventually, somebody will see what you are doing, and call you out on it, and there will be nowhere to run. And you will be blamed, and the decision makers who allowed a smaller lie to metastasize into this awful mess will escape censure. Because in South Africa, nobody is ever held responsible — unless you’re low enough down the food chain and lack political connections. Then it’s all your fault.

In his desperate attempts to maintain a facade of functionality in front of the world, as he heard voices and saw angels, Thamsanqa Jantjie said more about the state of South Africa’s current rulers than all the analysts and spin doctors ever could.

He might not have been able to express a coherent word, but the fake signing man turned out to be remarkably eloquent.

Thank you Madiba for changing all the rules

thank you madiba

On the fifth of December 2013 Nelson Mandela died. He was the father of our country and the greatest man it has ever produced. While we all knew it was coming soon, the finality of death and the fact that his presence is no longer with us is truly saddening and has marked the beginning of a time of national mourning, remembrance and reflection. The picture above is a photo I took yesterday at Kirstenbosch Gardens at the Nelson Mandela sculpture which has become one of thousands of places around the country where people have laid cards and flowers in memory of our first democratic president.  This colorful card by Caleb  was such a gem: “Dear madiba I will miss you so much. thank you for changing all the rules, Love caleb.” It’s difficult to provide a better summary than this parsimonious account. Madiba really did change all the rules – the rules of apartheid, the rules of society and the rules of our country, yes, but also the rules we had allowed to govern ourselves – hatred, unforgiveness, discrimination and oppression. Madiba we will always love you. x

I still want to write a post about Madiba and what he means to me and what he represents to South Africa and the world but that will come later. Till then I really liked Maya Angelou’s tribute poem “His Day is Done” and Desmond Tutu’s tribute to Madiba. [Also this awesome flash mob tribute by the Soweto Gospel Choir in Woolies Parkview]

//

Links I liked…

  • “Lant Pritchett on Education in Poor Countries” – an EconTalk podcast (64 min) I am definitely going to listen to. Pritchett is always good and Russ Roberts is an excellent interviewer.
  • Justin Sandefour summarises the findings from an important low-cost-private-school voucher intervention in Andra Pradesh (by Karthik Muralidharan and Venkatesh Sundararaman (o_O) whose full article is available here.
  • Great 2007 article by Deon Filmer: “Education inequalities around the world” – one of the brightest minds in the field. Really important reading.
  • M&G article summarising some of the (encouraging) findings arising from the National Income Dynamics Study (NIDS)
  • My M&G article: “ANA results are not comparable” explaining why the ANA 2013 results are not comparable to previous ANAs or across grades. Banging the same old drum in the hopes that someone is listening!
  • New DBE reports now available online, including one on internal efficiency, macro indicators and the school monitoring survey
  • Interesting and disruptive innovation in Kenya – Bridge International Academy offers a school-in-a-box solution where teachers are trained for 7 weeks and offer scripted lessons in a highly structured and specified way. Most educationists will hate it but I just think to myself – what kind of education would these kids be receiving if they weren’t at these pop-up schools? Sometimes the counter-factual is far worse than even a below-average solution.
  • “How to speak and write post-modern” – I must say I chortled more than a few times.
  • Interesting Economist article on Creationists and Science: “After they hit 18, half of evangelical youngsters lose their faith; entering a public university is especially perilous. As a generation, millennials (those born between the early 1980s and 2000s), are unimpressed by organised anything, let alone organised religion…Recent research (notably cross-species comparisons of gene sequences rendered non-functional by mutations) has greatly strengthened the case that humans and chimpanzees share a common ancestor. A creationist speaker in Baltimore shrugged such discoveries off, declaring that “science changes, but the word of God never changes.”
  • Very interesting – Kagame on Rwanda: “Our thinking is based on people,” the tall, lean president tells This is Africa, from his hotel room on a recent trip to New York. “Investing in our people, what our people are capable of. In national budgets, we focus on education, health, we look at technology, skills, innovation, creativity. We are always thinking about people, people, people.” Rwanda looks to South Korea and Singapore, as well as developed countries, for lessons on “the way they managed their problems throughout history. And the central role played by people is very clear,” the president says. “We try to take all of that to our own needs and we have not been disappointed. You never go wrong by investing in people.“
  • Pritchett quoting an Indian policy-maker: “You guys from the World Bank say you want to help the government of India with our development agenda but then all you want to talk about is poverty, poverty, poverty. Let me point out two things. First, India is a democracy and hence to be the government at all we have to have 51 percent of the votes and we don’t have that many poor voters. Second, once we are the government of India we are the government of all Indians, not just the poor ones, so our agenda has to reflect the aspirations of all Indians. So either you are really helping us with our development agenda or you are just pushing yours.” Wow. Just wow.
  • Two South African education conferences in 2014 that are worth attending – SABEC (31 March JHB) – and SAERA (13 Aug DBN).
Image

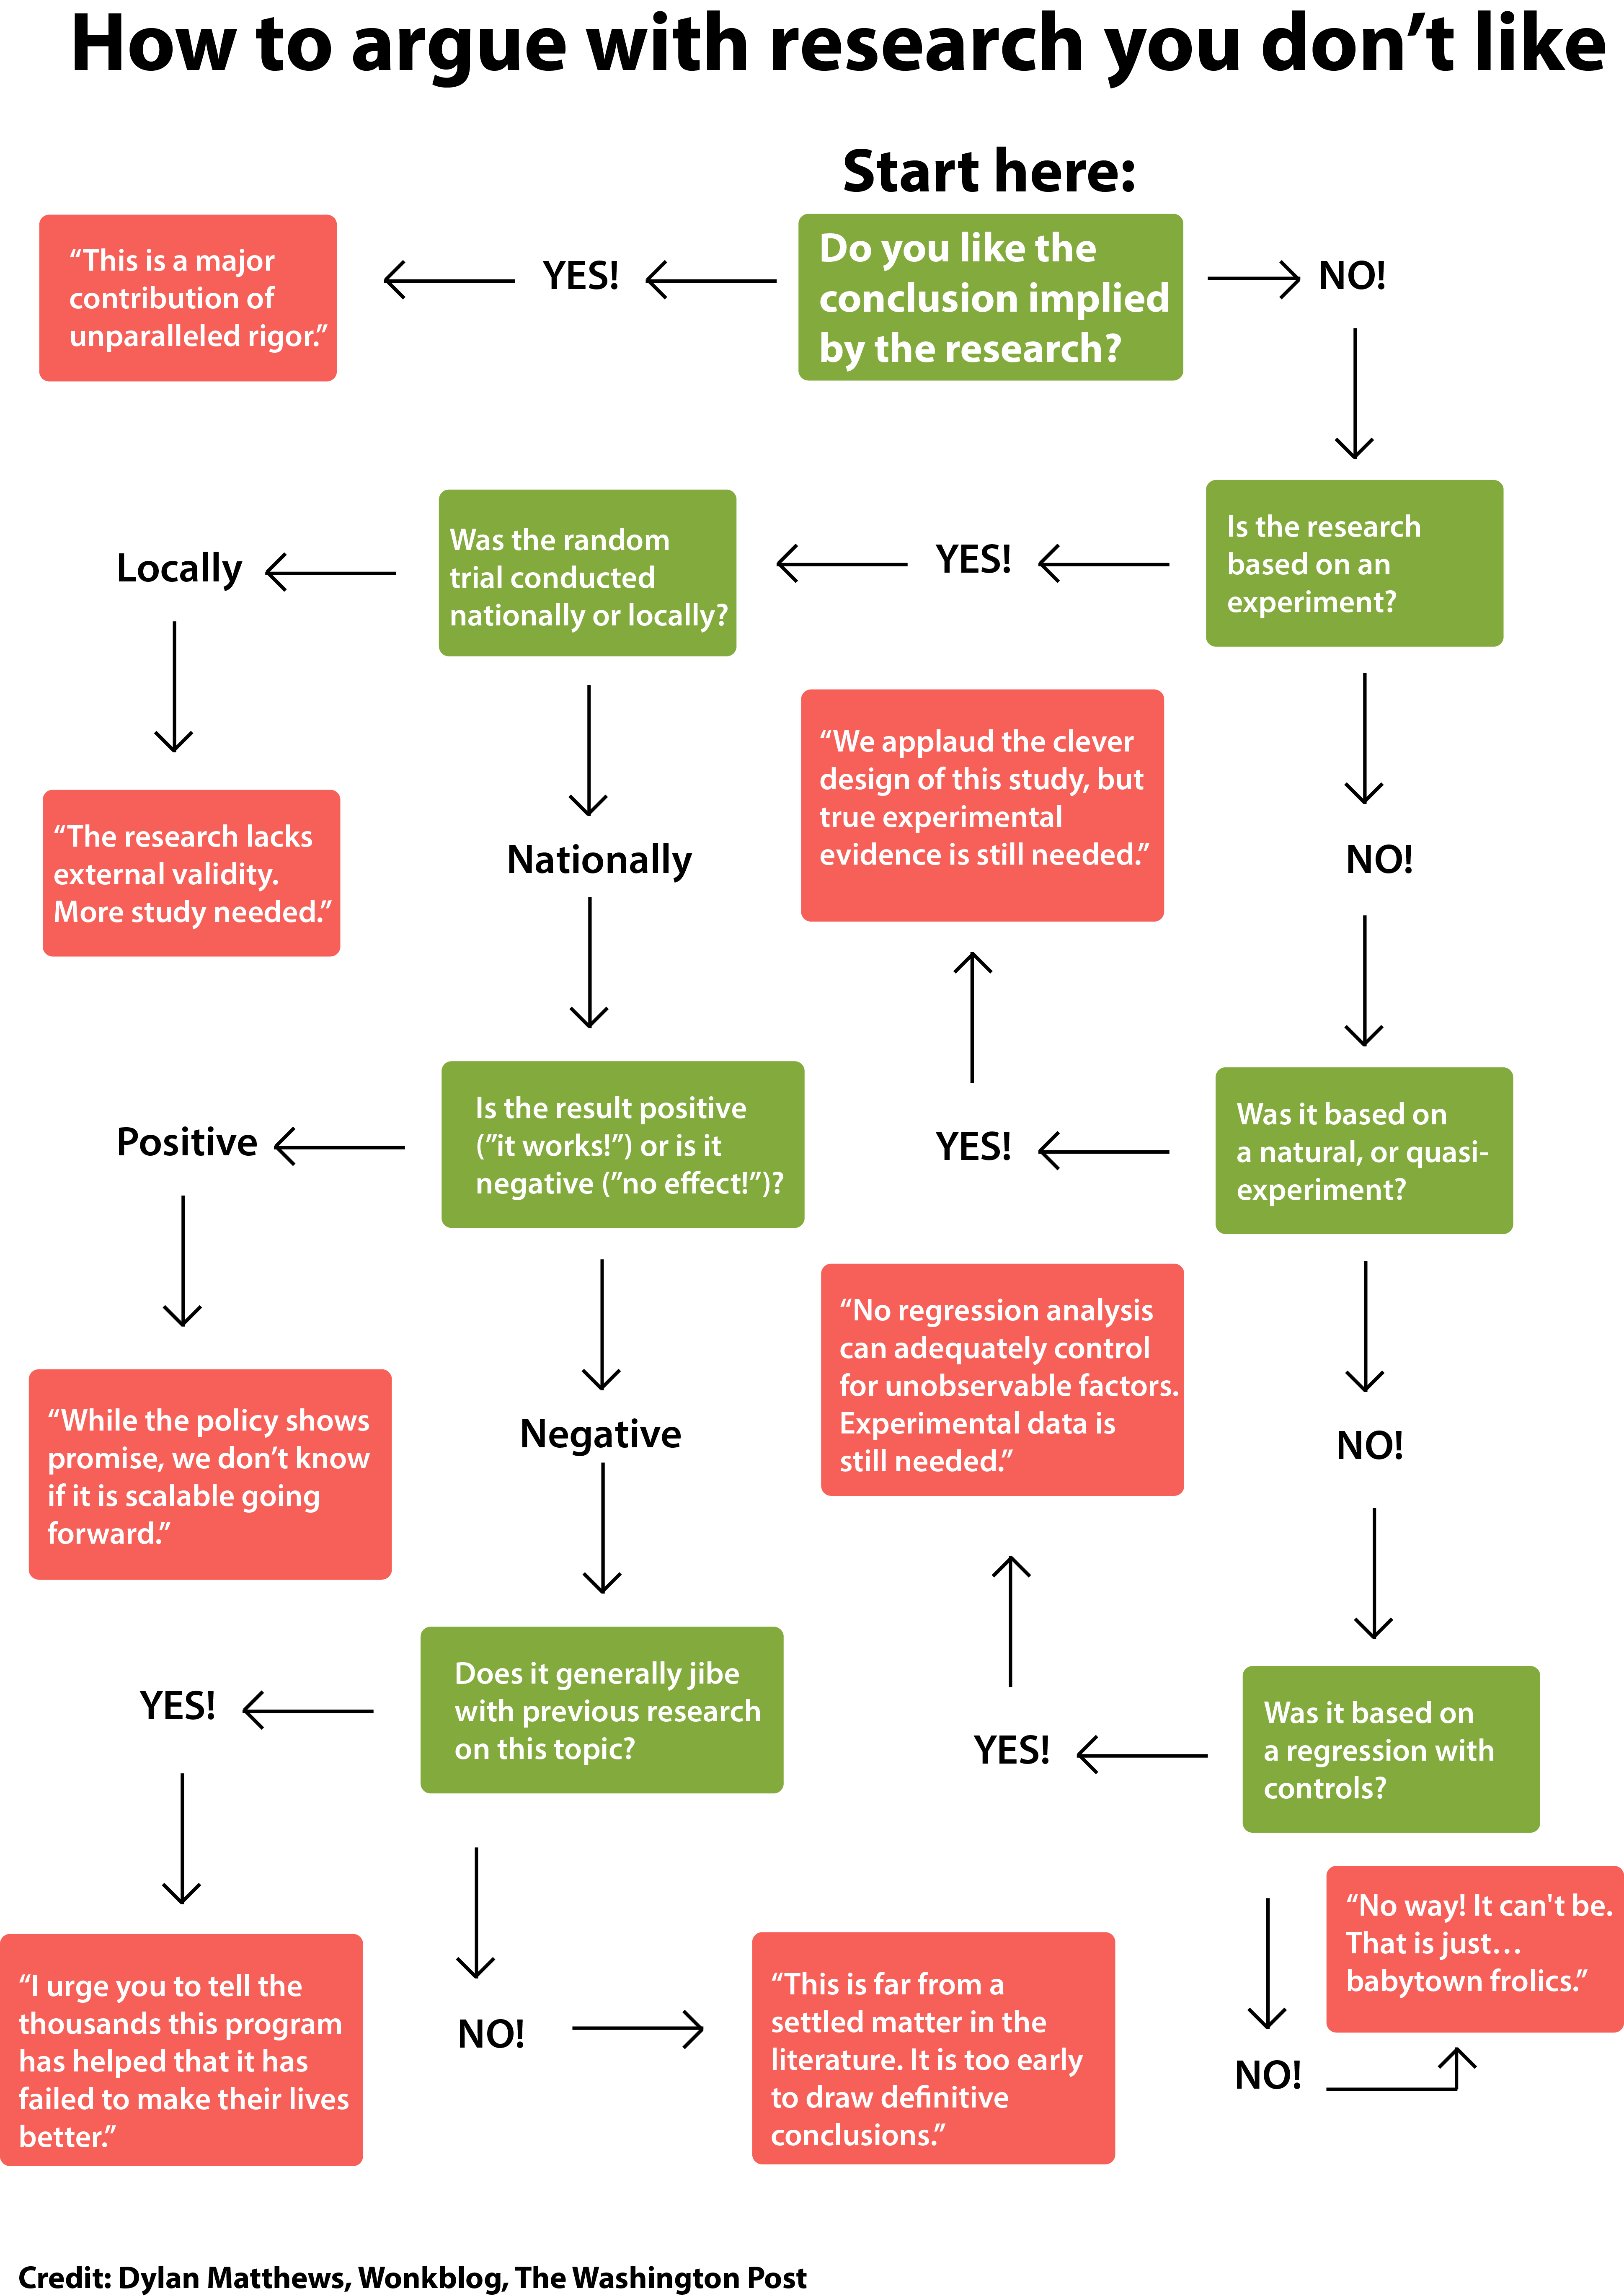
how_to_argue_with_studies1

Why you can’t trust World Economic Forum education rankings

WEF-Logo

The following article should be appearing on the RESEP website sometime today.

//

WEF rankings on education unreliable

Each year the World Economic Forum releases its Global Competitiveness Report which aims to “assess the competitiveness landscape” and “provide insight into the drivers of their productivity and prosperity.” They furthermore claim that this report “remains the most comprehensive assessment of national competitiveness worldwide.” Included in the report is an indicator of education quality where South Africa performs extremely poorly (132 of 144).

 Much of the work conducted at RESEP focuses on education in South Africa, the quality of that education and the links between the schooling system and the labour market. Martin Gustafsson, one of the researchers at RESEP, has looked into the WEF rankings on education and discusses four salient features which explain why the WEF rankings on education are especially problematic.

    1. Understandably, the 2012-2013 Global Competitiveness Report of the World Economic Forum (WEF) has caused a stir in South Africa as, despite a relatively good overall competitiveness ranking (52 out of 144 countries), a few indicators related to government service delivery, in particular education, put the country amongst the worst in the world. Specifically, in terms of the ‘quality of primary education’ we are at position 132 out of 144, in terms of the net primary enrolment ratio we are at position 115, and in terms of ‘quality of the educational system’ we are at position 140. The 2012-2013 report does not really present anything new. The figures in the previous year’s report (for 2011-2012) are very similar.

 2.      With regard to the educational quality indicators, it is important to bear in mind that the WEF does not make use of any standardised testing system in producing its report. Instead, it makes use of an expert opinion approach. In the case of South Africa, six respondents, all from the business sector, are asked to rate the quality of education along a seven-point scale from very good to very poor. One would expect the South African respondents to rate the quality of South Africa’s schooling poorly for a number of reasons. One is that in South Africa we have good data on our educational quality relative to other countries. In particular, TIMSS 2003 placed South Africa last, with respect to Grade 8 mathematics and physical science, amongst the 20 developing countries that participated (the other African countries participating were Botswana, Egypt, Ghana and Morocco). However, there are around 150 developing countries in the world, many of which have very poor information on the quality of their education systems. One suspects that experts in these countries would not rate their educational quality too poorly as they simply do not have the required information. In SACMEQ 2007, South Africa came ninth out of 15 countries in Grade 6 mathematics. It is noteworthy that although Lesotho did considerably worse than South Africa in SACMEQ, its WEF ranking in the quality of primary schooling indicator is 120, against 132 for South Africa. This illustrates the problem with subjective data on a matter which is relatively amenable to measurement.

 3.      With regard to the primary enrolment ratio, it is important to note that UNESCO’s enrolment ratios (the data source for the WEF) are widely regarded as problematic and often not amenable to useful international comparisons due to the fact that UNESCO calculates its ratios using official enrolment totals and official population totals, in other words information from very different data sources. In many developing countries there are strange discrepancies between the two sets of data. The problem for South Africa is that this discrepancy works in the reverse direction compared to most other developing countries. In South Africa, total population figures for children are simply too high compared to the enrolment totals. In most developing countries, the problem is that enrolment totals are inflated. South Africa’s enrolment ratios in the UNESCO reports appear to be relatively poor, but this means nothing and has confused a lot of people. Enrolment ratios derived from household surveys are a lot more reliable and these indicate that South Africa’s enrolment ratios, at least at the primary and secondary levels, are good by international standards. There is an abundance of literature that shows this. The WEF report itself points to the strangeness of the enrolment ratios it uses. According to the report, at the primary level our enrolment ratio is ranked position 115, but at the secondary level it is ranked 53. This raises an obvious question: How can enrolments at the secondary level be relatively good when at the primary level they are poor, yet the former depends on the latter.

 4.      Lastly, World Bank reports now identify 201 countries in the world.

 Part of Martin’s PhD research involved developing a method to compare the performance of countries on different (sometimes non-overlapping) international assessments of educational achievement. His 2012 Working Paper “More countries, similar results. A nonlinear programming approach to normalising test scores needed for growth regressions” can be found here.

“Becoming a man” – Paul Monette [Book reflection]

becoming a man

Last month, while browsing through the second-hand bookstore opposite the Biscuit Mill in Cape Town I came across this autobiography by Paul Monette and quickly added it to the growing pile of books I ended up leaving with. I’m very glad I did. In reading it I’ve had more than my fair share of chortles, tears and chokes – it is as moving as it is funny. I don’t think straight people will find it as meaningful given that it is written by a gay man, to gay people about gay men. Nevertheless, I wouldn’t hesitate to recommend it to anyone interested in either autobiographies or the struggles of gay men in straight America.

When I write, either personally or professionally, I find that my natural style – that which comes most easily to me – is to write polemically with splashes of vitriol. Moderation is not my thing. It doesn’t come easily and with prose it’s no different. There’s a joke in our Department that the bulk of my supervisor’s editing  during the first year of my PhD was simply to delete (or at the very least tame) any adjective I used in reports for government. So where I wrote about “egregious inefficiencies” or ”wholesale ineptitude” this was pacified to “clear inefficiencies” and “systemic capacity deficits”. Words like ‘heinous’, ‘sclerotic’ and ‘unfathomable’ simply had to go, and rightly so I suppose. It would seem that writing in registers is something that is learnt but never taught. In any event I’m getting carried away here. The point is that I loved this book because I identified not only with the content but also with the emotionally-rich prose. Let me give you a chunk from the first page and you’ll know exactly what I’m talking about:

“I speak for no one else here, if only because I don’t want to saddle the women and men of my tribe with the lead weight of my self-hatred, the particular doorless room of my internal exile. Yet I’ve come to learn that all our stories add up to the same imprisonment. The self-delusion of uniqueness. The festering pretense that we are the same as they are. The gutting of all our passions till we are a bunch of eunuchs, our zones of pleasure in enemy hands. Most of all, the ventriloquism, the learning how to pass for straight. Such obedient slaves we make, with such tidy rooms.

Forty-six now and dying by inches, I finally see how our lives align at the core, if not in the sorry details. I still shiver with a kind of astonished delight when a gay brother or sister tells of that narrow escape from the coffin world of the closet. Yes yes yes, goes a voice in my head, it was just like that for me. When we laugh together and dance in the giddy circle of freedom, we are children for real, at last, because we have finally grown up. And every time we dance, our enemies writhe like the Witch in Oz, melting, melting – the Nazi Popes and all their brocaded minions, the rat-brain politicians, the wacko fundamentalists and their Book of Lies…So whether or not I was ever a child is a matter of very small moment. But every memoir now is a kind of manifesto, as we piece together the tale of the tribe. Our stories have died with us long enough. We mean to leave behind some map, some key, for the gay and lesbian people who follow – that they may not drown in the lies, in the hate that pools and foams like pus on the carcass of America.” (p1)

And with prose like that I can’t help but understand his struggle and feel his pain, even as I begin to better understand my own struggles and pains. I think one of the reasons why I was drawn to this autobiography was because it is not only one man’s autobiography, but one particular refraction of a common theme – living as a gay man in a straight world. Yet the plot and narrative also show a clear development and acquired nuance in his understanding of homosexuality – masterfully written to echo his own chronological realizations. What started out as a biological understanding of sexuality, explaining who likes whom and why, morphs into a far more abstract and realistic understanding that being gay is far more than simply sexual preference. It is also a sensibility, a disposition to meaning acquired through socialization and shared experience. Interestingly educational sociologists use the term “orientation to meaning” in their discussions about the propagation of class inequalities in society. It would be interesting to explore this notion with respect to gay meaning-making in contrast to straight meaning-making in a hegemonically heterosexual world.  But again I digress. Monette – a poet by training and profession – is also a brilliant social commentator with the flair befitting his orientation. In his writing he mixes equal parts of self-awareness, sorrow, literary genius and social commentary:

“I don’t come from the past, I come from now, here in the cauldron of the plague. When the doors to the camps were finally beaten down, the Jews of Europe no longer came from Poland and Holland and France. They came from Auschwitz and Buchenwald. But I will never understand how the straights could have let us die like this – year after year, collaborating by indifference – except by sifting through the evidence of my queer journey. Why do they hate us? Why do they fear us? Why do they want us invisible? I don’t trust my own answers anymore. I’m too twisted up with rage, too hooked on the millennium. But I find myself combing the past these days, dreaming dreams without sleep, puzzling over my guys, the gay and the straight and the inbetween. Somewhere in there is a horror of love, and to try to kill the beast in them, they take it out on us. Which is not to say I don’t chastise myself for halving the world into us and them. I know that the good guys aren’t all gay, or the bad all straight. That is what I am sifting for, to know what a man is finally, no matter the tribe or gender.”

And this is where Monette comes into his own – where he reaches the peak of his literary prowess – his visceral descriptions of a life well contemplated. He is not shy to include the sordid details of his sex life, but neither is he shy to expose the heart-ache and insecurity of an approval-seeking narcissist. He helped me to see that all of life is experience – the good, the bad and the ugly. This all stands in stark contrast to the religious dogma of fundamentalists whose petty priorities can only pass for legitimate by masquerading as absolute truth. I still have not managed to reconcile how otherwise intelligent people are so uncritical of the half-baked ideas of their religious superiors.

This book also helped me to realize just how far we are from the just treatment of gay people in society. As an educational evangelist I wonder if we will ever be able to unteach and unlearn the homophobia acquired over generations of prejudice and ignorance. How do you reason someone out of a position they didn’t reason their way into? You can’t. And this is where the parallels with feminism and gender become unmistakable. Contrary to popular belief, all people have received an education about gender. The vast majority receive their education by socialization into a sexist, gendered patriarchal environment. Unfortunately most never realize they’ve been taught or that they’ve learned anything as they continue with their hum-drum lives. For the enlightened few who can think enough and empathize enough to realize that women are truly oppressed – even in ‘liberated’ Western society – the task then becomes how we orchestrate change. Like true economists, those in positions of power realize that it is not good enough to only correct the cloaked-misogynists at the dinner table, but rather that the forces of markets, politics and religion must converge on a new truth – that men and women – heterosexual and homosexual – black and white – are all fully human and thus equally entitled to the full spectrum of rights, responsibilities and opportunities. Until that day we have work to do.

M&G article on testing matric markers

graphic-markers5edit

Today the Mail & Guardian published an article I wrote for them on the issue of testing matric markers prior to appointment. I include the article verbatim below…

Matric assessment misses the mark

22 NOV 2013 10:42 NIC SPAULL

Every year for the past three years the department of basic education has tried — unsuccessfully — to implement competency tests for matric markers. Each year the teacher unions derail these well-intentioned plans, with the South African Democratic Teachers’ Union (Sadtu) raising the biggest ruckus. 

The department’s logic is flawless: the integrity of the marking and moderation procedures of the National Senior Certificate exam depends crucially on the ability of markers to assess student responses accurately. Furthermore, without directly testing the content knowledge and marking competency of teachers one cannot be sure that the quality of matric markers is such that matric pupils receive the marks they deserve.

Importantly, the tests the department proposes would be conducted in a confidential, dignified and equitable manner that would not undermine the professionalism of applicants.

Sadtu counters that all teachers are equally capable of marking the matric exams and thus there is no need for minimum competency tests for prospective markers. This flies in the face of everything we know about teachers’ content knowledge and the pedagogical skills of large parts of the South African education system.

In a 1999 book, Getting Learning Right, Penny Vinjevold and Nick Taylor summarised the results of 54 studies commissioned by the Joint Education Trust, and wrote: “The most definite point of convergence across the President’s Education Initiative studies is the conclusion that teachers’ poor conceptual knowledge of the subjects they are teaching is a fundamental constraint on the quality of teaching and learning activities, and consequently on the quality of learning outcomes.” By implication this includes their ability to mark complex material accurately. 

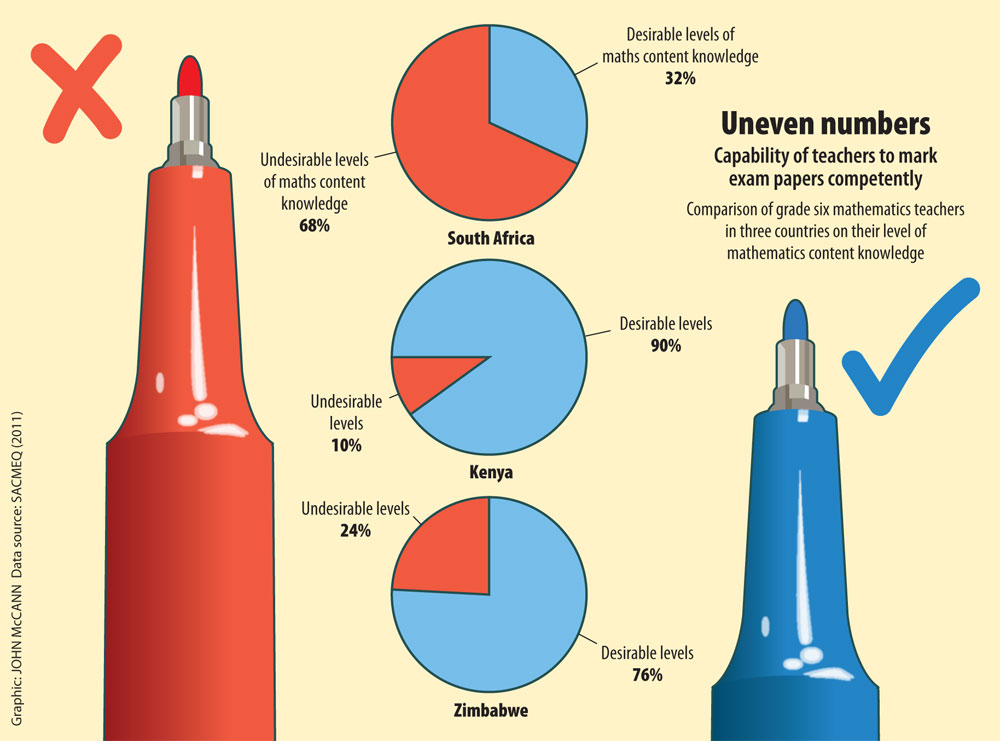
More recently, a 2011 report [p13] by the Southern and Eastern African Consortium for Monitoring Educational Quality found that only 32% of grade six mathematics teachers in South Africa had desirable levels of mathematics content knowledge, compared with 90% in Kenya and 76% in Zimbabwe.

Similar findings
I could go on and mention the numerous provincial studies that have been conducted in the North West, the Eastern Cape, KwaZulu-Natal and elsewhere that all find the same thing — extremely low levels of teacher content knowledge in the weakest parts of the schooling system — which, crucially, make up the majority of South Africa’s schools.

Given this situation, one wonders how Sadtu can argue that all matric teachers are equally competent to mark the matric exams or that they should not be tested. The union stance is that a system of teacher testing will disadvantage teachers from poor schools who cannot compete with those from wealthier schools. Although it is certainly true that the department has failed to provide meaningful learning opportunities to teachers in these underperforming schools, jeopardising the marks of matric pupils to make this stand is misguided, unethical and potentially even illegal.

These are important but separate issues and should be dealt with in different forums. But it is worth noting that the Western Cape has been testing prospective matric markers in the province since 2011, the only province in the country to do so.

The logic of the unions on this matter is perplexing. On numerous occasions they have rightly argued that teachers in poorer schools have not had meaningful learning opportunities and, therefore, that teachers are unequally prepared to teach, and by implication also unequally prepared to mark. Yet now they are arguing that all matric teachers are equally capable of marking the matric exams? So which is it? You can’t have it both ways. They either are or are not equally competent to mark matric exams. If it is the former, one cannot ensure children will receive the marks they are due; and if it is the latter, then one simply cannot argue that teachers should not be assessed prior to being appointed as markers.

On this question, a colleague of mine asked the following question: “How does the department employ people to teach matric when they are not considered competent to mark?” The uncomfortable answer is that, unfortunately, many matric teachers are neither competent to mark nor to teach — and this is because of no fault of their own. The blame instead falls squarely at the feet of the department, which has not provided them with quality professional development opportunities.

If one looks at the specifics of appointing matric markers, the union objections become even more bizarre. Although all matric teachers are legally allowed to apply to be matric markers, who is appointed and the criteria used for making these appointments are solely at the department’s discretion. Provided that these criteria are aligned with the position and are not discriminatory on such grounds as race, gender and sexual orientation, the department can select whomever it decides is most capable of doing the job.

Selection criteria
Currently the selection criteria relate to qualifications, teaching experience and language proficiency, but — bizarrely — not content knowledge. Given the nature of the work — assessing student responses for grading purposes — it seems only logical that applicants should be able to demonstrate this competency prior to being appointed for possessing it.

Because of the importance of the matric exam’s results for the life chances of individual pupils both in terms of further education opportunities and labour-market prospects, the department should put its foot down and take a stand for the 700 000 or so part-time and full-time students who are writing matric this year: it should insist that the 30 000-odd matric markers be tested prior to appointment.

Pupils, parents and school governing bodies have every reason to be concerned when there is no formal testing process to ensure that the teachers who will mark their all-important matric exams have the competence to do so in a consistent, fair and unbiased manner. Whether or not competency tests for matric markers are implemented has nothing to do with the unions and everything to do with the fairness of the marking and moderation procedures.

In sum, should prospective matric markers be tested prior to appointment? Yes. Is this a union issue? No. Will this be the last we hear of it? Unfortunately not.

Nic Spaull is a researcher in the economics department at Stellenbosch University. His education-focused research can be found at nicspaull.com/research. Follow him on Twitter @NicSpaull

**Regarding the infographic above, while the stats are correct the textbox on the right stating “capability of teachers to mark exam papers competently” is a little misleading since the test assessed only the content knowledge of Grade 6 mathematics teachers, not their marking competence per se. That being said, they are obviously linked. No harm no foul 🙂

School Monitoring Survey 2011 (aka Depression laced with hope)

school monitoring survey

The Department of Basic Education has recently released the report on the School Monitoring Survey of 2011 which surveyed 2000 public ordinary schools with the aim of monitoring progress towards the goals set out in the Action Plan to 2014. Let me warn you that it makes for depressing reading – even for those familiar with how bad things really are. Really. While the results are truly atrocious/shocking/abysmal (we are running out of adjectives to accurately describe the South African schooling system) there is one ray of hope that comes from all of this. It’s not so much the contents of the report – the only thing hopeful in the report are the school feeding stats! – but rather the fact that the report itself was commissioned (surprise #1) and then that it was actually released (massive surprise #2). If we try and walk in the DBE’s moccasins for three days, as the Native American saying on empathy goes, we would realize that this takes commitment, resolve and leadership. To commission a survey that will certainly reveal damning information, but information that is necessary for improvement, is the first step. But to realize that public discussion, transparency and accountability are all integral parts of democracy and progress is something else altogether. That is truly and honestly something to celebrate and a big break with the denialism of previous Ministers of Education. Kudos to those involved! But before you crack out the champagne read the bulleted summary of the report below. Actually, mid-day drinking is probably the most rational response to findings like these…        

  1. Only 69% of schools had all allocated teaching posts filled (highest in the Northern Cape: 78%, lowest in the North West: 58%).
  2. Of the 60 hours of annual professional development that teachers should have done by the time of the survey, the South African average was only 38 hours (Western Cape: 60 hours, Limpopo: 30 hours).
  3. Percentage of educators absent from school on an average day was 6% nationally, 8% in KwaZulu-Natal and 3% in the Western Cape.
  4. Of Grade 6 learners nationally, only 7% had done at least 4 exercises per week (the minimum standard) for language and 31% for Maths. Of Grade 9 learners nationally, only 1% met this requirement for language and 6% for Maths.
  5. Of Grade 6 learners nationally 83% had access to a Maths textbook and 78% had access to a Language textbook. For Grade 9 the figures were 83% for a Maths textbook and 68% for a Language textbook.
  6. Only 57% of students in South Africa were in a school that had either a central school library, a mobile library or a classroom library (Western Cape: 89%, Limpopo: 30%)
  7. Only 48% of schools had a School Governing Body that met the minimum criteria for effectiveness.
  8. Schools receive different per-learner subsidies from the State depending on if they are from the poorest 20% (Quintile 1), the second Poorest 20% (Quintile 2) etc. Quintile 1 learners get allocated R905 while Quintile 5 (richest 20%) get R156. Nationally 47% of students were in schools that were funded according to the minimum level (Western Cape: 95%; Mpumalanga: 10%).
  9. Only 55% of schools have minimum infrastructure needs (Gauteng: 90%; Eastern Cape 33%). Minimum infrastructure needs are defined as having running water, working electricity, fenced school premises, separate toilets for boys and girls, and separate toilets for teachers.
  10. 86% of south Africa learners received a free school meal every day (Western Cape & KZN: 81%; Limpopo: 94%). In Quintile 1, 2 and 3 schools, 96, 95 and 91% respectively were found to have a National School Nutrition Programme (NSNP).
  11. 87% of schools were visited at least twice a year by a district official for monitoring or support purposes during the year (Western Cape: 99%; Eastern Cape: 74%).
  12. Only 34% of principals rated 50% of more of the district support services as satisfactory (Gauteng/Western cape: 63%; Eastern Cape: 24%).

 When we think of what these kind of findings mean for things like social mobility, chronic poverty and the personal dignity of the poor and marginalized it would seem the only reactions are anger and despair.  God help us.

Seeing things as they are

see things


  • Carol Paton writes a helpful summary of some of the findings from the NSES book “Creating Effective Schools.” Read it if you consider yourself informed about SA education. Take the “What are policy-makers doing?” things with a pinch of salt – I don’t have time to go into why some of those ‘remedies’ or ‘responses’ aren’t as impressive as they sound. Some are legit though 🙂
  • Crazy hectic typhoon hit the Philippines – before/after GIF showing just how much devastation there was. So sad.
  • After watching this TED talk I am more convinced than ever that I am a 100% feminist. Actually 110%. If you’ve never done a course on gender or even thought about it, watch this 30min talk by Chimamanda Ngozi Adichie – she is humorous, insightful and eloquent, proclaiming what will be such an obvious truth in the future – that we should all be feminists.
  • How much is a professor worth? – NYT article comparing the relative salaries (in PPP) across the world (SA ranks pretty high 🙂 – via Johan Fourie
  • Concise M&G article on the state of learning deficits in South African education – “Too little, too late condemns pupils” by @Victoria_JohnMG – nice article about part of my CDE report.
  • A few weeks ago I got my first experience of live television as part of CNBC Africa’s panel discussing education in South Africa – see here. I could get used to this #JustSayin
  • The paper I wrote with Stephen Taylor for Save The Children is now available online: Trends in Effective Enrolment: Measuring Access and Basic-Quality Improvements in Education for Nine African Countries 2000-2007 (perhaps we should’ve thought of a more concise title?!)
  • Got a cool idea for social change through education and technology? Shuttleworth Foundation fellowships are now open (deadline 1 May 2014)

Media coverage :)

Mud schools, no lights or electricity, overcrowded. Madelene Cronjé


This should be going up on the RESEP website sometime today – just a summary of media coverage of my CDE report:

RESEP researcher’s education report receives media attention 

A recently published research report on the state of the South African schooling system over the 1994-2011 period has received widespread media attention over the last month. The 65-page report titled “South Africa’s Education Crisis: The Quality of Education in South Africa 1994-2011” by RESEP researcher Nic Spaull was commissioned by the Centre for Development and Enterprise (CDE). One newspaper highlighted the low levels of teacher content knowledge discussed in the report (City Press: “Grade 6 pupils beat teachers at maths“). The Mail & Guardian focussed on the learning deficits that children acquire which prevent further learning at school: “For pupils who fail to grasp basic maths and reading skills in their early years, learning deficits accumulate over time until they eventually become ‘insurmountable.’ Similarly, The Times identified the high levels of grade repetition and automatic progression that plague the South African system: “Just because a child proceeds to a higher grade does not necessarily mean that he is learning. In the absence of proper standardised exams, the links between progression and real learning are very weak. This is the case in South Africa.” Nic also discussed the report on PowerFM, CapeTalk and CNBC Africa.
The report included sections on the inequality of learning outcomes in South Africa, as well as learning deficits, teacher content knowledge, matric outcomes, and transitions from school to work. The report concludes with a set of policy recommendations including 1) making the Annual National Assessments reliable, 2) implementing a nation-wide system of minimum-proficiency diagnostic teacher testing and capacitation, 3) increasing accountability at all levels of the system, 4) increasing the technical capacity and implementation ability of the Department of Basic Education, and 5) set realistic goals that focus on the universal acquisition of basic skills.
Nic’s research can be found here and the full report can be downloaded here.

Cultural loci and African intellectuals…

star-wars-pop-art1

A little while ago a friend of mine and I were discussing the recent increase in the number of countries and American States that have now legalized gay marriage or are in the process of doing so. I argued then, and maintain now, that this increase will continue indefinitely in a monotonic fashion and will most probably also accelerate after reaching a tipping point sometime in the next decade. My friend, being the sensible lad that he is, agreed that this does seem to be an increasing trend rather than just a momentary spurt, but also suggested that perhaps the tolerance and acceptance of gay marriage is really just a function of economic power which is clearly changing and that perhaps the new powers won’t be as tolerant. The economic trajectory of the West is plateauing even as BRIC countries find their feet and begin their speedy ascent. Interesting, I thought, since the changing of the guard could well mean a change in norms and values, and China and Russia (!) certainly do have a different set of values to the U.S on a variety of things, including gay marriage. But the more I got thinking about this I realized that we are nowhere near the zenith of the West’s power and influence as a hundred different examples easily show. I think if we did a global survey of brands, TV shows, celebrities, intellectuals, politicians etc., we would find the West dominates the list by 100 to 1. Of course there are some celebrities from India and Brazil that we all know – Ashwaria Rai, Tendulka, Pele, Ronaldo etc., but I can’t think of any Chinese or Russian celebrities offhand? Does that make me a bad person? Am I just a consumerist cog in the capitalist American machine succumbing to exploitation by patriarchal imperialists?! OK, perhaps a little. But the point remains that the West, and within it largely America, set the tone for the world. Economically yes, politically, yes and most important for this current discussion, America is the global trend-setter and the cultural locus of the world. A cultural version of America sneezing and the rest of the world catching a cold. Chinese elites wear American clothes and aspire to American symbols of status, wealth and power. American elites do not aspire to Chinese anything as far as I can tell. American cultural influence (and more generally Western sensibility) is here to stay, as far as I can tell. Something I am quite happy about as far as gay marriage is concerned.

The reason why I like thinking about these types of questions is that they come back to broader ones about modernization and westernization. In Africa especially, it is difficult to find textbook examples of countries that have managed to modernize rather than Westernize. I think this is probably because the path to Westernization is so well sign-posted and well travelled, with trains leaving every hour on the hour heading towards a clearly articulated and visible goal. In contrast, the path to African modernization in an African way is like bundu-bashing towards a mirage that no one has really seen before. Does the Utopian vision of an African Renaissance include things like democracy, capitalism and gender-equality? Or are these just un-African Western impositions? Some say that Africa needs these things but it needs Africanised versions of them. OK great, but how do you decide what to keep and what to scrap? Inevitably people end up asking: “Why don’t we just adopt the whole package? They look pretty happy over there in America, let’s just do what they do?” What’s good for the goose is good for the gander, no? If you dig a little deeper there are many reasons why we can’t and shouldn’t “just do what they do” ranging from national pride, personal dignity and cultural heritage, all the way to linguistic diversity and genuine social, economic and political freedom. But the only people capable of formulating and articulating the African ideals to which Africans can aspire are African intellectuals. They are necessary catalysts. Unfortunately they are in short supply. Where did all the Khama’s and Mandela’s and Nyerere’s go? Where are our 40-year-old public intellectuals challenging Western ideas and (importantly) proposing African one’s to fill their place? We have a few big mouths that love to bash the West but don’t fill the vacuum that their criticism creates. Perhaps they do exist and I don’t know about them? If you know of any young, inspiring African intellectuals please write a comment and post a link to some of their work. This is one time I hope to be wrong…