Category Archives: Education

NEEDU 2013: Moving from Form to Substance (Guest blog post: Gabrielle Wills)

lines

NEEDU 2013: Moving from Form to Substance

Guest blog post by Gabrielle Wills

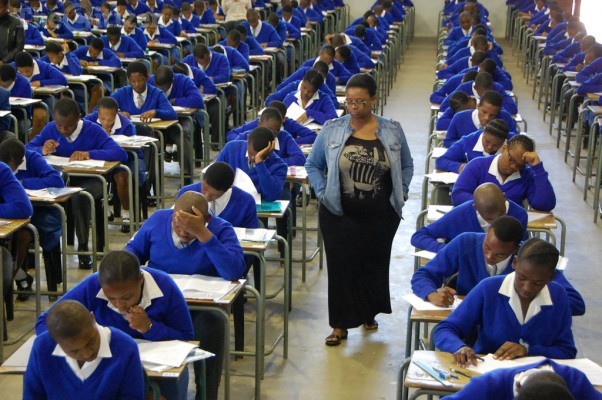
The NEEDU 2013 report entitled “Teaching and Learning in Rural Primary schools” has finally entered the public domain. Subsequent to the release of the first NEEDU 2012 report, sensational headlines in the press presented certain findings that were isolated from the wider objective of the report. This potentially misrepresented both the objective of the report and the much needed role of NEEDU, which (as its name suggests) is the national evaluator of education. It is no surprise then that the 2013 report has been withheld from public view, delaying constructive dialogue and systems thinking that will emerge out of this insightful material. Compared with the press’ responses to the release of NEEDU 2012, media reporting has been somewhat less damaging in its representation of the findings this time round. However they have still not conveyed the most pertinent messages of the report. This article is intended to direct the reader to the report’s substance.

Before considering the details, a noted conceptual contribution of the report is this: it moves towards being systemic in its evaluative approach, even when considering individual elements that make up the whole. In Lant Pritchett’s book “Rebirth of Education” he draws on Howard Gardener’s (1991) evocative phrase, arguing that we live with an “unschooled mind” about systems. Many activities and research undertaken in the field of education and education economics are modular, focusing on aspects or isolated interventions without considering how these link together within the wider system. NEEDU 2013 moves beyond just a discussion of just individual symptoms of a broken system, of which we are becoming acutely aware (for example poor teaching content knowledge and absurdly low levels of learning in the classroom), getting closer to the institutional inefficiencies that must be addressed before we can move forward.

Much of the discussion of the report is framed under two headings: accountability and instructional leadership. The first is a term with which most economists are well-familiar (and our education system far less so). However the notion of ‘instructional leadership’ is used in the education administration literature, usually in reference to school leaders and the extent to which they organise the school environment to focus on the core business of the school, namely learning. The report extends this terminology to wider administration at the district, provincial and national level to consider that the management of curriculum, assessment and resources will have a strong bearing on learning improvements.

“Instructional leadership may be thought of as the ensemble of processes, operating at different levels of schools, and directed towards leading the system to improved quality (NEEDU 2013, pp 13)”.

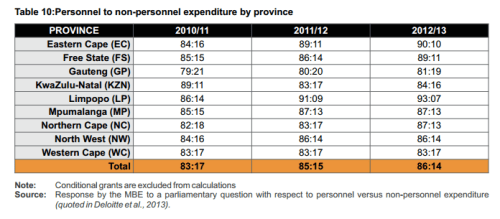
One of the most important processes within this ensemble is the management of human resources and particularly the post provisioning process, recruitment and promotion, and professional development. “HR management is the single most important tool available to PDEs (provincial directorates of education) in giving effect to curriculum policy. It provides the tools for the optimal deployment of the costliest and most important resource, educators.” The discussion draws our attention to how provinces have lost control of the post provisioning process, which has the largest budgetary implications for the department (and arguably national spending). The provincial personnel-non-personnel spending split should be 80:20 but has become increasingly skewed towards personnel, impeding on the system’s ability to deliver non-personnel resources to schools.

Screen Shot 2015-12-10 at 4.13.09 PM

Without discipline in spending, the stability of provincial departments to execute functions is severely threatened. This has far reaching consequences for system functionality. It follows that the first three recommendations of the report, and rightly so, are that post provisioning norms and standards need to be unambiguously communicated and applied where strengthening education management information systems aids this process. It also highlights how the process of post provisioning and the recruitment and promotion of personnel must be removed from the influence of the predatory behaviour of organised interest groups.

Strongly related to instructional leadership, the report raises the importance of monitoring and evaluation required within education. However, much of what is being done in this regard takes on a ‘form’ of these things yet lacks any substance. This quotation sums it up well:

“.. in large parts of the system and with respect to a number of instructional leadership processes, both systems management and teachers are going through the motions, with little impact on the objects of their attention… Activity does not necessarily signify progress: there is a great deal of instructional leadership activity throughout the system, but much of it is undertaken at too superficial a level to make any impact on the quality of teaching and learning If going through the motions is the first step towards effective instructional leadership, then engaging with the substance of the activities is the next (NEEDU 2013, pp 48).”

 This is an acutely important observation. In reading recent Annual Plans and Annual Reports prepared by the DBE there is great deal of activity and forms of monitoring taking place. In many ways, some activities have been admirable and NEEDU 2013 directly acknowledges such successes. Yet many activities are divorced from the objective of improving learning. Consider the following examples:

  • The quality of management in school is being monitored using perfunctory checklists of certain documents such as school improvement plans (SIP) and up-to-date records. But the majority of schools have a SIP and documents can readily be organised and kept up to date even in the presence of incompetent leaders. What is required is hiring the best leaders, on the basis of expertise not years of service or political affiliation. What is required is monitoring their performance using proven instruments of assessment rather than a checklist of activities accomplished.
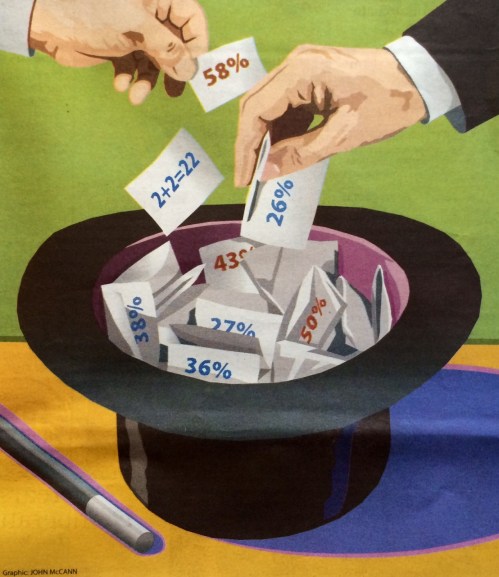
  • There is no doubt that the introduction of ANA has signalled a major step forward in monitoring whether the system is working. However these are neither standardized tests in the sense that year-on-year comparisons are possible, nor are the majority of schools and districts using these effectively to identify learning gaps. ANA is a form of monitoring yet currently lacks substance in influencing learning or even simply monitoring systemic progress.

While focusing on institutional inefficiencies, NEEDU 2013 does not shy away from obvious problems of addressing teaching in the classroom. In recommendations five and six, the need for a roll-out of a proven reading and writing programme as well as primary numeracy and mathematics programme is expressed. Recommendation nine focusses on addressing teacher proficiencies through educational development, calling for considerable investigation into the teacher education sector and whether it is equipping graduates with necessary competencies. Despite great intentions to improve education and accompanying strategies, it is currently not possible given inherent capacity constraints of both teachers and administrators.

The time of window dressing activities that hide systemic weaknesses has continued for too long. We must move away from forms of activity that mimic best practice while neatly steering away from threatening fundamentals on the surface. Systemic weaknesses must be seen and acknowledged for what they are, and action taken to address them. In this regard, the recommendations of the report should be strongly considered.

________

Gabrielle Wills is a PhD candidate at Stellenbosch University and is part of the RESEP team. Her latest research is titled “A profile of the labour market for school principals in South Africa” which she presented at a conference earlier this year (PPT here).

Assessing oral reading fluency – some resources for teachers and researchers

reading ORF

Over the past year I have been doing some research on oral reading fluency (ORF) with Kim Draper (CDE) and Elizabeth Pretorius (UNISA). The journal article version of my paper with Kim should be available later this month in the SAJCE but you can read a Working Paper version here and the abstract at the end of this post. Lilli and I are in the process of submitting our article to journals so there is no version currently available, but there should be one early next year.

reading fluencyFor those who are unfamiliar with oral reading fluency, it is the speed at which written text is reproduced as spoken language, or put more simply, it is how quickly and accurately you can read aloud. It is one of the components of the “Big 5” which originated in the National Reading Panel in the US. Although this is a fundamental component of reading, it is rarely assessed in South African schools.

The way one usually goes about testing oral reading fluency is to sit down with a student 1-on-1 and ask the student to read a specific passage aloud. While the student is reading the passage the assessor times the reading and also follows the text on her own copy of the passage, marking any errors. At the end of the reading, or after one minute (depending on how one is administering the test), the assessor records the time, totals the number of errors and then can calculate a score called “Total Words Read Correctly Per Minute” or WCPM. This is calculated as the total of all the words in the passage up to where the student was at one minute, and then subtracting the total number of errors to give Words Correct Per Minute. Given that the same passage is used for all students this method creates a measure that is comparable across students or schools.

In 2013 the National Education and Evaluation Development Unit (NEEDU) conducted a study where they tested the oral reading fluency of 1772 Grade 5 students (all English Second Language students) from 213 schools in rural areas. The results of that study can be found here. Kim Draper and Nick Taylor were the lead researchers on this project.

A few days ago a principal from a primary school in South Africa emailed me to ask if there were any books that I would recommend that he reads over the holidays (for those interested I recommended this book and this one). But it reminded me that it would be helpful to post a link to the oral reading fluency assessments that NEEDU used to test the grade 5 students in their 2013 sample. That way other researchers can use the same tools and compare their results to those of NEEDU, and also so that primary school teachers can see how to assess oral reading fluency, with the aim of doing their own oral reading fluency assessments. So here they are 🙂 – all the materials used by NEEDU are available in THIS appendix. That includes the two reading comprehension passages, the questions associated with them and the instructions to the ORF assessors.

For those who want to assess first language English speakers or to assess other grades, I would also recommend looking at the “Florida Assessments for Instruction in Reading: Ongoing Progress Monitoring, Oral Reading Fluency Grades 1-5” which has a number of passages for each grade.

If you’re a teacher or a researcher and have conducted your own oral reading fluency assessments, I’d love to hear about how you did it, what lessons you learned, if the materials are available online etc. Please post any comments or links below.

//

Abstract:

The ability to read for meaning and pleasure is arguably the most important skill children learn in primary school. One integral component of learning to read is Oral Reading Fluency (ORF), defined as the ability to read text quickly, accurately, and with meaningful expression. Although widely acknowledged in the literature as important, to date there have been no large-scale studies on ORF in English in South Africa, despite this being the language of learning and teaching for 90% of students from Grade 4 onwards. As part of the National Education and Evaluation Development Unit (NEEDU) of South Africa, we collected and here analyze data on 4667 grade 5 English Second Language (ESL) students from 214 schools across rural areas in South Africa. This included ORF and comprehension measures for a subset of 1772 students. We find that 41% of the sample were non-readers in English (<40WCPM) and only 6% achieved comprehension scores above 60%. By calibrating comprehension levels and WCPM rates we develop tentative benchmarks and argue that a range of 90-100 WCPM in English is acceptable for grade 5 ESL students in South Africa. In addition we outline policy priorities for remedying the reading crisis in the country.

Martin Gustafsson on “Higher education policy challenges”

Higher_Ed_and_Sustainability_980x444

In the past three months South African higher education has come into full focus thanks to efforts of students in #FeesMustFall, #OpenStellies, #RhodesMustFall and others. The article below was written by one of RESEP’s researchers, Dr Martin Gustafsson, and first appeared in Business Leadership South Africa’s newsletter. I’ve highlighted the sections I think are most important to note…

Higher Education Policy Challenges – Dr Martin Gustafsson

“I recall a prominent person from organised business declaring some years back at a meeting that the business sector in South Africa had essentially withdrawn from the education policy discourse to avoid conflict with government. Instead, the sector had turned its attention to easier, less controversial areas of involvement, such as partnerships with individual education institutions and bursaries for promising students. This is not a good approach. Smaller projects can make a difference, but policy matters and it is something to which business should pay more attention. Business is well placed to provide policy advice in areas where it is strong: unit costs, cost-effectiveness, trade-offs between priorities and efficient management.

What are some of the difficult policy questions in what has recently become a volatile higher education sector?

Low public spending on higher education has been in the spotlight. This spending comes to 0.6% of GDP, compared to around 1.1% for comparable countries. The problem relates more to low student numbers than low spending per student. If we use countries at South Africa’s level of development as our benchmark, UNESCO education statistics suggest that our public spending per student should be 12% higher, while the number of students should increase by 30%. Current pressures to spend more per student are justified, but this should not be allowed to slow down the growth we have been seeing in enrolments.

Of course growing the sector is not just about enrolling more students, but also about a higher ratio of graduates to enrolments. What in South Africa is referred to as low ‘throughput rates’ – essentially high levels of dropping out and repetition – are commonly considered a core problem. We would be in a better position to respond to this problem if we understood it better.

Low throughput rates are not a peculiarly South African phenomenon. Similar patterns are found in many countries, which suggests that shifting the numbers is not easy. An Organisation for Economic Co-operation and Development (OECD) report on dropping out at tertiary level indicates that around 53% of students enrolling for a degree in the United States do not attain the degree. The Council for Higher Education has found the figure to be a rather similar 55% in South Africa. For the OECD as a whole, however, the figure is a better 31%. My own analysis of household data suggests that the ratio of degrees obtained per year to the number of full-time equivalent students, the graduation rate is around 1:7 for South Africa and Brazil.

So what are the circumstances of around half of our university students who do not complete a degree? It is difficult to obtain an overall picture. Sample-based household surveys, such as Stats SA’s Labour Force Survey are of limited use partly because the students in question are a small percentage of the population, and because there are no questions relating to tertiary-level dropping out. Longitudinal surveys conducted by universities or faculties can tell us a bit, though they do not provide a national picture. By far the most commonly cited reason for dropping out is financial constraints. However, students’ academic results and their ability to find funding are closely linked. If their results are poor, it is more difficult to renew funding. Yet the data we have indicates that the tragedy of academically well-performing students who drop out mainly due to funding reasons is substantial. It is a tragedy for the individual, but also for the country’s development, given the skills shortfall in the labour market, and it is bad for the attainment of workplace equity targets.

The OECD report warns against an all-or-nothing approach of classifying all drop-outs as failures and a manifestation of wasted effort. Even an incomplete university education is likely to improve an individual’s wage prospects and productivity in the workplace. It is in the interests of business to advocate for and fund more rigorous research on, for instance, the relationship between wages and the actual range of higher education outcomes which includes non-completed graduates.

The policy debates should be informed by accurate estimates, which exist, of the graduate unemployment rate. This rate is relatively low, and lower than what is suggested by some figures which have been quoted, including figures from an inaccurate January 2012 article in The Economist.

An unfortunate blind spot in our strategies for expanding the university sector is the lack of attention paid to the role of private universities. Countries such as China and Brazil, which have expanded their university enrolments even faster than South Africa, have succeeded in doing so partly through carefully thought out policies governing the emergence of more private universities. Such universities need not be elite relative to public universities, and there are ways of dealing with the risk of sub-standard educational quality offered by unscrupulous institutions.

Brazil’s strategy for combatting low-quality private universities and poor quality higher education at public institutions, is unusual and fascinating. Final year undergraduate students must write, apart from examinations set by the university, a short discipline-specific nationally standardised test which allows the national authorities to gauge which universities are clearly not teaching their students the basics. Moreover, aggregate test results are publicly available, putting students and their families in a more informed position when they select a university. Marcelo Rezende, in an article in Economics of Education Review, argued that the system has helped universities to focus on producing quality graduates.

Two institutions other than the universities are critical for building a better higher education system. Problems in the National Student Financial Aid Scheme are at the core of the 2015 unrest in the sector. The recommendations of the official 2010 review report remain relevant today. Secondly, without further educational quality improvements in the schooling system, the expansion of universities will be difficult. The National Development Plan’s key strategy for improving schools, paying attention to school principals – specifically their hiring, functions, remuneration and performance contracts – is a sensible one.

//

On the issue of school principals I would strongly recommend following the work of Gabrielle Wills, a PhD student at RESEP who has done some very innovative and useful research on principals and leadership in South Africa. For example see her 2015 Working Paper “A profile of the labour market for school principals in South Africa” which she presented at a conference earlier this year (PPT here).

How #FeesMustFall relates to SA schooling – my Sunday Times article

money ed

[Below is the full and slightly extended text of my Sunday Times article awkwardly titled “While the rich get education, SA’s poor get just ‘schooling’” [8/11/2015]

Looking back on the last 30 days in South Africa you cannot help but conclude that the issue of university exclusion on financial grounds has struck a nerve in the national psyche. There are not many issues in our country where there is universal consensus across issues of race or class, and yet this is one of them.

Deserving students should not be excluded from university because their parents cannot afford the fees. This is unjust, unsustainable and unacceptable as almost everyone now agrees. How we will pay for this is another story – and one that deserves attention – but we all agree that rationing access to limited university positions cannot be based primarily on parental income. Yet, this is exactly what happens in South African schools.

If you can afford to send your child to a former Model-C school or a private school, there is no question about it, you do! I am willing to bet (and AfricaCheck please follow up on this) that there is not a single member of Parliament who sends their child to a no-fee school in our country. Not one. It is an unspoken truth that no-fee schools are for the poor and ‘good’ schools are for the rich. To put this in context, no-fee schools make up the vast majority ranging from 66% to 88%* of schools (depending on if you ask students or principals respectively), and almost all of them are dysfunctional in that they do not impart to students the necessary knowledge, skills and values needed to succeed in life. There are at least 10 different independently conducted nationally-representative surveys attesting to this.

The problem here is two-fold: (1) Most parents cannot afford the fees at these schools since they are frequently as high as university fees (R31,500 per year), and (2) there are very limited places in these schools. Of the 25,741 schools in South Africa only 1,135 are former Model-C schools and 1,681 are independent (private) schools. Put together that accounts for only 11% of total schools. Even if we abolished fees in all these schools – and I’m not sure that is the way to go – you cannot fit 12 million children into 2,816 schools!

I completely agree that a system where access to quality schooling is almost exclusively a function of parental wealth (i.e. our current system) is unjust and must change. But purely from a numbers perspective we simply have to find ways of improving the quality of the 88% of schools that are already no-fee. Thinking about South African schooling as a zero-sum game where there is fixed number of ‘good’ schools will not get us very far.

Why do we have fees?

The reason why we have public schools that charge fees is that policy-makers at the time of the transition were afraid (probably correctly) that if they abolished fees in public schools, all white teachers and white students would go to private schools and we would be stuck with mostly white private schools and exclusively black public schools. Allowing these former white-only schools to charge fees was the trade-off for preventing that outcome. To try and prevent a system that was split entirely on ability to pay, the Constitution declares that no child can be denied admission to a school because his/her parents cannot pay fees.

Yet this is exactly what happens in the majority of cases. How is it that the majority of fee-charging schools manage to maintain a student body drawn primarily from that small subset of the population that can pay fees? Presumably by excluding the ones that can’t pay fees, in formal and informal ways. After speaking to some of the principals of these schools – many of whom are incredibly dedicated and committed to social transformation, I am not under any illusion that there is a simple answer to this or that these are not well-meaning individuals who are trying to maintain a high-quality of education on a very tight budget. Yet the reality remains – . The rich get access to universities and well-paying jobs while the poor get menial jobs, intermittent work or long-term unemployment.

According to the Quarterly Labour-Force Survey of 2014 the South African labour market can be split into four groups with the proportion of the working age population in each group included in brackets:

  • Unemployed (broad definition, 35%),
  • Unskilled (domestic workers and elementary occupations; 18%)
  • Semi-skilled (Clerks, service-workers, shop personnel etc.; 32%)
  • Highly-skilled (Legislators, managers, associated professionals; 15%)

The tragic reality in South Africa is that if your parents are in the ‘top’ part of the labour market (the 15%) then you send your children to the ‘top’ part of the schooling system (which charges fees). That gives your children access to university and to that same ‘top’ part of the labour market that you are currently in. If you are in the ‘bottom’ part of the labour-market (the 85%) then the only schools that you can afford and that are available are the second-tier no-fee schools. However, these schools are of an extremely low quality and the only way to get access to university is in spite of them (with a dedicated teacher or an extremely hard-working student) not because of them. In fact grade 8 students attending fee-charging schools (quintile 5) are two to four times more likely to qualify for university than those attending no-fee schools (quintiles 1-4).

Yes there are exceptions to all of the above. Fee-charging schools do admit some students (perhaps 10-15%) that cannot pay fees, and some that pay partial fees. They also offer scholarships and bursaries. Similarly there are some extremely poor no-fee schools that succeed in spite of the odds – often because of a resilient principal. Yet these are exceptions to the rule or apply only to a small minority.

While the education crisis that South Africa finds itself in has its roots in the apartheid regime of institutionalized inequality, this fact does not absolve the current administration from its responsibility to provide a quality education to every child in South Africa not only the rich. After 21 years of democratic rule most Black children continue to receive an education which condemns them to the underclass of South African society, where poverty and unemployment are the norm, not the exception. This substandard education does not develop their capabilities or expand their economic opportunities, but instead denies them dignified employment and undermines their own sense of self-worth.

In short, poor school performance in South Africa reinforces social inequality and leads to a situation where children inherit the social station of their parents, irrespective of their own motivation or ability. Until such a time as the Department of Basic Education and the ruling administration are willing to seriously address the underlying issues in education, at whatever political or economic cost, the existing patterns of underperformance and inequality will remain unabated.

*The 88% figure is calculated using the 2015 Q1 DBE Masterlist and only counting as ‘fee-paying’ those schools that were categorised as “No” for ‘NoFeeSchool’. It is not clear what the fee status is of the schools that are currently listed as “To Be Updated” and “Not Applicable”. For conservative estimates I would go with 66% from the Action Plan (see pg50 here). The figures for the number of ex-Model C schools were also taken from the 2015 Masterlist – see “ExDept”. 

 //

Dr Nic Spaull, from the Research on Socio-Economic Policy group at Stellenbosch University, is a contributor to the South African Child Gauge 2015, which focuses on youth and the intergenerational transmission of poverty. The publication was/will be released this week by the Children’s Institute, University of Cape Town and is available on www.ci.org.za.

  • My @Powerfm987 interview on the Child Gauge 2015 where we spoke about education, reading by age 10, school fees and inequality, teacher training, priorities and whether or not government is working with researchers in education (short answer: yes, but probably not enough)

My opening remarks at the OR Tambo Debate and an afterword…

comb

On the 7th of July the Wits School of Governance together with the OR Tambo Foundation and the UNDP hosted the 4th debate in their series. The title was “Implementing the NDP: Achieving Basic Education Goals”, focussing specifically on accountability. I was on the panel, together with Sizwe Nxasana, the Minister of Basic Education Angie Motshekga and Siphiwe Mthiyane. Melissa King and Barbara Dale-Jones wrote an overview of the event for the M&G and you can read that here. I include my opening remarks and one or two comments below.

“Let me start by saying that I have immense admiration and respect for Minister Motshekga. I don’t think there is a single person in this room that is so naïve as to think that your job is easy or uncomplicated. Or that the solutions are straight-forward. In the face of an ongoing crisis in education you have worked systematically and consistently to improve the system by getting the basics in place. And indeed there have been some improvements and signs of success that we should acknowledge and to some extent also celebrate.

Let me highlight the 4 most impressive achievements as I see them.

  • Firstly, we now have a solid well thought-out curriculum that has widespread buy-in from all stakeholders- CAPS. We should not change the curriculum.
  • Secondly, everyday 9 million children receive at least one free school meal and this is paid for the by the State.
  • Thirdly, each child from grades 1 to 9 receives 4 high-quality workbooks per year – 2 for maths and 2 for language. These structure the curriculum by week and provide lessons for teachers to teach.
  • Lastly, we now have national tests – the ANAs – that test children in grades 1-9 in mathematics and languages. With the exception of the census this is the largest single data collection exercise undertaken by government of South Africa. It is colossal

In light of these achievements it is prudent to ask why it is that myself and others continually use the word “crisis” or more accurately an “an on-going crisis” when we refer to our education system. It is not because we are ignorant of these achievements or that we do not appreciate their scale and scope, we do. Rather we use this term because it is the only one that reflects the gravity and severity of the picture we find when we look at the nationally representative datasets in education. Let me give you some examples:

  • At the end of Grade 4 more than half of our students cannot read for meaning and interpretation and a third are completely illiterate in any language.
  • 61% of our grade 9 students did not know that three fifths was equal to 0.6.
  • 76% were not minimally competent in maths or science in grade 9 – that do not know about whole numbers or basic graphs. They are 3-4 years behind the curriculum.
  • Or if we look at the matric pass rate – that much touted, publically celebrated statistic that is also deeply flawed as a barometer of the system, last year that figure was a respectable 76%. But if we look at 100 students that started school in 2003, only 49 actually made it to matric in 2014, only 37 passed and only 14 qualified to go to university. So the ‘real’ matric pass rate is 37% not 76%.
  • And while 14% qualify to go to university, only 10% will actually go to university and only 5% will get a degree. So of 100 kids that start school, only 5 will get a degree. 60 will get absolutely nothing – not a matric pass, not a certificate, not a degree. Nothing!
  • In one study comparing the North West and Botswana, at the end of the year our maths teachers had taught only 40% of the maths lessons they were scheduled to teach, compared to 60% in Botswana.
  • According to an education report by OECD released this year SA ranked 75/76

Still in 2015 – 20 years after democracy the reality is that most Black children in South Africa continue to receive an education which condemns them to the underclass of South African society, where poverty and unemployment are the norm, not the exception. Where 10 million people live on less than R10 a day. This substandard education does not develop their capabilities or expand their economic opportunities, but instead denies them dignified employment and undermines their own sense of self-worth and agency. In short, poor school performance in South Africa reinforces social inequality and leads to a situation where children inherit the social station of their parents, irrespective of their motivation or ability. Low quality education becomes a poverty trap that is virtually inescapable. This is the antithesis of social mobility. It is unacceptable. It is morally despicable. It is also unsustainable.

So how does all of this relate to accountability and this debate? I would argue that almost all of these problems relate to 2 issues: a lack of accountability, a lack of capacity. Too many people cannot do their jobs and have not received meaningful support and training. For too many people – teachers and bureaucrats alike – there are no consequences for non-performance.

Accountability is not, (or should not be) a vague concept. Accountability is another word for consequences. When there are no consequences for non-performance there is no accountability. It isn’t complicated. Currently there are no consequences for non-performance. Not for teachers, not for principals, not for district officials, not for union leaders, not for bureaucrats, not for DDGs. No one. I must add a caveat that I do not believe you can hold people – especially teachers – accountable for things they cannot do. Capacity precedes accountability. This is why we have to offer our teachers meaningful learning opportunities (which we absolutely have not done) before we can hold them accountable for performance. Absenteeism, misconduct etc. by all means, but if a teacher in rural Limpopo cannot do fractions because she was given inadequate training under apartheid and token in-service teacher training post-apartheid, we cannot speak about accountability for her until she has been given a meaningful learning opportunity. Then we can talk about accountability and board exams and all that but only then.

I believe that the major cause of both of these problems is (1) the politicisation of the civil service and the practice of cadre deployment among bureaucrats and teachers, (2) the networks of patronage that permeate our system, (3) The unhealthy relationship between parts of SADTU and the Department of Basic Education – nationally and provincially, particularly in the Eastern Cape.

This all works to the detriment of quality education for the poor. Minister I honestly believe you have done a lot to improve our education system and you are the best education Minister we have had so far, but two areas where you have not succeeded are ending cadre deployment and developing a comprehensive plan for meaningful teacher development.”

[End of opening remarks]

In what was meant to be ‘closing remarks’ for the debate, the Deputy Minister of Education Mr Enver Surty, attempted to discredit most of what I was saying by arguing, at length, that all of this data I was using was “outdated” and on the contrary that “We have a good story to tell.” For those of us who are specialists in using education data, who are professional researchers adept at  using cross-national education data, who work with it daily and present on it at local and international conferences, this rebuke came as somewhat of a surprise. To set the record straight it is worth emphasising four points: (1) education systems do not change rapidly in the space of 2 or 3 years, see chapter 4 of this paper (2) The TIMSS and PIRLS studies were done in 2011 but the report and data were only ready and released in 2013, 2 years ago. (3) The ANAs are not substitutes for these rigorous inter-temporal comparisons – see here, here, and here. (4) Apart from a 1.5 grade-level improvement in the TIMSS 2002–>2011 maths and science improvement there is no other evidence that the educational outcomes in South Africa have improved. I do not have any reason to distrust the TIMSS improvement, but it’s important to remember just how low the post-improvement level of performance really is and that starting from an exceptionally low base this is not that unexpected at all. I am more than happy to expound any of these points in detail and at length if they are still unclear. This is what I do.

Although it was unfortunate not to have a right-of-reply after the Deputy Minister’s misinformed ad-hominem attacks, I am not particularly concerned because the data and consequent research base speaks for itself. It is clear, unambiguous and well documented. I maintain that we have an ongoing crisis in education and that poor children continue to be condemned to hereditary poverty as a direct result of the low quality education they receive at school. Poor quality education was and is a poverty trap. This should be our biggest source of national shame.

Who watches the watchmen? SADTU, SACE and the insidiousness of corruption

watchmen

In the first or second century AD the Roman satirist Juvenal asked “Quis custodiet ipsos custodes?” which translates to “Who will watch the watchmen?” or “Who will guard the guards?” – a pithy quote about where ultimate power does or should reside, and highlighting that all are corruptible. The latest manifestation of this seems to be with the South African Council of Educators (SACE). On their website they explain that “SACE is the professional council for educators, that aims to enhance the status of the teaching profession through appropriate registration, management of professional development and inculcation of a code of ethics for all educators.” Unfortunately this is, at best, an aspirational Facebook status.

My first encounter with SACE was during a Section 5 Committee meeting of the SA Human Rights Commission (I am on the advisory committee for education). As part of an investigation into corporal punishment at schools we requested that officials from both the Department of Basic Education (DBE) and SACE attend the meeting and answer our questions. In that investigation there were numerous instances of corporal punishment, I have even heard of one instance of a 9 year old girl that was “disciplined” by the principal and ended up dying in hospital a little while later. As part the same investigation there were numerous stories emerging about some teachers and principals sexually assaulting their students. This was especially offensive to me and became the issue I asked the DBE and SACE about when they were at the meeting. As it turns out, if a teacher is dismissed for sexually assaulting a student – which is very rare (being dismissed that is) – they should be struck from the SACE roll so that they cannot get another teaching job in South Africa. Unfortunately this is just how it works in theory, not in practice. In practice what usually happens is that the provincial education department (who is the employer) dismisses the teacher and will not rehire them at another school in the province. However, during the investigation – and after many explicit questions – it emerged that the provincial education departments do not share a common database of registered or disbarred teachers, either with each other, or with SACE (whose database systems are totally shambolic). So there is nothing stopping this dismissed teacher leaving the province where they sexually assaulted a student and moving to another province where they can be employed as a teacher. There are no electronic records that are available to either the receiving province or the receiving principal. I distinctly remember the awkward shuffling and sheepish looks when I asked the DBE official: “Please can you be explicit and tell us if there are any functional systems currently in place that prevent a teacher who has been dismissed for sexual misconduct from being rehired by another school in another province?” To which the answer was “Our databases are not currently linked so that is theoretically possible, yes.” Which obviously shocked everyone at the Section 5 Committee meeting.

That was the first sign to me that SACE is a totally dysfunctional institution that is all form and very little function. The most recent, and even more disturbing revelation is that it seems that this institution has been captured by the major teacher union SADTU. Sipho Masondo reported in the City Press last week that in October last year the DBE and SACE launched separate investigations into the allegations that SADTU officials were selling teaching and administrative positions (see here for the detailed and damning expose). The DBE’s investigation, headed by a friend of mine Prof John Volmink, is yet to be finalized and released. However, Sipho’s article reports that  “a source within the SACE, who spoke on condition of anonymity, told City Press that Sadtu’s executives approached the council’s chief operating officer, Tsedi Dipholo, and asked her to drop the investigation after the names of the union’s leaders in branches, regions and provinces started cropping up.” – something that she readily complied with. Promptly after this the investigation was wrapped up, has never been released and found no wrong-doing whatsoever. SACE CEO Rej Brijraj explains that “We spent four months investigating. There was a very strong rumour that persisted, but we couldn’t find a single bit of evidence. The rumours were strong, but no evidence or witnesses were brought forward for us to prosecute. We were given leads, but they yielded nothing and we had to stop.

Both of these instances, depicting incompetence and corruption respectively, deserve our serious attention. SACE is the body that is supposed to be regulating the profession and preventing disrepute and degradation, yet it is the very organization that is complicit in this degradation.

We need to ask: Who will watch the watchmen? Who will regulate the regulators? The Minister of Basic Education Angie Motshekga should request a Ministerial Task Team to look into the functionality of SACE and whether it actually can or does accomplish what it is mandated to do. But, and this is crucial, it is not good enough to simply order a task team, you actually have to do something with the results. When and if the Volmink report is actually released the biggest question I have is “So what?” What happens to the findings and recommendations? Probably the same thing that happened with the Limpopo textbook enquiry – a little more investigation here, a little staff shuffling over there, but essentially no consequences. This is perhaps one of the biggest issues facing our education system – the lack of accountability – i.e. the lack of consequences – in our education system. The process of writing this blog post has given me sufficient energy to edit some of my opening remarks for the OR Tambo Debate which I will publish as a blog post now…

In all of this we need to remember who is most affected by this widespread ineptitude and corruption in the education system. It is the poor, mostly Black African, children of South Africa that are condemned to lives of poverty and unemployment, no different to their parents and care-givers. That is the real tragedy here.

[Guest blog-post] Takalani Sesame

[Below is a guest blog-post written by Lerato Nomvuyo Mzamane of Takalani Sesame. I usually don’t allow unsolicited guest blog posts but I really liked Takalani’s innovative way of engaging with children on serious issues in playful ways. I also watched Takalani as a kid 🙂 I especially like their development of an HIV-positive muppet (Kami) to help inform children about HIV and destigmatise children and adults who are HIV-positive, and the translation of some of their programs into African languages. I’ll let Lerato tell you a little more about their current innovations… ]

image_1

Research-Informed & Data-Driven Children’s Television Goes Online: The Takalani Sesame Approach

– Lerato Nomvuyo Mzamane

Inform, improve, measure … repeat. This research philosophy operates across all Sesame Workshop productions, including Takalani Sesame. Sesame productions reach 156 million children daily in more than 150 countries making it the world’s single largest informal educator. Since 2000, the Takalani Sesame education team has contributed to the pool of more than 1 000 studies worldwide that Sesame Workshop has conducted over its 40-year existence.

Takalani Sesame regularly undergoes formative assessments, finding out what young children are learning and what they like. We incorporate their feedback. Some changes defy adult preferences and challenge professional experiences, but that’s alright because we have a focus: the most important voice is the child’s.

Being a data-driven show, Takalani Sesame gathers significant amounts of information from its target markets. In addition to our core audience (3 to 7 year olds), groups that matter are their grown-ups (parents and teachers) and their older siblings (highly influential others).

Where is Takalani Sesame active?

While best known for being a television programme, Takalani Sesame is also broadcast on radio, and there are regular outreach events in the communities we serve. We aim to reach children in every way possible, including through the most up-to-date technological ways. Most recently, we expanded our digital footprint by launching a dedicated YouTube channel alongside our two websites, social media identities and instant-messaging efforts.

The Takalani Sesame YouTube channel (www.youtube.com/channel/UCSOzE3-7BQn7GtiftoiIRsg) is updated regularly and features episode segments in five languages – Sepedi, Afrikaans, isiZulu, Tshivenda and English. These are bite-size “edutainment” offerings that not only embrace multilingualism, but also help to further the educational mandates as outlined by our stakeholders and partners – the Department of Basic Education (DBE), Sanlam, the South African Broadcasting Corporation (SABC) and Sesame Workshop.

image_2

How is our target market using digital?

To understand our digital visitors better, we spent time in rural and urban crèches and primary schools. There were expected confirmations: more capable cellphones are getting more affordable and our lowly paid teachers are buying them; as the line between feature phones and smart phones narrows, mobile capabilities are advancing faster than some users can keep up with; data remains too pricey for many, even the employed, so free instant-messaging services and lower-cost internet usage dominate; and, the digital divide is also about age and younger educators are more aware of what is possible than older educators.

Case Study: Road Safety in South Africa

When Takalani Sesame piloted a road-safety initiative, the project team undertook research at several levels:

  • A literature review of road safety locally and abroad;
  • Focus groups with parents, teachers and community members before material development;
  • Preliminary testing of drafts at a volunteer school using retired teachers as data collectors;
  • Assessments after teacher training to see what could happen when development is rolled out at scale; and,
  • A monitoring and evaluation component by an independent entity.

All that before we could introduce the initiative to South Africa.

image_3

The transfer of knowledge applies across all our platforms. We’ve produced supplementary textbooks, educational materials, outreach programmes, literacy projects and many other initiatives tailored to the needs of the communities we serve.

Case Study: HIV/Aids Awareness Among Children

As part of our launch of the HIV-positive muppet Kamogelo (AKA Kami) in 2004, independent researchers confirmed that a child who has watched Takalani Sesame is four times more likely to have some knowledge of HIV/Aids than a child who hasn’t. Parents and educators who watched our television special “Talk to Me”, were twice as likely to talk to their children about HIV/Aids than those who had not watched it.

A national survey commissioned by the Nelson Mandela Foundation further showed that our young viewers demonstrate measurable gains in HIV/Aids knowledge and attitudes, including basic knowledge of the disease, blood safety, de-stigmatisation, and coping with illness.

image_4

[Image credit: Sesame Workshop]

Supporting the DBE’s White Paper on e-Education

In addition to wide research and market studies, Takalani Sesame leans on its partners for a universe of data and policies. This is especially true of the partnership with the Department of Basic Education (DBE).

A case in point is our embrace of the DBE’s White Paper on e-Education. We have taken up the mandate for Takalani Sesame to live in digital spaces. In 2013 we introduced a fun website [www.takalanisesame.co.za], a Facebook page and a Twitter handle @LoveTakalani. In 2014, we unveiled a special parenting, teacher resource and information-based website for educators and parents [www.earlychildhood-takalanisesame.co.za] and this year we’ve added the YouTube channel to further extended our digital footprint.

image_5

The big reveal during our most recent site-based digital-behaviour information gathering exercises was that a popular service was the e-publication of research and policy papers. We intentionally select practice-focused scholarship and this seems to be paying off.

Interestingly though, we found we spent most of our grassroots excursion time teaching teachers how to use their feature and smart phones. And once they figure out how to go online, wow…

//

Lerato Nomvuyo Mzamane is the Senior Multimedia Executive at Ochre Media, co-producers of Takalani Sesame and producers of many other groundbreaking programmes. She is a mother, teacher and activist with 30 years of experience in over 20 countries.

How to raise the ‘real’ matric pass rate [my Africa Check article on Matric 2014]

matric 2

[This article first appeared on Africa Check on the 13th of January 2014]

The release of the 2014 matric results last week followed the now familiar routine of focussing primarily on the pass rate and how it changed, both nationally and provincially.

The notion of the matric pass rate is one that is deeply rooted in the South African psyche and seen as perhaps the most important indicator of education in the country. This is extremely short sighted.

The public, and it would seem the Minister as well, believe that if the pass rate goes up then the quality of education is improving, and if it goes down then this is an omen of deteriorating quality, or – as was the case in 2014 – due to some other factor like a change in the curriculum.

The problem is that the matric pass rate is a function of the students that actually reach and write matric. More and more commentators and critics are beginning to understand why the pass rate seen in isolation is problematic and in many instances misleading.

To illustrate; of 100 students that started school in 2003, only 49 made it to matric in 2014, 37 passed and 14 qualified to go to university. The pass rate is calculated by dividing the number of students that pass matric (37 of the 100) by those that wrote matric (49 of the 100), yielding 76% in 2014.

However, a more appropriate measure would be to calculate what proportion of a cohort that started school 12 years ago passed matric – what some people are calling the ‘real’ matric pass rate or the throughput-pass-rate. That would be about 36% for 2014, down from 40% in 2013.

(For those interested in the actual numbers the calculation is 403,874 students who passed matric in 2014 divided by the 1,085,570 students that were enrolled in grade 2 in 2004. I use Grade 2 figures as the proxy for the true size of the starting cohort because there is excess grade repetition in Grade 1, leading to an overestimate of cohort size if one uses Grade 1 enrolments.)

 As a nation with a skills shortage and a below average proportion of youth that complete upper secondary school, we should be very concerned that there were fewer students reaching and writing matric than last year.

The table below shows that although there had been a general increase in the throughput rate from 2010 to 2013, the rate came down in 2014. This year there were 29,252 fewer matric candidates than in 2013. Part of this is that 2014 was a smaller cohort than 2013, but the lower throughput rate is also part of the story.

Table 1: Students writing and passing matric relative to initial cohorts at public ordinary schools only (Education Statistics at a Glance and Matric 2014 Technical Report)

  Grade 2 students 10 years earlier (i.e. in 2000, 2001, 2002, 2003, 2004) Students writing matric in 2014 Students passing matric in 2014 Traditional matric pass rate Throughput pass-rate from grade 2 to matric (proportion of grade 2’s 10 years earlier who passed matric)
2010 1,071,053 537,543 364,147 68% 34%
2011 925,761 496,090 348,117 70% 38%
2012 992,797 511,152 377,829 74% 38%
2013 1,087,933 562,112 439,779 78% 40%
2014 1,085,570 532,860 403,874 76% 37%

What causes fewer students to reach matric in one year relative to the previous year? It could be external changes that affect cohort sizes (like the change of age-of-entry policy in 1999). But it can also be through the direct actions and influences of principals, teachers and district officials. Given the attention and emphasis on the matric pass rate (for schools, districts and provinces), there are a number of people who have an incentive to ensure that the matric pass rate goes up, irrespective of how this is achieved.

For example in October 2014 the MEC for Basic Education in Gauteng, Panyaza Lesufi, explained to his district officials that “Any district that drops, even if it’s by 0.01 percent, before you give me the results, put the resignation letter on top.” This kind of approach to the matric pass rate introduces severe unintended consequences like teachers encouraging weaker students to leave school or repeatedly failing them in grade 11. Or, as was the case in some schools in the country, resorting to cheating and conspiring with students. I am all for more accountability in education in South Africa (including in the bureaucracy), but what exactly can a district official do in October to improve the outcomes in matric one month later? By all means set performance targets, but set the right ones. Like measuring the throughput pass-rate from grade 8 to matric, a far more sensible metric to use for accountability purposes (i.e. what proportion of grade 8 students in 2010 passed matric in 2014 relative to the throughput pass rate the previous year?) This is not an especially new argument. Nick Taylor, the CEO of the National Education Evaluation and Development Unit (NEEDU) commenting in 2011 explained the tension between quantity and quality as follows:

“Because the pass rate is a ratio consisting of two numbers—numbers of passes as a fraction of numbers of candidates—it can be improved by changing either or both these quantities. In the period 1999 to 2003 the one that was changed was the number of candidates: fewer children were given the opportunity to write matric whereas the number of passes stayed about the same. The result was that the pass rate went up and the government claimed victory… Ironically, although the 1999 to 2003 period received public approval for its increased pass rate, this was a period of declining quality that was achieved in two ways: encouraging candidates to register at the easier standard-grade level and lowering standards by making the examination papers easier, focusing largely on cognitive skills of an elementary nature at the expense of the higher-order processes of analysis and interpretation. In short, improved efficiency can be achieved by restricting opportunity or by compromising quality, or both, and this is what happened at the time.”

In light of the above statistics, it seems logical to ask not only how many students drop out (answer: 550,000), but also why they drop out. Perhaps the most comprehensive analysis of dropout is the article by Dr Martin Gustafsson titled “The when and how of leaving school.” In it he explains the reasons why South African students drop out, and in which grades they do so. Household surveys show that when youth are asked why they dropped out of secondary school, the four most prominent reasons were (1) lack of financing, (2) wanting to look for a job, (3) failing grades, and (4) pregnancy (for female learners). I would like to focus briefly on the last of these – pregnancy as the major cause of dropout for female students.

In 2010 there were 480,157 female students enrolled in grade 8, but by matric 2014 there were now only 289,795 female students. So 190,362 dropped out between 2010 and 2014. We know from household surveys that that 42% of female students that dropped out of school listed pregnancy as the reason. So a few back of the envelope calculations reveals that 79,952 female students dropped out of school between 2010 and 2014 because they fell pregnant (a figure close to the Department’s own estimates). This cause of dropout for girls is well defined and relatively well understood.

Despite being against policy, excluding pregnant students from school is widely practiced in South Africa, both formally and informally. In 2008 and 2009 school governing bodies at Welkom High School and Harmony High School in the Free State adopted pregnancy policies for their respective schools that allowed for the automatic exclusion of any learner from school in the event of her falling pregnant. In July 2013 the Constitutional Court ruled that this was unconstitutional and that pregnancy policies which exclude pregnant girls from attending class are prima facie a violation of pregnant learners rights to equality, basic education, human dignity and privacy.

While this cause of dropout primarily affects female learners, the fact that it is so well defined and measurable means that it is highly actionable from a policy perspective. There need to be better advocacy campaigns directed at youth – about sex, contraception, teenage pregnancy and the constitutional right to education of pregnant students. But there also needs to be tighter enforcement of policies that prevent unfair discrimination against pregnant girls. Perhaps most importantly the Department needs to develop workable solutions to facilitate the re-integration of school-age mothers after giving birth.

Decreasing pregnancy related dropout is likely to make a large dent in the 550,000 students that drop out of school before matric. Of course there are larger causes of dropout – notably the low quality of primary and secondary education and the lack of vocational opportunities – but these are notoriously difficult to understand and remediate. The fact that so little is done to firstly prevent teenage pregnancy, secondly to support pregnant learners, and thirdly to re-integrate school-age mothers, means that there is huge potential to improve the educational outcomes and life chances of thousands of girls in South Africa, and decrease dropout in the process.

//

For further reading on matric see the following articles:


Education woes go far deeper than matric pass rate [my Sunday Times article on Matric 2014]

matric2-602x400

[This article first appeared in the Sunday Times on the 11th of January 2014]

It’s at times like these that I sympathise with the Department of Basic Education and Minister Motshekga. Like the Goldilocks problem, it seems that nothing can be ‘just right.’ If the matric pass rate goes up, then standards are falling, but if it goes down then interventions are failing. Yet with the new, more rigorous CAPS curriculum we did expect the 2014 matric results to come down slightly. Yet there are many other problems we should be discussing. This year, as with previous years, not enough official attention was given to the high dropout rate. Of 100 students that started school in 2003, only 48 wrote matric in 2014, 36 passed and 14 qualified to go to university. I’ve been told by some that now is not the right time to talk about this. But when is the right time to talk about dropout? June? September? It’s never comfortable or convenient to talk about half a million children dropping out of school and facing unemployment or menial work – something that happens year in and year out. And lest you think these students are going to FET colleges or vocational training, let’s look at the stats. Household surveys show that only 1% of youths who did not hold a matric certificate held some other non-Grade 12 school certificate or diploma issued by an FET college for example. The rest have no educational qualifications whatsoever. It is highly problematic that around 60% of South African youth end up with no national or widely recognised educational qualification, despite spending a relatively high number of years in education. To be clear, the aim of education should not be to get everyone to matric. Rather we need trustworthy and credible exams at the grade 9 level, and legitimate vocational options with clear occupational roles that students are being prepared for.

This year we were also made aware of a surge in matric cheating with 5305 candidates implicated in 2014, more than ten times as many as in 2013 (473). Furthermore, the findings of ‘group copying’ by Umalusi (the quality assurance body) raises serious concerns about the involvement and complicity of teachers, departmental officials and examinations officers.

Language

Much has already been said in the media about the drop in mathematics performance and the mathematics crisis in South Africa. Let me rather talk about another subject that should be receiving as much attention: English First Additional Language (EFAL). In South Africa students take at least one home language and one first additional (i.e. second) language. EFAL is the largest single subject in matric with 81% of all matric students writing the exam in 2014. One might expect weak performance in this subject given that most international assessments that South Africa participates in show that our students perform two to four grade levels behind their peers in reading literacy. However, the 2014 pass rate for English First Additional Language was 98%. This is largely because EFAL is set at the same standard as all the other First Additional Language subjects which are relatively easy and prioritize communication. Yet, as the 2014 Ministerial Task Team on the NSC identifies, “EFAL does not and cannot fulfil the same purpose in the curriculum as the other 10 First Additional Languages.” This is primarily because the purpose of EFAL for most students is not only communicative efficiency, but also to prepare students to learn all their other subjects in English (their second language) and to prepare them for the world of work. The Task Team report goes on to explain that most of these students are only ‘semi-lingual’ in either their home language or in English. One only needs to look at the EFAL curriculum and the EFAL exams to know why. In 2010 the EFAL exams were reviewed by a number of international benchmarking authorities. The Cambridge International Examinations body concluded that “reliance on testing memorisation and recall, rather than critical thinking and analytical and evaluation skills” was a major problem. The Australian Board of Studies New South Wales did not mince their words when they explained that “The cognitive levels assessed in the examination questions are heavily weighted towards lower-order skills…The grammatical activities themselves are meaningless and reflect a drill and practice approach to language learning which does not support the need to develop students’ language for work and participation in the broader community.” These are the same sentiments that are repeatedly expressed by business leaders and those in higher education institutions in South Africa.

The Task Team report also highlighted the low levels of English proficiency among teachers for whom English is a second language, a severe problem that is widely acknowledged in the research literature. Yet interventions to improve teacher subject knowledge in English are meagre and wholly inadequate. During the course of 2013 South African teachers who have English as a second language had a maximum of three hours of English training, and in four provinces they had none. You do not become proficient in a language with 2-3 hours of training. This is not learning how to play Sudoku. The two main reasons for the low levels of in-service teacher training are firstly that there are so few high-quality training programs available to teachers (none of which are properly evaluated), and secondly that teacher training is seen as too expensive for the Department. This is largely because many teachers, vigorously backed by their union, refuse to attend training courses unless there is additional pay for it. This makes training inordinately expensive. Alternatively the training must happen during school hours, which is basically standard practice across the country (despite it being against policy). Yet all of this is quite ridiculous and unnecessary. All South African teachers are already being paid for 80 hours of professional development per year as part of their existing employment contracts (see Government Gazette, Notice 222 of 18 February 1999, Chapter A, Number 3.2, Section D). Yet nationally representative data show that the average South African teacher spends less than 40 hours on professional development per year?

More questions than answers

We need to end our infantile obsession with the matric pass rate and move on to talking about the real issues affecting education. Poor performance in matric is rooted in weak foundations in grades 1-3. Rather than frown about the two percentage point drop in the pass rate, we should be asking why only one in three students who took maths or science scored above 40% in either subject in 2014? Or why so few take these subjects. Or why 40% of our matrics are taking Business Studies and 20% are taking Tourism, when in reality these are empty subjects that are ill conceived and prepare them for nothing? Researchers at Wits have highlighted this problem before, with Stephanie Allais concluding that, “Vast numbers of our children enrol for semi-vocational subjects that are not teaching them either robust academic skills by building concepts and knowledge, nor preparing them for work in any meaningful way.” Is there any plan to reform these curricula and the way that they are taught? Is there any commitment from the Department that from next year they will report the ‘real’ matric pass rate (the throughput rate from grade 8) in addition to the traditional matric pass rate? No single number can capture the health of our education system, the sooner we realise this the better.

//

Some other links to comments I’ve made on Matric 2014 results:

“Assessment results don’t add up” (my M&G article on the ANAs)

ANA 2015

(The article below first appeared in the Mail & Guardian on the 12th of December 2014. The original link can be found here.)

Last week, the minister of basic education announced the results of the Annual National Assessments (ANAs) for 2014. The ANAs test all children in grades one to six and nine, using standardised tests in mathematics and languages.

The problem is that these tests are being used as evidence of “improvements” in education when the ANAs cannot show changes over time. There is absolutely no statistical or methodological foundation to make any comparison of ANA results over time or across grades. Any such comparison is inaccurate, misleading and irresponsible. The difficulty levels of these tests differ between years and across grades, yielding different scores that have nothing to do with improvements or deteriorations necessarily, but rather test difficulty and the content covered.

Although the department of basic education tries to make the tests comparable across years, the way it goes about doing this (with teachers and experts setting the tests) means that in reality they are not at all comparable.

And the department knows this. On page 36 of its 2014 report, it states: “Even though care is taken to develop appropriate ANA tests each year, the results may not be perfectly comparable across years as the difficulty level and composition of the tests may not be identical from year to year.” Yet it then goes on to make explicit comparisons.

You can’t have it both ways. I can say categorically that the ANA tests are not at all comparable across years or grades. Despite this cloaked admission of incomparability, the report is full of the rhetoric of comparison, with scores reported side by side for 2012, 2013 and 2014, and 24 references to “increases” or “decreases” relative to last year’s ANA. Similarly the minister in her speech last week Thursday spoke about “consistent improvement in home language” as well as “an upward trend in performance”.

All of these statements are extremely misleading and factually incorrect. The ANAs cannot be compared across grades or years, at least not as they currently stand.

Those of us in the field of educational assessment have been saying this repeatedly for two years. Yet journalists continue to regurgitate these “increases” and “decreases” without any critical analysis, as if they must be true – but they are not. There are different ways of determining whether the quality of education is improving (primarily by using reliable international assessments over time) but the ANAs, in their current form, are not among them.

For tests to be comparable over time, one has to employ advanced statistical methods – for instance, item response theory, which essentially involves using some common questions across tests allowing us to compare performance on the common questions with performance on the noncommon questions within and between tests. This makes it possible to equate the difficulty of the tests (and adjust results) after they have been written. The common questions must also be used across grades and the ANA cycles.

This is standard practice around the world, and yet is not employed with the ANAs. Every single reliable international and national assessment around the world uses these methods if they intend to compare results over time or grades, but not the ANAs. There are no common questions used across any of the ANAs, either grade to grade within one year of an ANA, or between the ANA cycles. Using the ANA results to talk about “improvements” or “deteriorations” has no methodological or statistical justification whatsoever.

There is not a single educational statistician in the country or internationally who would go on record and say that the ANA results can be used to identify “improvements” or “deteriorations” over time or across grades.

Although the ANA report speaks about an “advisory committee” of “local and international experts”, it does not name them. These experts need to come forward and explain why they believe these tests are comparable over time, and if they do not believe they are comparable over time then the report should not refer to them.

On this matter, no one needs to take my word for it: the changes in results are so implausible that they speak for themselves. Take grade one mathematics, for example, where the average score was 68% in 2012, plummeted to 59% in 2013 and then soared to 68% in 2014. Very strange. Or, if we look at the proportion of grade three students with “acceptable achievement” (50% or higher) in mathematics, we have the fastest improving education system in recorded human history. The results went from 36% in 2012 to 65% in 2014. These changes are, educationally speaking, impossible.

Some of the provincial results are equally ridiculous. The average score for grade four home language in Limpopo doubled in two years, from 24% in 2012 to 51% in 2014. Given that the standard deviation for grade four home language in ANA 2012 was 26.5%, this amounts to a one-standard deviation increase in two years. For those who don’t know how large this is, it’s the same as the difference between township schools and suburban schools (mainly former Model C schools) in the 2011 study best known as “prePirls” (pre-Progress in International Reading Literacy Study), which recorded 0.9 standard deviations. There are clearly miracles happening in Limpopo.

I could go on and on and talk about other ridiculous changes, such as the national grade six mathematics average (from 27% in 2012 to 43% in 2014), grade five home-language increases in the North West (from 26% to 58%) or grade three mathematics increases in Mpumalanga (from 36% to 50%) or grade four home-language increases in KwaZulu-Natal (from 38% to 58%), and so on. These are all absolutely and unequivocally impossible, and have never been seen on a large scale anywhere in the world before. Ever.

Testing can be an extremely useful way to monitor progress and influence pedagogy and curriculum coverage, but only if it is done properly. Testing regimes usually take between five and 10 years to develop before they can offer the kinds of reliability needed to make claims about “improvement” or “deterioration”.

Test results send strong signals to students and teachers about what constitutes acceptable performance and whether things are improving or not. For example, the department assumes that 50% on the ANAs re-presents competent performance, but there is no rational basis for using this threshold as conceptually equivalent to “acceptable achievement”.

The overall decline in ANA achievement between grade one and grade nine is also extremely misleading, because it suggests that the problem lies higher up in the system. But all research shows that children are not acquiring foundational skills in grades one to three and that this is the root cause of underperformance in higher grades.

Testing children is a serious business that requires large teams of highly skilled professionals whose sole responsibility is to ensure the reliability and validity of the ANA results and process. This includes building a large bank of questions across grades, learning outcomes and subjects. It involves setting and moderating tests; linking and analysing test questions using item response theory; as well as reporting and disseminating results in ways that principals, teachers and parents understand. It needs intense collaboration across the curriculum and assessment branches of government and with those who develop the department’s workbooks. It requires a much longer planning, piloting and reporting cycle than the impossible time frames to which departmental officials are subject.

Let me be clear: the ANAs should not be scrapped – they are one of the most important policy interventions in the past 10 years. However, the first rule in educational assessment, as in medicine, is: “Do no harm.” Sending erroneous signals to teachers and students about “improvements” is extremely unhelpful. This makes it so much more difficult to really induce the improvement in behaviour at the classroom level that is central to real advances in learning outcomes.

In essence, the department needs to answer this: Are the ANA results comparable over time and across grades? If not, why are they being used as evidence for claims about “improvements” or “deteriorations” across grades or over time?

//

Previous posts on the ANAs:

NEEDU Grade 5 Reading Report 2013 (excellent!!)

ele

Today the Minister of Basic Education Mrs Angie Motshekga released the results of the Annual National Assessments for 2014 (report here, speech here). This is not my post on the ANA results – I will write an article for next week’s M&G for that. (However, if it were my blog on the ANAs I would talk about how Grade 9’s abysmal results are rooted in Foundation Phase and the early grade ANAs are not accurate reflections of learning. O, ya, and also that the ANASs are absolutely, categorically and unequivocally NOT comparable year-on-year). But as I said, this is not my blog on ANAs.

Instead it is my blog on the Minister’s excellent choice to focus on reading. In her speech today she devoted considerable attention to the importance of reading and highlighted the numerous initiatives that the DBE has undertaken to improve the state of reading in South Africa (see page 20 and 21).

The Minister also makes extensive reference to the 2013 NEEDU Grade 5 Reading Report (draft). Together with Lillie Pretorius’ excellent article, this NEEDU report was the best thing I’ve read on reading all year. To give an overview of the report let me quote from the introduction:

“This report begins with a brief discussion of literacy and the complexity of reading and reading instruction. It gives a short explanation of the difference between decoding and comprehension and the importance of oral reading fluency for understanding and interpreting what is being read. The report outlines the importance of reading norms, and in particular reading norms for a country like South Africa with the large majority of its early readers reading in a second language. Finally, before the NEEDU Grade 5 reading data is presented, the recent and current national strategies and interventions to improve learner reading proficiency are tracked, suggesting that the crises in reading in South Africa is not new, is not unknown, yet persists” (p 4).

I have argued elsewhere that I believe we need to adopt a national education goal in South Africa; “Every child must read and write fluently by the end of grade 3.” Anyone who is seriously interested in education in South Africa and how to improve the state we’re in should read this draft of the upcoming NEEDU report. It is truly excellent.

DFID 2014 rigorous literature reviews on education

lit review pic

DFID has recently funded a series of rigorous literature reviews on a number of important topics. I’ve included the descriptions below (from here originally) as well as links to the evidence brief and full literature reviews:

Early childhood development and cognitive development in developing countries (2014)
This review aimed to: (i) review existing evidence on the review topic to inform programme design and policy making undertaken by the DfID, other agencies and researchers; and (ii) identify critical evidence gaps to guide the development of future research programmes

The impact of tertiary education on development (2014)
After a long period in which the international development community has placed emphasis on primary education, there is now renewed interest in tertiary education (TE). However, the extent and nature of the impact of TE on development remains unclear. This rigorous review seeks to address this question in the context of low and lower middle income countries (LLMICs).

Interventions to enhance girls’ education and gender equality (2014)
The central research question that this review sets out to investigate concerns the kind of interventions that research evidence suggests can lead to an expansion and improvement in girls’ education. It also considered evidence on the relationship between an expansion and improvement in girls’ education and a deepening of gender equality.

The role and impact of private schools in developing countries (2014)
The research question driving the review is: Can private schools improve education for children in developing countries? The conceptual framework set out a number of hypotheses and assumptions that underpin the polarised debate about the potential and real contribution of private schools. These are interrogated through a rigorous and objective review of the evidence and findings are mapped on to an evidenced theory of change.

Literacy, foundation learning and assessment in developing countries (2014)

Developing countries face distinct challenges in providing access to quality education. Educational provision also varies markedly in terms of teacher training, teaching and learning resources, school attendance, and motivation of parents, teachers and children for schooling. Against this backdrop, we consider the available evidence on foundation learning and literacy in order to identify key components for intervention that are appropriate to specific cultural and linguistic contexts.

The political economy of education systems in developing countries (2014)

Teachers and schools do not exist in isolation of the larger world around them. Frequently, many of their actions – and the school outcomes that they are accountable for – are influenced by incentives and constraints operating outside the schooling system. Each of these factors influences different aspects of education reform, whether policy design, financing, implementation or evaluation. Given the importance of these power relations in influencing student outcomes, there is surprisingly little literature to guide us in making related policy decisions. One reason is that examining these issues in the case of education may not be amenable to a particular disciplinary lens and is better served through an inter-disciplinary approach. A key contribution of this review is to pull together the essential literature from various disciplinary and interdisciplinary traditions and to provide a conceptual framework in which to situate the analysis of political economy issues in education research. Another contribution is to carefully review the existing literature and identify research gaps in it. The review organises the literature along 5 key themes.

Pedagogy, curriculum, teaching practices and teacher education in developing countries (2013)

This rigorous literature review, focused on pedagogy, curriculum, teaching practices and teacher education in developing countries. It aimed to: (1) review existing evidence on the review topic to inform programme design and policy making undertaken by the DFID, other agencies and researchers, and (2) identify critical evidence gaps to guide the development of future research programmes.

The political economy of education systems in conflict-affected contexts (2014)

This report is a rigorous literature review on the political economy of education systems in conflict-affected contexts and is aimed at education advisers and agencies, development practitioners, and Ministry of Education policy makers working in conflict-affected contexts. It is also aimed at the broader education and conflict community of research and practice linked to the Inter-Agency Network of Education in Emergencies (INEE). The report seeks to provide theoretically informed and policy-relevant insights on the global, national and local governance of education systems in conflict-affected contexts.

My new Working Paper with Hamsa Venkat on Mathematics teacher content knowledge in SA

27math1-master1050-v4

My new working paper (co-authored with Hamsa Venkat) was released today:  “What do we know about primary teachers’ mathematical content knowledge in South Africa? An analysis of SACMEQ 2007”  (Stellenbosch Economic Working Paper 13/2014)

ABSTRACT:

Primary school mathematics teachers should, at the most basic level, have mastery of the content knowledge that they are required to teach. In this paper we test empirically whether this is the case by analyzing the South African SACMEQ 2007 mathematics teacher test data which tested 401 grade 6 mathematics teachers from a nationally representative sample of primary schools. Findings indicate that 79% of grade 6 mathematics teachers showed content knowledge levels below the grade 6/7 band, and that the few remaining teachers with higher-level content knowledge are highly inequitably distributed.

Full paper HERE.

Picture from an excellent NYT article on mathematics in the US – see here.

WEF education rankings are nonsense

wef-logo

For those following the SA media you will have noticed that South Africa has once again succumbed to the World Economic Forum education rankings published every year. This year South Africa ranked  148/148 on the “quality of math and science education.” I was sufficiently angered by these preposterous rankings that I have written an article for the Mail & Guardian which will hopefully come out next week Friday. But in the mean time Martin Gustafsson (of ReSEP and DBE) has written an excellent piece on the matter which I have re-posted below (original here). In short, things are bad, but not that bad.

//

Each year the World Economic Forum releases its Global Competitiveness Report which aims to “assess the competitiveness landscape” and “provide insight into the drivers of their productivity and prosperity.” They furthermore claim that this report “remains the most comprehensive assessment of national competitiveness worldwide.” Included in the report is an indicator of education quality where South Africa performs extremely poorly (133 of 148).

Much of the work conducted at RESEP focuses on education in South Africa, the quality of that education and the links between the schooling system and the labour market. Martin Gustafsson, one of the researchers at RESEP, has looked into the WEF rankings on education and discusses four salient features which explain why the WEF rankings on education are especially problematic.

1. Once again, in 2014 the Global Competitiveness Report of the World Economic Forum (WEF) has caused a stir in South Africa as, despite a relatively good overall competitiveness ranking (53 out of 148 countries in the 2013-2014 report), a few indicators related to government service delivery, in particular education, put the country amongst the worst in the world, and for some indicators at the very bottom of the ranking. Specifically, in terms of the ‘quality of primary education’ we are at position 133 out of 148; we are at position 122 for the net primary enrolment ratio; position 146 for ‘quality of the educational system’, and position 148 (bottom of all countries) for the quality of mathematics and science at the higher education level. The 2013-2014 report does not really present anything new. Figures in reports from earlier years are very similar.

2. With regard to the educational quality indicators, it is important to bear in mind that the WEF does not make use of any standardised testing system in producing its report. Instead, it makes use of an expert opinion approach. In the case of South Africa, around 50 respondents, all from the ‘business community’, are asked to rate the quality of education along a seven-point scale from very good to very poor. One would expect the South African respondents to rate the quality of South Africa’s schooling poorly for a number of reasons. One is that in South Africa we have good data on our educational quality relative to other countries. In particular, the internationally comparable TIMSS testing system has consistently placed South Africa last, or almost last, with respect to lower secondary school mathematics and physical science, amongst the around 20 developing countries that have participated in TIMSS (the other African countries participating have been Botswana, Egypt, Ghana, Tunisia and Morocco). However, there are around 150 developing countries in the world (around 115 included in the WEF tables), many of which have very poor information on the quality of their education systems. One suspects that business experts in these countries would not rate their educational quality too poorly as they simply do not have the required information. In SACMEQ 2007, South Africa came eighth out of 15 countries in Grade 6 mathematics. It is noteworthy that although Lesotho did considerably worse than South Africa in SACMEQ, its WEF ranking for the quality of primary schooling indicator is 120, against 132 for South Africa. This illustrates the problem with subjective data on a matter which is relatively amenable to measurement. I, and others, have tried ‘sewing together’ reliable test-based indicators of education quality, by taking advantage of the fact that some countries participate in more than one international testing system, thus creating overlaps. I found that South Africa’s quality of school education ranks position 106 out of 113 countries, so clearly very poorly. However, just looking at the 88 countries not included in my list of 113 suggests many are poor countries with little in the way of credible testing systems and probably a quality of education below that of South Africa. The bottom line is that test-based data suggest that indeed South Africa’s quality of education requires a lot of fixing, and is well below where it should be, yet the catchy slogan that we are ‘at the bottom of the world’ is not supported by the evidence.

3. With regard to the primary enrolment ratio, it is important to note that UNESCO’s enrolment ratios (the data source for the WEF) are widely regarded as problematic and often not amenable to useful international comparisons due to the fact that UNESCO calculates its ratios using official enrolment totals and official population totals, in other words information from very different data sources. In many developing countries there are strange discrepancies between the two sets of data. The problem for South Africa is that this discrepancy works in the reverse direction compared to most other developing countries. In South Africa, total population figures for children are simply too high compared to the enrolment totals. In most developing countries, the problem is that enrolment totals are inflated. South Africa’s enrolment ratios in the UNESCO reports appear to be relatively poor, but this means nothing and has confused a lot of people. Enrolment ratios derived from household surveys are a lot more reliable and these indicate that South Africa’s enrolment ratios, at least at the primary and secondary levels, are good by international standards. There is an abundance of literature that shows this. The WEF report itself points to the strangeness of the enrolment ratios it uses. According to the report, at the primary level our enrolment ratio is ranked position 122, but at the secondary level it is ranked 55. This raises an obvious question: How can enrolments at the secondary level be relatively good when at the primary level they are poor, yet the former depends on the latter?

-Martin Gustafsson

Part of Martin’s PhD research involved developing a method to compare the performance of countries on different (sometimes non-overlapping) international assessments of educational achievement. His 2012 Working Paper “More countries, similar results. A nonlinear programming approach to normalising test scores needed for growth regressions” can be found here.


Gauteng Dept. of Education vacancies

uncle-sam-we-want-you

The lack of capacity of the civil service in South Africa is one of the major impediments to improvement in education (and obviously all the other sectors as well). In the spirit of getting competent people into important positions I thought I would draw your attention to two current vacancies in the Gauteng Department 20121211103022_thumb_DOE-Gauteng-provof Education: (1) Chief Education Specialist: Education Planning and Information, and (2) Chief Education Specialist: Education Research. The full description (requirements, remuneration, etc.) can be found here, and the deadline for applications is the 13th of June. If you know of anyone who may be interested in the position please do forward this on to them. (If you know of any government vacancies in education and would like them advertised on here please do send them along and I’ll post them on the blog).

My M&G article on Stellenbosch Uni & apartheid

apartheid

The article below first appeared in the Mail & Guardian on the 2nd of May and is also available on their website (see here).

Varsity buildings salute apartheid – Nic Spaull 

This past week we celebrated Freedom Day, commemorating 20 years of democracy in South Africa. Naturally the media reflected on the pressing issues of the day, such as corruption, inequality, poverty and the upcoming elections.

One issue that didn’t feature as prominently was the fact that, 20 years into democracy, Stellenbosch University still has buildings and plaques honouring people such as DF Malan and HF Verwoerd, the founders of apartheid.

We have, for example, the DF Malan Memorial Centre, which is used for indoor sports and graduation ceremonies. Malan was chancellor of Stellenbosch University from 1941 to 1959, and prime minister of South Africa from 1948 to 1954, and he was the very embodiment of supremacist racial ideology and paternalistic oppression.

He was the one who implemented “grand apartheid” and infamously concluded: “The Afrikaner has power over the kaffir. But truly, we would not have possessed this power if it had not been given to us from above. Has God not embedded it with a high and holy calling for our nation?”

Irreconcilable ways of life
This is the same man who believed that the difference between black and white people was “merely the physical manifestation of the contrast between two irreconcilable ways of life, between barbarism and civilisation, between heathendom and Christianity”.

He was a zealous racial supremacist who argued that, in order to avoid being “submerged in the black heathendom of Africa”, the white minority would have to employ “the armour of racial purity and self-preservation”.

Biographical scholarship has helped shed light on what made Malan the man he was and shows that he was obviously a product of his time. But being able to explain his views and policies in no way justifies or excuses them: this man was directly responsible for decades of oppression for millions of black South Africans.

Without any on-site explanation to the contrary – and there is none at the centre – buildings confer honour and respect on their namesakes. Should we really be celebrating and memorialising someone like Malan? Of course, he should be remembered in South African history, but his place is in an apartheid museum, not adorning an important building at a public university.

If you walk across the river from the centre and into the Accounting and Statistics Building (previously called the HF Verwoerd Building), you will still see a large dedication in the foyer: “In grateful memory of the Honourable HF Verwoerd, Prime Minister of the Republic of South Africa, after whom this building was named on 3 April 1963 and who on 6 September 1966 died in Parliament in the service of his people.”

Teaching the “bantu”
This “honourable” man was the same one who, when discussing his government’s education policies in the 1950s, declared: “There is no place for [the bantu] in the European community above the level of certain forms of labour … What is the use of teaching the bantu child mathematics when it cannot use it in practice? That is quite absurd.” He is also the one who decreed that it was better “to be poor and white than rich and multiracial”.

But perhaps some would argue otherwise, saying: “What is the harm in keeping the names of these buildings given that they were part of our history and that these were great men at the time?” To this I would answer that any achievements these men may have made have been vastly overshadowed by their heinous crimes against black South Africans.

Nefarious policies
I would also suggest addressing this question to any black student on campus whose parents, grandparents and great-grandparents were oppressed and subjugated by these very same individuals and their nefarious policies. Names have symbolic power. A black friend of mine who studied statistics at Stellenbosch University told me earlier this year about how, every time she walked into that building, “it served as a constant reminder of where I was and who I am”.

Malan and Verwoerd are by no means the only link between the university and apartheid: indeed, Stellenbosch was the crucible for Afrikaner Nationalist thought in the 20th century. Between 1919 and 1978, every single* prime minister of our country hailed from Stellenbosch University – Jan Smuts, JBM Hertzog, Malan, JG Strijdom, Verwoerd and BJ Vorster – whether as students, professors or chancellors. They then went on to become the architects and implementers of the oppressive apartheid regime of legislated racial exclusivity.

Oddly enough, there is scant mention of any of this on the university website and no mention whatsoever under the “historical background” section. This is a strange omission. Why is there no permanent exhibition or museum explaining the pivotal role that the university and its staff played in developing and implementing the apartheid ideology? One cannot simply sweep this under the rug, especially when you have buildings named after the perpetrators.

As I see it, there are two possible ways forward. Both would involve permanent recognition of the pivotal role the university played in the conceptualisation, implementation and maintenance of the supremely oppressive apartheid regime. Beyond this, one could also change the names of these buildings and remove the plaques.

Half-baked arguments
I have not found a legitimate reason why we should not change the names and put the plaques in museums, only a few legal trivialities and half-baked arguments about keeping a reminder of the past. But these are not benign reminders: they are commemorations, celebrations, remembrances.

Some see poetic justice in black students graduating in the DF Malan Memorial Centre. But at what price? Without on-site explanations denouncing these individuals, their visibility and prominence translate into honour and respect.

One wonders why we commemorate these fathers of apartheid when there are many anti-apartheid Afrikaners who are actually worth celebrating, people such as Antjie Krog, André Brink, Beyers Naudé, Bram Fischer, Nico Smith and Breyten Breytenbach. But we have no buildings named after these honourable heroes. Why is that?

But perhaps some feel that simply changing names is a shallow way of dealing with an inconvenient truth; or worse, that it amounts to whitewashing history. To these people I would say: fine, keep the plaques in place but then install museum-type exhibitions in situ and do so in such a way that there can be no doubt that these men orchestrated and implemented apartheid. They should not be remembered fondly. Given the university’s pivotal role in apartheid, what better place to have the country’s foremost campus-wide apartheid museum?

Remnants of the past
The fact that we are now 20 years into democracy and still see uncritical remnants of the past is all the more peculiar when one looks at some of the positive developments at the university. Last year it voted to make the student residences significantly more inclusive and diverse, and to promote the inclusion of more first-generation students actively. The vote passed 51% to 49% and was a heated affair, but it also marked an important milestone proving that the university is serious about transformation.

Some might argue that the university should not be singled out from other universities and that there are many examples of similarly offensive buildings and plaques at other institutions. Although I would caution that Stellenbosch is different in that it was the epicentre of apartheid, I agree 100% with the sentiment.

Rhodes University and Rhodes Memorial, for example, are named after one of the most despotic, racist and imperialistic men ever to set foot in Africa. This is the deplorable man who infamously said, “I prefer land to niggers” and “One should kill as many niggers as possible”. I focus on Stellenbosch only because I am studying here and I see these memorials every single day.

There is no doubt that it is one of the top universities in Africa. It is functional, entrepreneurial, safe, efficient and productive, and it has begun to make a concerted effort to become a more racially diverse and inclusive campus.

However, it simply has not done enough to acknowledge its role in apartheid and unequivocally distance itself from its infamous apartheid alumni.

Nic Spaull is a PhD student in the economics department at Stellenbosch University. He can be followed on Twitter @NicSpaull

//

*This is a corrected version and differs from the printed M&G article. The original M&G article had this as “Between 1919 and 1978, six of the seven prime ministers” which is incorrect and is a small typo from an earlier draft of the article. See here for background info. 

//

For those interested in this issue I would encourage you to read Pieter Odendaal’s open letter (2012) to the Rector of Stellenbosch University Russel Botman, Prof Botman’s reply, Johna Fourie’s blog post on this, and the recent article in Die Matie dealing with the topic.

Are there any alternatives to the two options I propose here? If you can think of any please do post in the comments section below.

“Why Children’s Books Matter” – exhibition at NYPL

IMG_3326This past week I was in New York en route to Boston and managed to get across to the incredible New York Public Library because they were having a special exhibition on children’s books: “The ABC of it: Why Children’s Books Matter” which I absolutely loved. While I am naturally interested in children’s literature (from a pedagogical, sociological and political perspective), the reason for my visit was because I am now an uncle and figured I need to get clued up on children’s literature for my (incredibly) cute nephew Lincoln William Spaull who will obviously be a reader. So here are a selection of photos of the exhibition and some of my comments…

IMG_3327

IMG_3333

One of the exhibits which I really loved was the discussion about the book “Goodnight Moon” which is such a sweet bedtime story about a rabbit saying goodnight to everything in his room, a wonderfully playful and beautifully coloured room.

IMG_3336It actually reminded me of Frida Kahlo and her boldness…

fridaBut getting back to “Goodnight Moon”, the guide told us a fascinating story about a parent who read the story to her young son before he went to bed but then later she heard him crying and walked in to find him sitting on the bed with the book open and a foot on each page. The little boy loved the story so much that he was trying to climb into the room and was upset because he couldn’t get inside. I thought it epitomised the idea that children do not make the same distinctions as we do between fiction and reality – they are one and the same. Another story illustrating the same thing is the book “Little Fur Family” by Margaret Wise Brown. The author was so well known and established that she managed to convince the publisher to cover her book in real rabbit fur (this was 1946!). The exhibition has stories of parents writing in and telling how their children thought the book was a real-live animal – one preschooler tried to feed the book and another child gave it as a present to her cat!

IMG_3375

Education is also completely political, with some lovely examples from China, USSR and Japan (among others) where children’s literature was used as an instrument of indoctrination and nation-building.

IMG_3341

IMG_3398

There was also a section on books that had been banned over the years because they were controversial, usually for political, religious or moral reasons. One classic one is “The Rabbit’s Wedding” (1958), where a black rabbit and a white rabbit get married:

rabbits-wedding0181This caused an uproar in the South of of the US where segregationists tried to get the book banned. In the end it was put in a special reserve section of the library. See this quote on the issue:

IMG_3366

This got me thinking about the representation of gay, bi and transgender characters in children’s books and the objections made by some conservative parents. In that sense, children’s books are a sort of battle-ground where adults fight it out and decide what is and is not OK for children to read and be influenced by.

A few other snippets from the exhibition:

IMG_3352

IMG_3355

IMG_3357

IMG_3349


Dear UKZN, you know you’re doing it wrong when…

got any other bad ideas (stark)

For those of you who haven’t been keeping abreast of the recent student protests at UKZN (primarily around student funding, housing and fees), you may be interested to hear the latest development which is as sad as it is infuriating. On the 23rd of February four UKZN Masters’ students wrote an open letter to the Vice Chancellor Professor Makgoba criticising university policies and the VC himself. In response to the dissent, the UKZN Student Discipline Office has charged the four students with defamation and ordered them before the Student Discipline Court (see the list of disciplinary charges here).

I’ve just read the letter and while it is verbose, riddled with spelling mistakes and sounds a little like an ill-informed political-manifesto, it is certainly not defamation.  It makes me furious to see the management at UKZN trying to intimidate these students into compliance and, presumably, discourage future dissent. This kind of knee-jerk response smacks of fragile egos and deep insecurities. Universities have always been a hot bed of critique and dissent being, as they are, a collection of intellectuals who usually understand the need for things like free-speech, critical thinking and dissent. Aside from the fact that UKZN’s approach here is morally repugnant and intellectually bankrupt, you also have to wonder, who on Earth is giving this University PR advice?! How did they think this was going to pan out? They presumably thought they were swatting a fly when in fact this strategy looks a lot more like the Dutch boy plugging holes in a breaking dyke, thinking somehow that this is a sustainable solution. Such a pity.

voldemort

As someone who did their undergrad at UKZN I am a more than a little ashamed that an institution of “higher learning” would take such a thuggish approach to something as harmless as a wordy letter from some politically-ambitious students. It’s called “engagement”/”discussion”/”dialogue”, you should try it sometime…

//

Also see the Right2Know write-up here.

0-3 years: *Must-read* Educational info for parents (from ZeroToThree)

zero to three

In doing some reading on Early Childhood Development I came across the Zero-to-Three website which is a treasure trove for those interested in scientifically-informed information on early childhood development for children aged 0-3 years (see links below). If you know of anyone with a baby (or expecting one soon) do send this on to them, I’m sure they will find it fascinating and immensely useful! As Nobel Laureate Professor James Heckman has said “Early learning begets later learning and early success breeds later success.” Also be sure to check out the Zero-to-Three website: http://www.zerotothree.org/

//

Everyday Ways to Support Your Baby or Toddler’s Early Learning

Download this handout (in both English and Spanish) to learn more about how you can support your child’s development from birth to three in the everyday moments you share. 

What We Know About Early Literacy and Language Development
This handout provides information on how early language and literacy skills unfold across the first three years of life.

Tips for Your Child’s Development Assessment
This handout provides tips on preparing for, and participating fully in, your child’s developmental assessment.

Healthy Eating Strategies for Young Children
This handout suggests 8 ways that parents can help their baby or toddler develop healthy eating habits in the first three years. [English ] [Espanol ]

Age-Based Handouts:

Birth to 12 Months 

Healthy Minds: Nurturing Your Child’s Healthy Development

Birth to 2 Months
English 
[286 KB]   Espanol  [387 KB]

2 to 6 Months
English 
[305 KB]   Espanol  [385 KB]

6 to 9 Months
English 
[286 KB]   Espanol  [379 KB]

9 to 12 Months
English 
[299 KB]   Espanol  [333 KB]

The Magic of Everyday Moments 

Birth to 4 Months
[
English ]  [Espanol ]

4 to 6 Months 
[
English ]  [Espanol ]

6 to 9 Months
[
English ]  [Espanol ]

9 to 12 Months 
[English ]  [Espanol ] 
Supporting Your Baby’s Language and Literacy Skills

Supporting Your Baby’s Thinking Skills

Supporting Your Baby’s Self-Confidence

Supporting Your Baby’s Self-Control


Your Baby’s Development

Birth to 3 Months

[232 KB  ] [Espanol  ]

 3 to 6 Months

[219 KB   [Espanol  ] 

6 to 9 Months

[239 KB  ] [Espanol  ]

9 to 12 Months

[243 KB  ] [Espanol  ]

12 to 24 Months

Healthy Minds: Nurturing Your Child’s Healthy Development

12 to 18 Months
English  [304 KB ]  Espanol  [324 KB ]

18 to 24 Months
English  [260 KB ]  Espanol  [331 KB ]

The Magic of Everyday Moments

12 to 15 Months
[English ] [Espanol ]

15 to 18 Months
[English ] [Espanol ]

18 to 24 Months
[English ] [Espanol ]

Supporting Your Baby’s Language and Literacy Skills

Supporting Your Baby’s Thinking Skills

Supporting Your Baby’s Self-Confidence

Supporting Your Baby’s Self-Control
Your Baby’s Development

12 to 15 Months

[232 KB  ] [Espanol  ]

15 to 18 Months

[224 KB   ]  [Espanol  ]

18 to 24 Months

[258 KB  ] [Espanol  ]

24 to 36 Months

Healthy Minds: Nurturing Your Child’s Healthy Development
English  [292 KB ]   Espanol  [336 KB ]

The Magic of Everyday Moments

24 to 36 Months
[English ] [Espanol ]

Supporting Your Baby’s Language and Literacy Skills

Supporting Your Baby’s Thinking Skills

Supporting Your Baby’s Self-Confidence

Supporting Your Baby’s Self-Control
Your Baby’s Development

24 to 30 Months

[228 KB  ] [Espanol  ]

30 to 36 Months

[239 KB  ] [Espanol  ]

Robocop, Ethics & Digital T-Rexs

robocop

Yesterday I decided to go and watch the new Robocop movie at Montecasino. I’ve never been to Montecasino before and, for those who haven’t been before, it is quite a surreal place. They have tried to recreate an Italian piazza inside a gigantic building. There are cobblestone roads and Tuscan buildings, complete with window-sills and balconies. There are trees and fountains and all the other things you might expect in some rural Italian village (albeit a highly commercialized one). The main thing that was weird for me was that the “time” inside seemed to be permanently set at around 5:30/6pm. I’ve heard of this happening in casinos where they try and fool people into thinking it’s evening time when in fact it might be 10am. People are immediately lulled into an evening mind-set and the usual evening familiarities (especially drinking alcohol) kick in. This was the first thing that made me feel a little uneasy in this place, and the feeling didn’t go away until I left the “building”.

Then I watched Robocop. It’s a great movie and the gist of the story is as follows: 1) Awesome, honest, handsome likeable cop gets blown up in a car-bomb after investigating corruption, 2) tech firm approaches grieving wife and asks if they can try out a new technology which integrates man and machine and would save her husband’s life, and 3) the bad tech firm actually plans on using it as a big Trojan-Horse PR scheme to make the American people love robots and overturn a law prohibiting “autonomous” machines in the US. As I’m sure you can already see, it touches on a number of important ethical and philosophical questions. Where is the line between man and machine when we start integrating the two? When we have chips in our brains that control part of our functioning (identifying and eliminating baddies in Robocop’s case), are we responsible for those actions? What is the definition of agency? Consciousness? At what point does a human become a machine? Is a human brain planted on a mass of body-machinery still a human? What is the test for “being a human”? These may sound like ‘out-there’ questions, but they will soon be very much ‘in-here’ as these kinds of questions come before congresses and parliaments around the world. Lant Pritchett recently said something to the effect of: “Change takes longer than you think but happens quicker than you think” which I think I agree with. The time between the first airborne flight (1903) to the first man on the moon (1969) was only 66 years! Or look at how quickly we have evolved from Pagers to Google Glasses. It’s not simply that the rate of new technology is accelerating, but that the growth in the rate of acceleration is also growing. Scary stuff.

When I came out of the movie I saw an 82-inch ultra-HD television standing right there with such clarity and precision it looked completely surreal. I was mesmerized. By this stage I was laughing to myself. Then the final straw was when we sat down for dinner at a random restaurant and the waiter hands us iPad-menus! This is first time in my life that I have been given a digital menu, but it makes complete sense. When the net-cost-benefit of technology is lower than the net-cost-benefit of physical menus, digital menus will become ubiquitous. Obviously.

On a more philosophical note I think one of the reasons why the rate of growth in technology scares me is because the youth are far more likely to be the ones who invent, understand and appropriate new technology. Yet wisdom and experience are still concentrated largely among the aged (as they have always been). There is also a parallel in the technical and non-technical disciplines…

trex

The ones creating new technology are often not the ones who contemplate or understand the moral, ethical or philosophical implications of those inventions. New technologies are not always benign. It is highly possible that facial-recognition technology was in existence long before there were any laws governing its use (I wonder if there are laws governing its use now?!). Is it OK to walk around in public with a camera that can match people’s faces to their Facebook profiles? Have those people given their consent to be identified simply by being outside? Do they need to give their consent? What are the implications for opt-in and opt-out rules when it comes to facial recognition? What about satellite surveillance? It’s completely unsurprising when you hear that 50-year old lawmakers are decades behind 20-year old hackers. While facial recognition may not sound like a big thing to many of you, the stakes are likely to escalate rapidly. If we found a way to “augment” sight and digitally record our stream of sight, is that legal? Why or why not? Currently the US is deciding whether or not Amazon can use drones to deliver Amazon parcels. While that may sound pretty quaint and novel, these type of questions are linked to bigger ones, especially the role we are willing to assign to robots in society. If robots can deliver parcels, can they also clear snow? drive buses? prescribe medicine? make citizens arrests? shoot criminals? Where and how does one draw the line between what robots can and can’t do?

Technology is advancing at a rapid pace and it won’t be long before these kinds of questions and terms become part of our everyday lives, words like “intelligent technology”, “thinking robots”, “artificial intelligence”, “smart phones”, oh wait…

Don’t get me wrong, I love tech and I’m a big fan of innovation and progress, but let’s not be caught  with our pants down surrounded by a small army of digital T-Rexes!

//

PS If you haven’t seen the Google Glasses intro check it out here (scary and cool) and also check out one of Google’s new robots, Big Dog, from the Boston Dynamics stable.