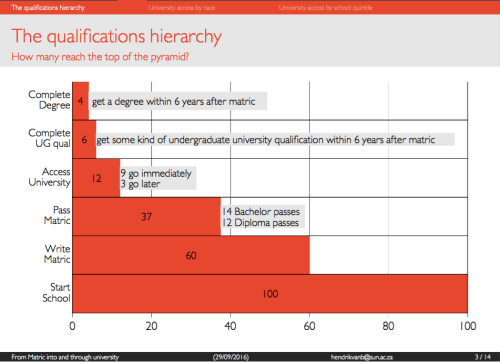
I have been meaning to blog about some new research on access to higher education that was published earlier this week: “Higher Education Access and Outcomes for the 2008 Matric Cohort” (Van Broekhuizen, Van der Berg & Hofmeyr, 2016). I will only highlight some of the key points from the 122-page Working Paper which is really worth reading in its entirety. Essentially the researchers used the matric data from 2008 and followed these students (using their ID numbers) into the higher education system using data from the Higher Education Management Information System (HEMIS). Perhaps the most striking feature is that of the 100 students that started school, only 12 ever access university (9 immediately after matric and 3 later), 6 get some kind of qualification within 6 years and only 4 get a degree within 6 years.
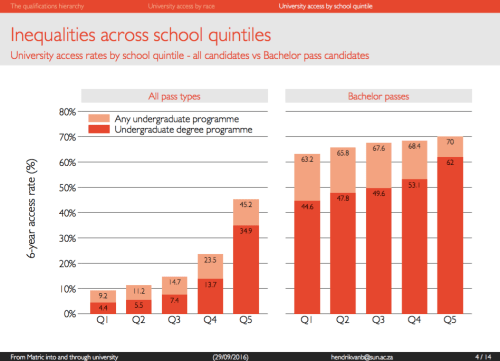
Secondly, that matrics that attend quintile 5 schools (almost all of which charge fees) are four times as likely to access university than those from the poorest 60% of schools (quintiles 1-3), all of which are no-fee schools. However, it’s encouraging to note that of those quintile 1-3 student that do qualify with a bachelor’s pass, more than 63-68% do actually access university, compared to 70% among quintile 5 students.
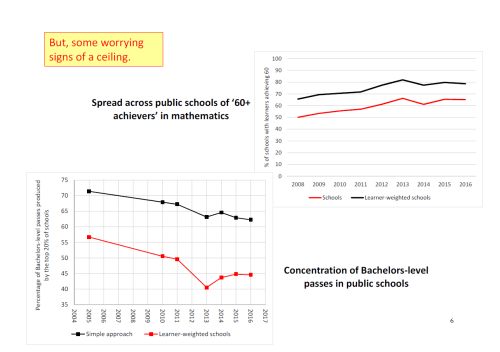
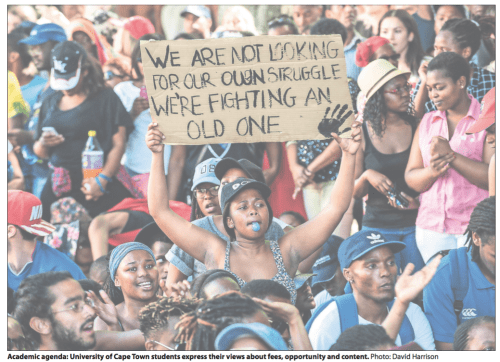
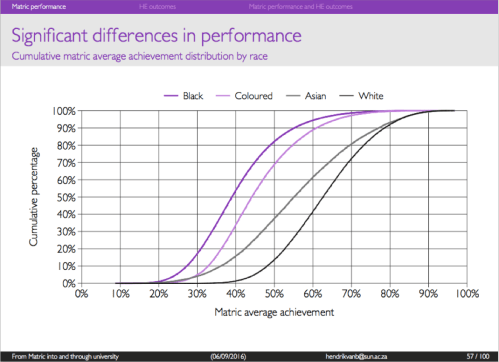
Much of the paper points to that fact that unequal access to university is rooted in a highly unequal schooling system where access to high-quality schooling largely depends on a family’s ability to pay school fees. If one looks at the cumulative matric average achievement by race one still finds enormous differentials. While 60% of White matric students achieved 60% or more in matric, only 5% of Black African matrics score at or above 60%. And this is only among the students that actually made it to matric which is only slightly more than half the cohort (see this paper).
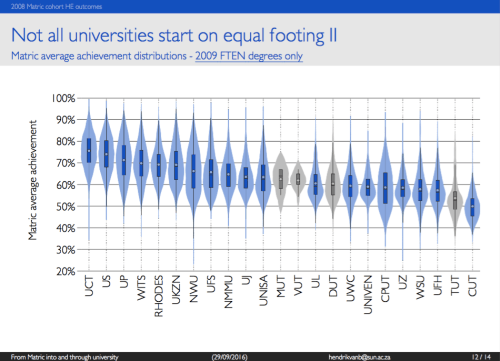
The last piece of their research that I want to highlight is that the student intake at different universities is vastly different. If one looks at the matric marks of the typical student entering UCT, Stellenbosch, UP or Wits one can see below that they scored 70% or above on average. This is in stark contrast to those students entering TUT, Fort Hare, Uni-Zulu, Walter Sisulu, UWC etc., all of whom have incoming students whose average matric mark is less than 60%. At the Central University of Technology (CUT, in Free State) the average entrant scored 50% in matric.
At the beginning of last year Professor Servaas van der Berg gave a Brown-Bag Lunch Seminar at Stellenbosch University on “The Distributional Implications of Student Fees.” I include some notable excerpts and graphs below:
“Education has a number of properties which make the analysis of the demand for it both interesting and complex. … (Education is) …a consumption good and a capital good, i.e., although much of the expenditure is justified in terms of the effects on the individual’s income in the future, many of the activities of educational institutions are primarily justifiable in terms of their immediate consumption benefits. Moreover, education affects individuals’ future incomes.” – (Stiglitz 1974: 349)
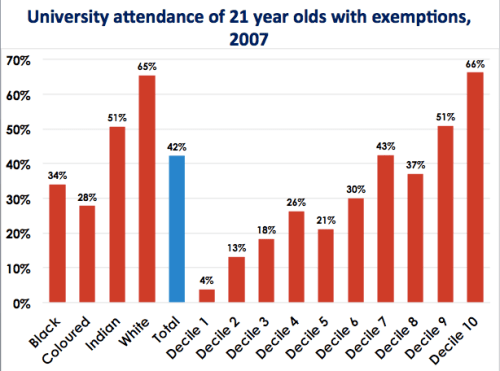
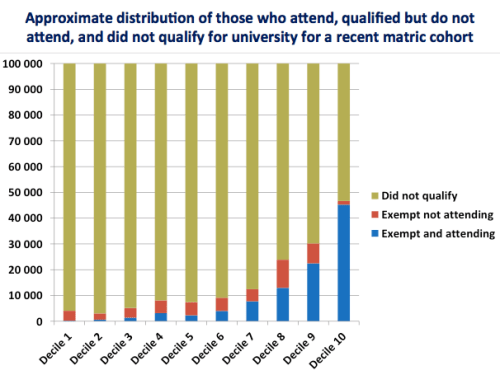
Perhaps most striking are Van der Berg’s estimates of who actually makes it to university and where they come from in the income distribution. According to these estimates, there are more students attending university from the richest 10% of the income distribution (Decile 10) than from the poorest 80% of the income distribution (Deciles 1-8 combined).
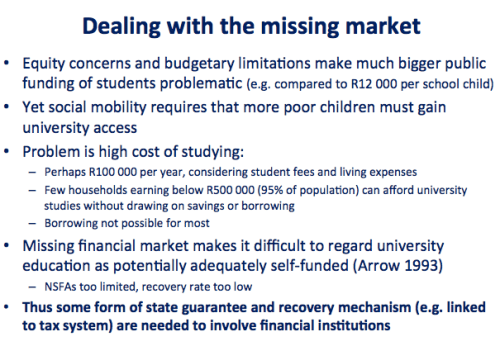
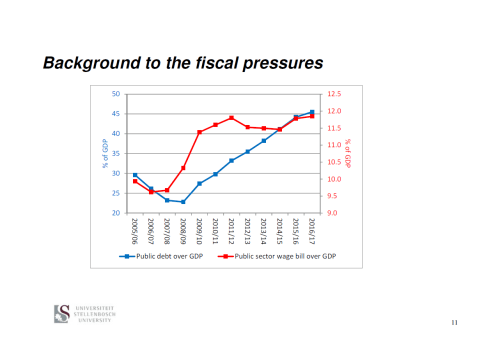
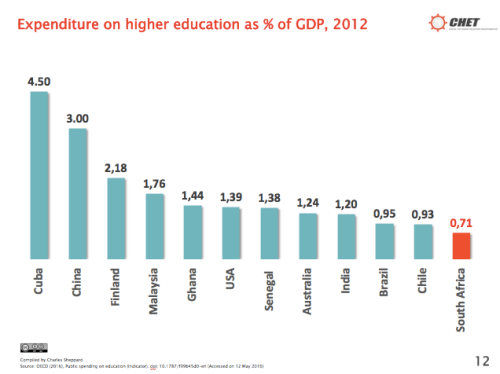
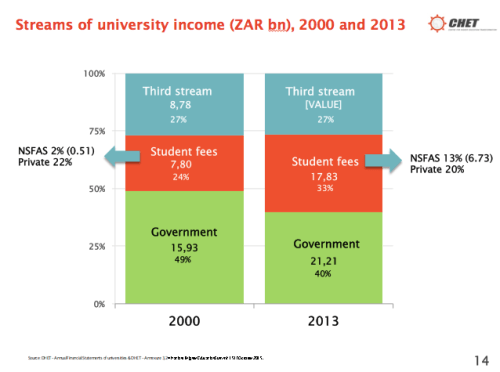
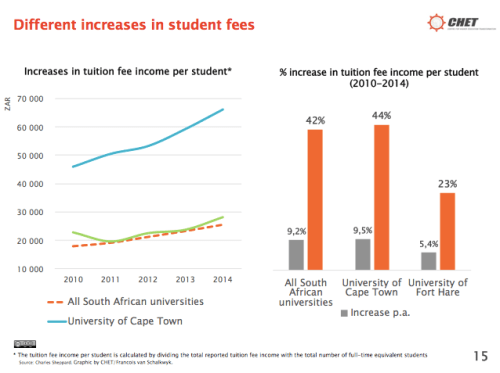
Last month Nico Cloete (from CHET) gave a lecture at SALDRU (UCT) titled: “University Fees in SA: A Story from Evidence.” I include some relevant slides from his presentation:
Anyone who wants to contribute to the debate about university fees needs to grapple with the realities presented by these three papers/presentations. At the end of the day we need to be able to answer the question of where the money will come from. A Graduate tax? Debt? The Education or Health budgets?
The most reasonable (and probably workable) solution that I have heard is that proposed by Prof Van der Berg who suggests that we should use the existing financial services infrastructure (banks) who could provide government-backed grant-loans (my terminology not SVDB’s) to students that qualify for university. It would be a grant that converts into a loan if a student successfully completes their degree and starts earning a decent income. It would still require a huge amount of government finance to provide the surety to banks for students who come from households that earn less than R500,000 (or some threshold). But, unlike with totally ‘free’ education, the students that do successfully complete their degrees would ‘pay-it-forward’ and contribute to the fund used to finance future students. 
Also, as a side-issue, the Fees Commission needs to get a fast-tracked timetable and told to release at least a preliminary report and recommendations before the end of the year. We cannot wait until June next year. The political hot-potato would have been passed along one too many times from VCs to DHET to Treasury and eventually it will just explode. A stitch in time saves nine.
(If you have any additional research suggestions please send me an email and I’ll include them in this post)
Additional inputs from readers:
“Between the Devil and Deep Blue Sea? The Financing of Higher Education” 3×3 article by Philippe Burger – Sept 2016 (Thanks Marisa!).
Abstract: “Higher-than-inflation increases in student fees since 2009 often are blamed on declining government subsidies to universities. This is not entirely correct, if one considers real per-student subsidies. Fee increases resulted mainly from cost pressures faced by universities due to growing student numbers and a weakening rand. These pressures will not disappear. Eliminating government wastage is not a durable solution and difficult choices cannot be avoided. So, who should pay for increasing costs, students or government – or which combination of these?”
“Kagisano Number 10 – Student Funding” – CHE (April 2016)
Description: The tenth issue of the CHE’s journal, Kagisano, brings together a number of papers that were presented at a CHE colloquium on student funding that was held in December 2013. The colloquium took as its point of departure the Funding chapter of South African Higher Education Reviewed, and the various papers, presented by experts who responded to a call for papers, all address in different ways the student funding crisis that reached a head with the #feesmustfall campaign in late 2015, and that continues to underlie student unrest in higher education. Different ideas on how to restructure student funding are presented, and the solutions range from the philosophical to the practical. This issue aims to contribute to the ongoing conversations, negotiations and policy-making aimed at ameliorating the intractable challenge of how to fund increasing access to higher education while ensuring that students receive a quality higher education experience.

 Ahoy blog-followers and other readers on the intertrons! It’s been a while since I’ve updated my blog on what I’ve been doing since I got from the OECD in Paris. Things were a little up and down about where I wanted to live, where I was going to work and the longer-term plans for life. So some of that has been resolved and things are moving ahead swiftly. I’ve been appointed as a Senior Researcher at RESEP in the Economics Department at Stellenbosch University. At the same time I’ve been seconded to the Allan Gray Orbis Foundation Endowment for half of my time to develop a video and coaching-based course to teach Foundation Phase isiXhosa teachers how to teach reading.
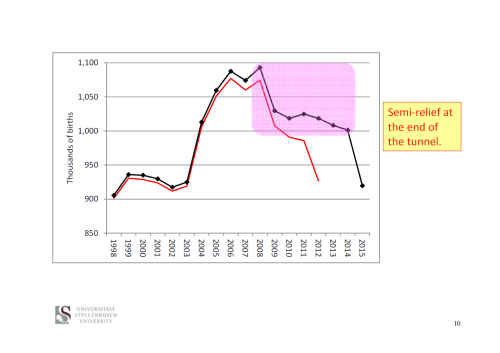
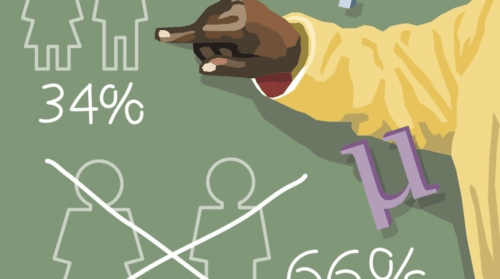
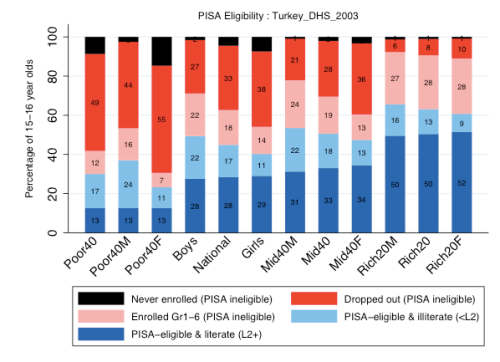
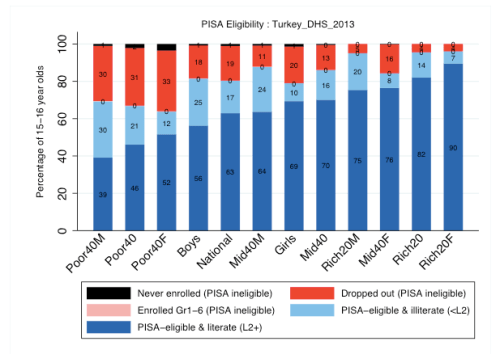
 Of the OECD countries that participate in the Programme for International Student Assessment (PISA), Turkey has one of the lowest levels of performance and the highest rates of improvement in PISA scores. However, most analyses have traditionally ignored one vital question: what percentage of 15 year olds in Turkey are eligible for the PISA sample in each wave of PISA? A new OECD Working Paper focuses on this specific question and sheds new light on the performance of Turkey between 2003 and 2012. It shows that the percentage of students that were eligible for PISA in Turkey between 2003 and 2012 nearly doubled from 36% to 68% (using OECD indicators) or from 45% to 80% (using household survey data). This is summarised in Figure 1 below which provides information from the Turkish Demographic and Health Survey (DHS) of 2003, 2009 and 2012.
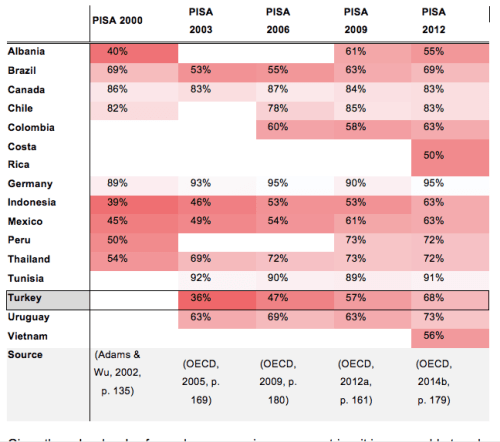
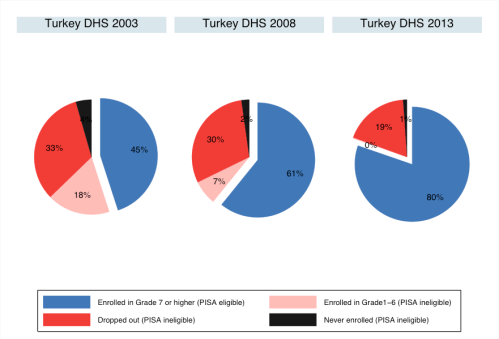
 Yesterday