The Emperor’s New Clothes – (reading and the 4th Industrial Revolution in SA)

emperor-768x506

(This article of mine was first published by the Daily Maverick on the 10th of September 2018).

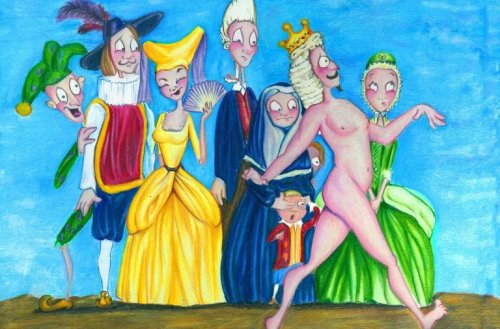
In 1837 Hans Christian Andersen wrote a story about a vain emperor who appoints two weavers (who turn out to be con-men) to make him a fabulous new garment. As the story goes, the weavers promise to make it from “wonderful cloth” that “would be invisible to everyone who was unfit for the job he held, or who was very simple in character.” Slightly afraid that he would not be able to see the cloth himself, the Emperor sends his wisest men to first observe the weavers at work and report back to him what they find. One after the next, the wise men and courtiers go to the see the con-men diligently working at empty looms and sewing imaginary cloth with their needles, but the wise men proclaim their admiration out of fear that they will be exposed as stupid or incompetent, each praising the work more loudly than the next; “What a splendid design! What glorious colours! Magnificent! Charming! Excellent!” Eventually the Emperor himself goes to see the finished works and, although seeing no clothes at all, he hears the praise of everyone else and fears being called out. The story ends with the Emperor parading through the town in his new clothes, where in reality he is prancing in his underwear. While everyone pretends to see the beautiful clothes, and look on with approval and announce their admiration, a child shouts “But the Emperor has nothing at all on!” at which point the public realise the whole thing was a farce. The story ends thus: “The Emperor was upset, for he knew that the people were right. However, he thought the procession must go on now! The lords of the bedchamber took greater pains than ever, to appear holding up a train, although, in reality, there was no train to hold, and the Emperor walked on in his underwear.”

So, what does this fairy-tale have to do with literacy in South Africa? It turns out quite a lot. Over the last two years, more and more otherwise sensible commentators have been starting to talk about terms like “The Fourth Industrial Revolution”, “Artificial Intelligence” and “21st Century Skills.” There are long presentations about the need for children to learn coding in primary schools and for more explicit teaching of the 4 C’s (collaboration, critical thinking, creativity, communication). We are repeatedly exposed to Alvin Toffler’s quote that “the illiterate of the 21st century will not be those who cannot read and write, but those that cannot learn, unlearn and relearn.” And that we are “preparing children for jobs that don’t yet exist, using technologies that haven’t been invented in order to solve problems that we don’t even know are problems yet” (Richard Riley). All of this is obviously true. The world of work in the future will be radically different to what it is today. The premium on non-cognitive skills is rising as more and more advanced computers do what we used to do, only faster, cheaper and more reliably. But it is also true that 78% of South African Grade 4’s cannot read for meaning in any language in 2016 (according to PIRLS 2016). These statistics are from a reliable internationally-set assessment that 50 countries participate in. Interestingly, in the UK (where they are introducing coding in primary schools) the percentage of children that cannot read is a mere 3%. In the U.S. it is 4%, in Chile 13%, in Iran it is 35% (note Iran has the same GDP per capita as South Africa). If we were having this conversation in the U.K I would have a different opinion.

In South Africa about 80% of children can’t read properly after four years of full time schooling and we are told that we must be devoting more time and resources to teaching them to collaborate? Or think critically? Or to code? “In the future, they will need to know how to work with artificial intelligence.” They. Can’t. Read. This sentence that you’re reading now – they can’t. This is our Emperor and these are our fantastical clothes. Children that do not learn to read for meaning after three years of schooling are never going to learn these other skills or be employed in the 21st century. Yes, children of the future will need more and different skills, but you cannot leap-frog literacy. Learning to work collaboratively is not more important than learning to read. Learning to code is not more important than learning to read. That’s because you can’t do any of these other things properly if you don’t learn to read first. Some might say we can do both, together, reinforcing each other, but this neglects the fact that there are real trade-offs. I have yet to see any practical plans for how time and resources given to these other areas aren’t time and resources taken away from teaching reading – a skill that clearly the majority of children are not getting.

In addition to the above, we should not be introducing a third African language in schools where most children have not learned to read properly in their home language. Notwithstanding the above, this is now the policy, the “Incremental Introduction of African Languages”. If this were restricted to the 20% of schools where most children do learn to read, that would be fine, but it isn’t. For various political reasons, even struggling no-fee schools are now told that they must teach three languages, when they currently cannot even teach one. “What a splendid idea! How inclusive! How multicultural!”

I was at a high-level government workshop recently where the topic of implementing Swahili in pilot schools was discussed in a serious way – presumably because of a pan-African workshop that was held where the idea came up and was thought to be a good one by the President or a Minister. Where are the children saying: “But the Emperor has nothing at all on!” and helping to break us out of the spell of magical thinking. These “good ideas” are harmful distractions. We need to call a spade a spade and get back to basics. We need to be hard-nosed and shut down the 42 other priorities and programmes and “good ideas” that litter our primary schools and distract us from the one goal we can’t afford not to achieve: ensuring that all children learn to read for meaning by age 10. If I had to bet the farm on one skill that children will definitely still need in the 21st century, it would be high levels of literacy. Other things, yes, but literacy first.

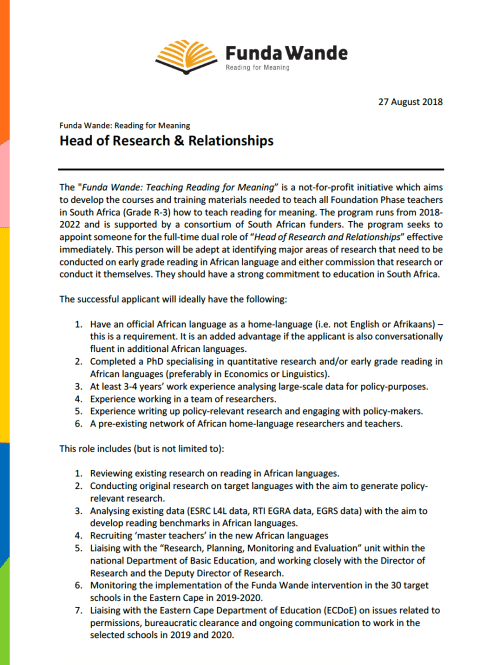
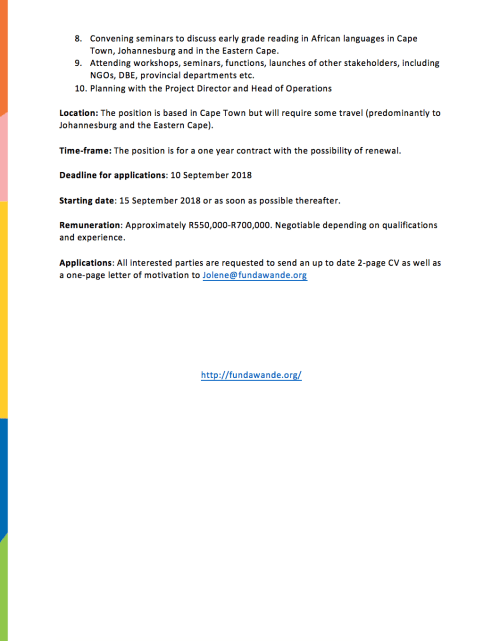
We’re hiring :)

Screen Shot 2018-09-03 at 07.29.27

Screen Shot 2018-09-03 at 07.33.54

Teaching Applied Economics of Education (2018)

Screen Shot 2018-07-22 at 08.22.02

This semester I’ll be teaching half of the Applied Economics of Education course offered to graduate students in the economics department at Stellenbosch University. The course starts this week Wednesday 25 July (lectures 3-5pm) and I will be teaching for 6 weeks (i.e. 6 lectures and some tutorials). The aim of the course is to expose some of our graduate students to the applied work we do on education in SA, particularly at RESEP, and also to the researchers who are doing that work (many of whom will be at the lectures as well). For that reason many of the prescribed readings are written by RESEP researchers. Some of our PhD students who will be taking the course are based in Durban and Johannesburg and will be joining the lectures via Google Hangouts.  I’m quite keen to include some people from outside the Economics department, from other universities and even from outside universities all together.  While some of the readings and discussions are technical, the majority of the course is not. If you would like to audit the course (either in person or online) please send me an email with a one paragraph description of why you’d like to take the course and attach your CV before Wednesday 25 July. There is space for up to 15 auditors.

An overview of the six lectures is included below and the full course outline is available here.

[1] An overview of the South African education system

The aim of this lecture is to provide an overview of the South African education system. For those who are not from South Africa please read the first four chapters of the Fiske & Ladd (2004) book and the Van der Berg & Hofmeyr (2018) article to familiarize yourself with the SA context.

Required readings:

  1. Spaull, N. (2018). Equity: A price too high to pay? In Spaull, N. & Jansen, J. (eds): South African Schooling: The Enigma of Inequality. Springer.
  2. Van der Berg, S., Spaull, N., Wills, G., Gustafsson, M. & Kotzé, J. (2016). Identifying binding constraints in education. Stellenbosch: Research on Socio-economic Policy. Available from: <http://resep.sun.ac.za&gt; [Accessed May 2016].

Additional readings:

  1. (Policy) Gustafsson, M. (2018). Pursuing change through policy in the schooling sector 2007-2017. In Spaull, N. & Jansen, J. (eds): South African Schooling: The Enigma of Inequality. Springer.
  2. Fiske, E. & Ladd, H. (2004) Elusive Equity: Education reform in post-apartheid South Africa. HSRC Press; Brookings Institution Press. Washington DC.
  3. Mweli, M. (2018). Basic Education’s Role in Tackling Poverty. Basic Education Matters (2018: 1). Journal of the Department of Basic Education.
  4. Van Wyk, C. (2015). An overview of key data sets in education in South Africa. South African Journal of Childhood Education. 2015 5(2) 146-170.
  5. Van der Berg, S. & Hofmeyr, H. (2018). Background note on Education in South Africa. An Incomplete Transition: Overcoming the Legacy of Exclusion in South Africa. World Bank.

[2] Sampling, assessment and trends over time

Much of the economics of education involves analyzing sample-based surveys of educational inputs and learning outcomes. Of particular importance are the three international assessments South Africa participates in which are the Trends in International Mathematics and Science Study (TIMSS, Grade 9 Maths and Science conducted in 1995, 1999, 2003, 2011 and 2015), the Southern and Eastern African Consortium for Monitoring Educational Quality (SACMEQ, Grade 6 reading and mathematics conducted in 2000, 2007 and 2013), and the Progress in International Reading and Literacy Study (PIRLS, Grade 4/5; conducted in 2006, 2011 and 2016). This session covers issues of inter-temporal comparability, how surveys sample schools, representivity, basic statistical concepts in sampling, interpreting results from cross-national surveys and some of the literature that has looked at this issues in SA and sub-Saharan Africa.

Required readings:

  1. (SACMEQ) Ross, K., Saito, M., Dolata, S., Ikeda, M., Zuze, L., Murimba, S., Postlethwaite, N., & Griffin, P. (2005). The Cconduct of the SACMEQ II project. Chapter 2 in The SACMEQ II Project in Kenya: A Study of the Conditions of Schooling and the Quality of Education: Kenya Working Report. SACMEQ Educational Policy Research Series.

  2. (*) Chapters 1-4 of the Handbook of International Large-Scale Assessment: Background, Technical Issues, and Methods of Data Analysis (Rutkowski, L., von Davier, M., & Rutkowski, D., (eds).
  3. (Outcomes) Van der Berg, S. & Gustafsson, M. (2018). Educational outcomes in post-apartheid South Africa: Signs of progress despite great inequality. In Spaull, N. & Jansen, J. (eds): South African Schooling: The Enigma of Inequality. Springer.

Additional readings:

  1. (Access and quality) Spaull, N., and Taylor, S., (2015). Access to what? Creating a composite measure of educational quantity and educational quality for 11 African countries. Comparative Education Review. Vol. 58, No. 1.; Taylor, S., and Spaull, N. (2015). Measuring access to learning over a period of increased access to schooling: the case of Southern and Eastern Africa since 2000. International Journal of Educational Development. Vol. 41 (March) pp47-59; Lilenstein, A. (2018). Integrating Indicators of Education Qunatity and Quality in Six Francophone African Countries. Stellenbosch Economic Working Papers WP 09/2018. Stellenbosch.
  2. Spaull, N. 2012. SACMEQ at a glance series. Research on Socioeconomic Policy (RESEP). (Online). Available: http://resep.sun.ac.za/wp-content/uploads/2012/07/Spaull-2012-SACMEQ-at-a-Glance-10-countries.pdf [Accessed: 12 July 2018]
  3. Any of the recent South African reports on either TIMSS or SACMEQ
    1. (TIMSS Gr5) Isdale, K., Reddy, V., Juan, A., & Arends, F. 2017. TIMSS Grade 5 National Report: Understanding mathematics achievement amongst grade 5 learners in South Africa. Cape Town: HSRC Press.
    2. (TIMSS Gr9) Zuze, L., Reddy, V., Visser, M., Winaar, L., & Govender, A. (2017). TIMSS Grade 9 National Report: Understanding mathematics achievement amongst grade 9 learners in South Africa. Cape Town: HSRC Press.
    3. (SACMEQ 2013). DBE (2017). The SACMEQ IV Project in South Africa: A Study of the Conditions of Schooling and the Quality of Education. Department of Basic Education. Pretoria. (must be read in conjunction with popular press article below).

Popular press articles:

[3] #FeesMustFall: Who should pay for higher education?

Required readings:

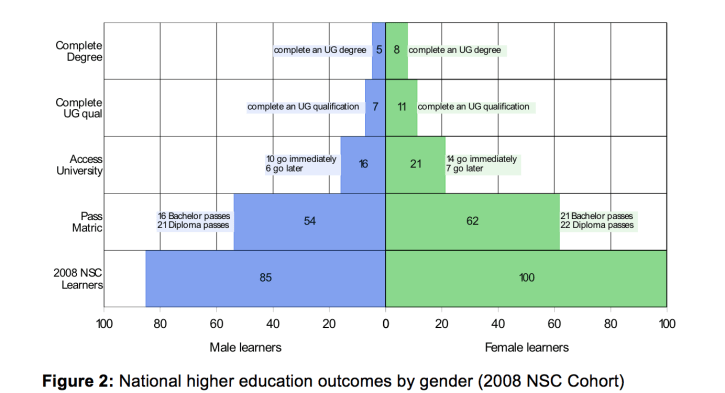
  1. Van Broekhuizen, H., Van der Berg, S., & Hofmeyr, H. (2016). Higher Education Access and Outcomes for the 2008 National Matric Cohort. Stellenbosch Economic Working Papers 16/16.
  2. *Chapman, B. (2006) Income Contingent Loans for Higher Education: International Reforms. Handbook of the Economics of Education (Vol 2) pp 1435-1503.
  3. Davis Tax Committee. 2016. Report on the Funding of Tertiary Education. (Online). Available: http://www.taxcom.org.za/docs/20171113%20DTC%20report%20on%20funding%20of%20tertiary%20education%20-%20on%20website.pdf [Accessed: 11 July 2018]

Additional readings:

  1. Van der Berg, S. (2016) Funding university students: Who benefits? Council for Higher Education (CHE). Kagisano, No. 10, p173
  2. UCT Students. 2016. Why Neoclassical Arguments against Free Education are Bullshit: And Why we need free education. (Online). Available: https://vula.uct.ac.za/access/content/group/fdf89eba-baa6-407c-ba96-3a3f959e6d29/Higher%20Education%20Crisis/Free%20Education%20Economics%20critique.pdf [Accessed: 12 July 2018]

Popular press:

 [4] The ins and outs of evaluation in education

Required readings:

  1. (RCTs) Kremer, M., Brannen, C., & Glennerster, R. (2013). The Challenge of Education and Learning in the Developing World. Science 340, 297 (2013)
  2. *(Boundary paper) Gustafsson, M. & Taylor, S. (2018). Treating schools to a new administration: Evidence of the impact of better practices in the system-level administration of schools. Journal of African Economics, 2018, 1-23
  3. Taylor, S. (2018). How can learning inequalities be reduced? Lessons learnt from experimental research in South Africa. In Spaull, N. & Jansen, J. (eds): South African Schooling: The Enigma of Inequality. Springer.

Additional readings:

  1. (EGRS) Cilliers, J., Fleisch, B., Prinsloo, C., Reddy, V., & Taylor, S. (2018). How to improve teaching practice? Experimental comparison of centralized training and in-classroom coaching. Unpublished manuscript.

Blogs:

[5] Inequality in South Africa: What do we know?

Required readings:

  1. Spaull, N. (2018). Equity: A price too high to pay? In Spaull, N. & Jansen, J. (eds): South African Schooling: The Enigma of Inequality. Springer.
  2. Taylor, S. & Yu, D. (2009). The importance of socio-economic status in determining educational achievement in South Africa. Stellenbosch Economic Working Papers: 01/09.
  3. Van der Berg, S. (2007). Apartheid’s enduring legacy: Inequalities in education. Journal for African Economies 16(5), November: 849-880

Additional readings:

  1. Fiske, E. & Ladd, H. (2004) Elusive Equity: Education reform in post-apartheid South Africa. HSRC Press; Brookings Institution Press. Washington DC.
  2. (*)Crouch, L. & Gustafsson, M. (2018) Worldwide Inequality and Poverty in Cognitive Results: Cross-sectional Evidence and Time-based Trends. RISE-WP-18/019. Research on Improving Systems of Education (RISE) (Online). Available: https://www.riseprogramme.org/sites/www.riseprogramme.org/files/publications/RISE_WP-019_Crouch-Gustafsson.pdf [Accessed 12 July 2018]

 [6] Early grade reading in South Africa: What do we know?

Required readings:

  1. Spaull, N. & Pretorius, E. (2018). Still falling at the first hurdle: Early grade reading outcomes in South Africa. In Spaull, N. & Jansen, J. (eds): South African Schooling: The Enigma of Inequality. Springer.
  2. (*) Pretorius, E. & Spaull, N. (2016). Exploring relationships between oral reading fluency and reading comprehension amongst English second language readers in South Africa. Reading and Writing. (29) 1449-1471 DOI: 1-23 10.1007/s11145-016-9645-9
  3. Snow, C. (2017). Early Literacy Development and Instruction: An Overview. The Routledge International Handbook of Early Literacy Education. Routledge.

Additional readings:

  1. (2013). NEEDU National Report 2012: The State of Literacy Teaching and Learning in the Foundation Phase. National Education Evaluation and Development Unit. Pretoria.
  2. (SA PIRLS Literacy) Howie, S., Combrink, C., Roux, K., Tshele, M., Mokoena, G., & Palane, N. 2018. Progress in International Reading Literacy Study 2016: South African Children’s Reading Literacy Achievement. Centre for Evaluation and Assessment. Pretoria.
  3. (PIRLS 2016) Mullis, I., O’Martin, M., Foy, P., & Hooper, M. (2017). PIRLS 2016 International Results in Reading. Progress in International Reading Literacy Study. TIMSS & PIRLS International Study Centre. Boston.
  4. Hoadley, U., 2012. What do we know about teaching and learning in South African primary schools? Education as Change, 16:2, 187-202
  5. Reardon, S., Valentino, R., Shores, K. (2012). Patterns of Literacy among US Students. Future of Children. (Online). Available: https://pdfs.semanticscholar.org/d337/b5bc4e54e325ffd1a67610b38279ad78ef39.pdf [Accessed 12 July 2018]

HSRC vacancies in education (deadline 31 July 2018)

rabbit.jpg

The HSRC has a new Education and Skills Development (ESD) director, Prof Sharlene Swartz who takes over from Dr Vijay Reddy. They are currently recruiting for a number of vacant positions. Info below…

“The seven funded vacancies we have are as follows:

  1. Research Director
  2. Chief/Senior Research Specialist (2 positions)
  3. Senior Research Specialist
  4. African Research Fellow
  5. Post-Doctoral Fellow (with two more to follow in 2019)
  6. Masters Intern (2 positions)

ESD has become well known for its work in skills development and assessment, including conducting the Trends in Intentional Maths and Science Study (TIMSS), and more recently the Labour Market Intelligence Project (LMIP). As we think about the coming 5 years as a research programme, there are tremendous societal challenges, and opportunities for research in the educational arena. Key questions we want to ask across our four focus areas include:

  1. Improving schooling outcomes: How do we improve the outcomes of children and young people in our schools? What are the implications of Grade R becoming compulsory? What, from existing research, do we already know should characterise the first 1,000 days of schooling? What are the implications of making history mandatory until matric? How could social justice best be promoted through the school curriculum for children and young people?
  2. Young people and the future of work: In a world of accelerating technological change, researchers are engaging with evidence of skills mismatches, un- and under-employment, and growing talk of a fourth industrial revolution. This prompts the question: what is the future of work? How can we understand the meaning and implications of rapid changes in the domains of automation, digitalisation, and biotechnology? How do we grasp the opportunities presented by these changes, and how do we mitigate the threats? Furthermore, what meaning do the current generation of young people attribute to work, and how do they see the future? How should the further and post-school education system change to respond? How might we better help young people face a world of fast-paced technological advancement, and help them to make a successful transition into a new world of work?
  3. Higher education and development: What role is there for higher education institutions (HEIs) in economic development and social transformation, including the development of new theory from the South? How best should teaching and learning, curricula, research and institutional cultures in HEIs be transformed or ‘decolonised’? What role is there for TVET colleges, and why are young people not attracted to these institutions? What can we learn from student activism over the past years, and how might this energy best be harnessed to bring about equality and justice for the future?
  4. Education for social justice: There is a growing call for ‘education for social transformation’ in the sustainable development goals, and an urgent need for anti-racism and citizenship education in South Africa. What should this look like in schools and higher education institutions that are already struggling to deliver basic content and ensure equitable pass rates? What can be learned from moral and human right’s education approaches? How can education about past injustices, social cohesion and education for equality best be achieved? What role is there for dialogue in education for social justice, and how might university students contribute to helping learners at schools navigate the terrain of anti-racism, transformation and equality?

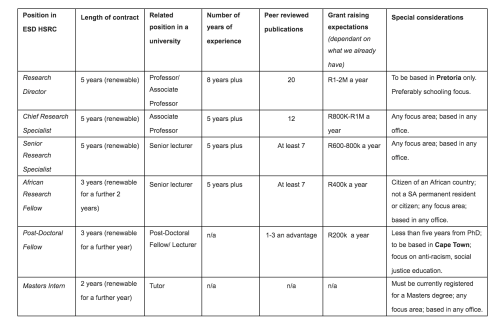
The closing date for application is 31 July 2018, and the application should be done through the HSRC skills map website  http://hsrc.jb.skillsmapafrica.com – which also contains a detailed set of requirements for each position. While the level of appointment offered will depend on a mix of qualifications, relevant experience and the number of peer-reviewed publications (articles, chapters and books), the following table provides an indicative guide regarding criteria for each position.

Screen Shot 2018-07-11 at 09.55.23.png

Education research…

barca

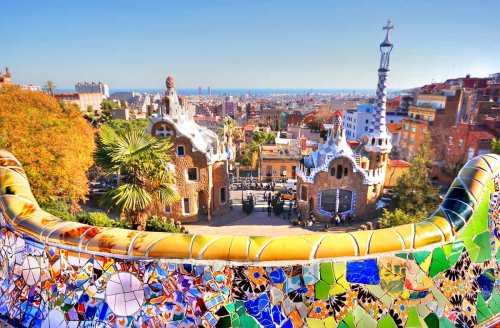
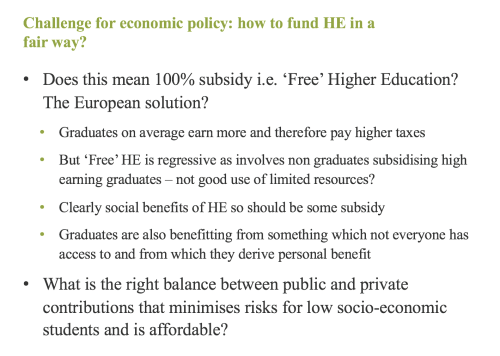
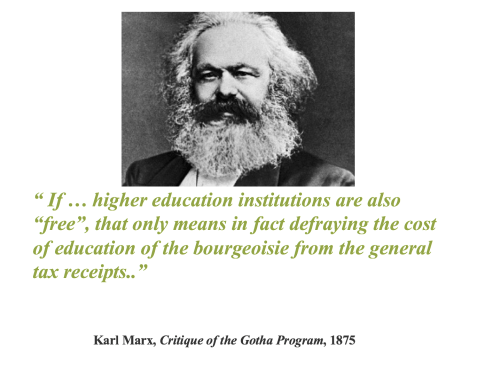
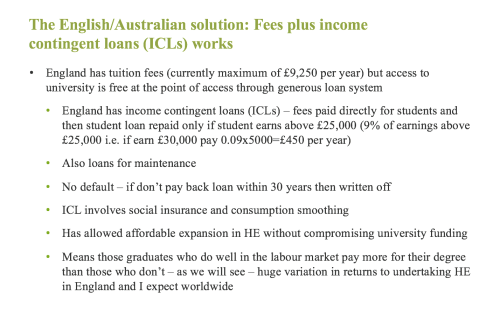
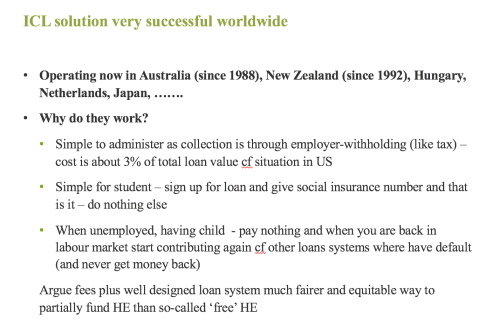
This week was the 2018 AEDE conference in Barcelona and Prof Lorraine Dearden gave the keynote address: “Higher Education Funding, Access and Returns: Policy Lessons from England” which was so relevant for South Africa given all the recent decisions about free higher education for poor and working class students. I include some slides from her presentation:
Screen Shot 2018-06-29 at 15.46.29
Screen Shot 2018-06-29 at 15.46.37
Screen Shot 2018-06-29 at 15.46.52
Screen Shot 2018-06-29 at 15.47.04
—————————————————————————-
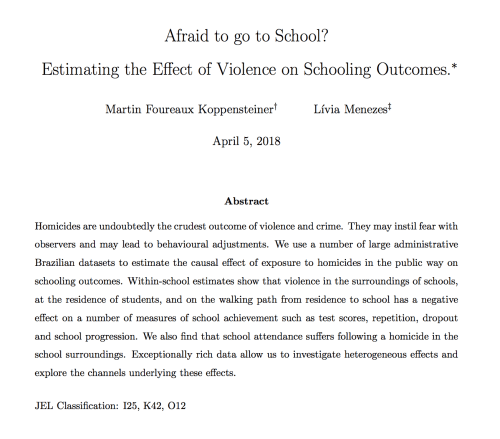
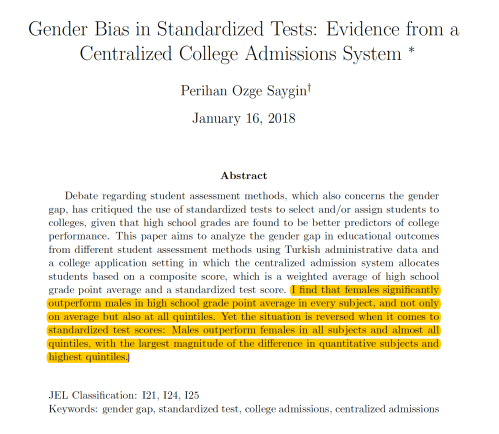
Some other great papers (and abstracts) from the conference:
Screen Shot 2018-06-29 at 10.15.44


screen-shot-2018-06-29-at-15-41-21.png


Video of panel discussion: Teaching reading in African languages (13 June 2018)

For those of you that couldn’t be at the panel discussion on “What do we know about teaching early grade reading in African languages?“, the video of the event is now on YouTube here.

Fishtank-Flyer-email

Links I liked…

c836f1a0dad0899f388d2d84e5fc2258

These are some things I’ve been reading and listening to over the last while. Sharing is caring 🙂 Post yours in the comments below…

  • “Bread and roses” – political slogan and poem – sung by The Radcliffe Pitches  (thanks Brett!). The phrase “Give us bread but give us roses too” resonated with me as the most succinct way of expressing that the fight for dignity is about more than meeting basic needs.
  • Linked to the above poem, I really enjoyed Joel Modiri’s article “The Law’s Poverty” and the clash between an a-historical human-rights approach to the law and a historically-situated “justice” approach to the law.
  • “To be or not to be” – Masha Gessen on choice, Jewishness, identity, emigration and America (thanks again Brett!)
  • STARI – Excellent resources on reading in Middle School (Grade 6-8). The STARI project run by Catherine Snow –
  • WordGen – More resources on developing vocabulary through a 72-week discussion program (Catherine Snow’s baby)
  • Huapango – a Mexican folklore ballet showcasing the incredible cultural variety and richness of the Mexican peoples. Each part of the song was created with a one group in mind and the ballet showcases their traditional dances and outfits. I’ve been listening to this on repeat for about a month (Thanks Victor!)
  • Jonathan Jansen’s address to the Stanford Senate: “The case for the Academic Senate” – I include an excerpt from that address below:

“What does this say about the role of the Senate? Quite simply, the question of knowledge is at its root a question of agenda-setting in any Senate. This points to leadership, of the President and in particular of the Senate executive. A university Senate has a choice. It can be primarily a place of administrative regulations, rules and procedures but it can also be an arena in which the “big questions” of academy and society come to enjoy prominence on the Agenda.  I wish to suggest five such big questions (the first already referenced earlier) that should constitute a major part of the agenda of Academic Senates concerned with the purposes of a university in the 21st century:

(1) The representational contents of the curriculum (what we teach)

It matters enormously that Senates step back on a regular basis and ask questions about knowledge, identity and curriculum. What knowledge matters in the 21st century? Whose knowledge “makes it” into the curriculum? And is the Stanford graduate in any field of study equipped to encounter and act on a complex (integrated and divided) world?

(2) The complexion of the professoriate (who teaches)

It does matter that a Senate asks questions of who teaches. The strength of the best universities in the world depends crucially on the recruitment of the best talent across contexts, cultures and countries. It also conveys to students (and faculty) a crucial point that advanced knowledge is not locked up in one race, gender or culture.

(3) The diversity of the undergraduate (and also graduate) enrolments (whom we teach)

It matters that a Senate keeps returning to the question of who the student is we are privileged to teach. All students benefit from the knowledge that comes with learning from and alongside students from different class, race and ethnic backgrounds but also from other countries. (It always puzzles me that a university can boast, for the purposes of improved rankings, about the exclusivity of its entering first year class). It is also true that the strength of Stanford’s academic programs has always depended on the recruitment of the most talented graduate students on the planet.

(4) The methods of teaching (how we teach)

It is difficult to imagine a Senate in the heart of the Silicon Valley not returning to the agenda the question of the best technologies (in the broadest sense of the word) for teaching in this century. I know Stanford does this well. And yet efficacious teaching is about much more than technology-led instruction or teaching innovations in the classroom; it is about powerful teaching that engages student minds, develops criticality, stirs social and intellectual discomfort, and prepares those who seek learning to become comfortable with uncertainty. In short, how does the Stanford Senate account for teaching in this large and complex institution?

(5) The impacts on learning (whether teaching matters)

An academic Senate agenda should be concerned with the question whether what we teach matters in the lives of students. Powerful teaching is only evident in powerful learning. But this has to be assessed beyond the limiting confines of passing or failing in modules, courses or even degrees. Such assessment asks questions about the enduring effects of the educational experience beyond marketing anecdotes or even “feedback loops” from the corporate environment. Do graduates from this great university do much more than earn a living on a well-paid job? That surely must be among the broader purposes of a Stanford education and, therefore, a concern of the Senate.”

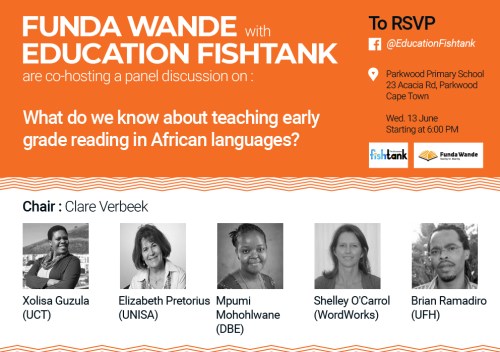
Reading in African Languages (panel discussion – CT – 13 June)

Fishtank-Flyer-email

Funda Wande, together with the Education Fishtank will be co-hosting a panel discussion on the topic “What do we know about teaching early grade reading in African languages?” There is great line-up of panelists and I’m sure it is going to be a really interesting discussion. To RSVP click HERE.

Reading in African Languages: An Annotated Bibliography 2004-2017 (Pretorius, 2018)

reading

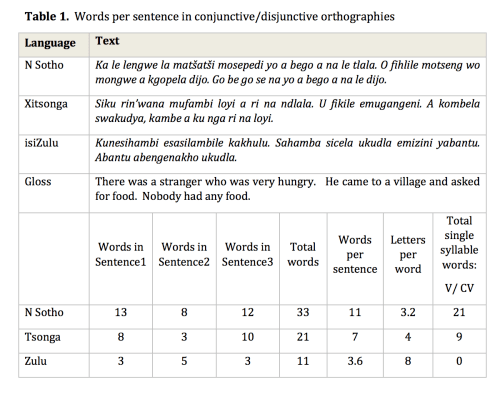
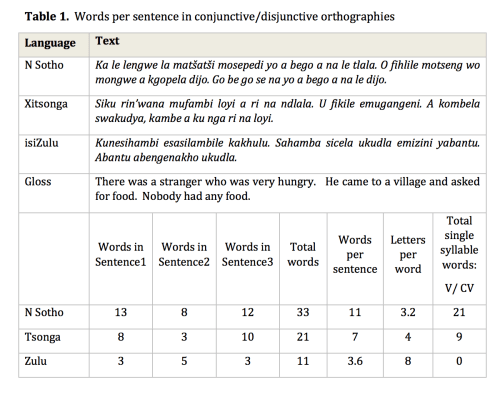
I think there is now broad-based agreement that most South African children do not acquire the skills and dispositions they need to read for meaning and enjoyment. The PIRLS Literacy 2016 results show that 78% of Grade 4 students couldn’t read in any language. The way forward is therefore to ‘get reading right.’ Given that more than 70% of South African children learn to read in an African language in Grades R-3, we need to understand more about how children learn to read in these languages, and that inevitably involves research. Do children from different language groups learn to read in different ways? The language structures (orthographies) of South African languages are quite different to each other. As we’ve pointed out in some of our earlier work, the same sentence in different languages looks very different:

reading2

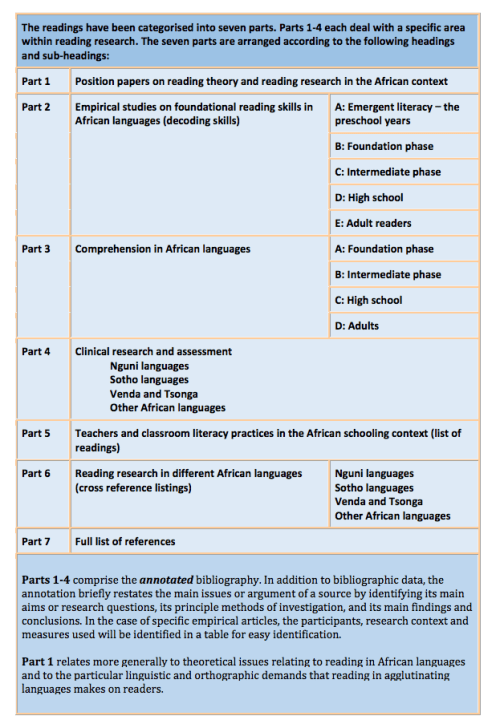
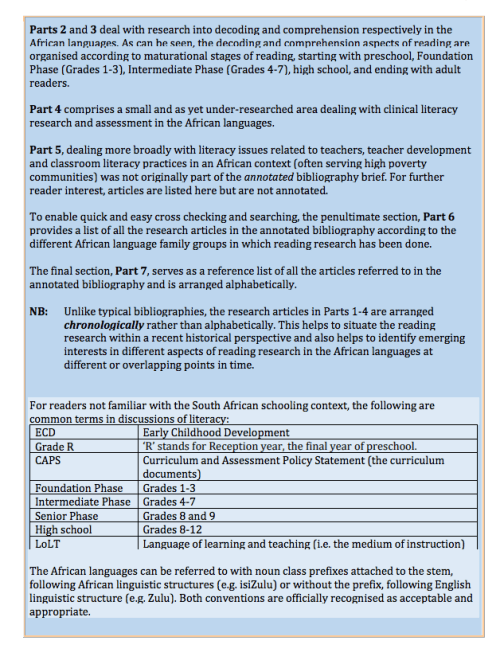
Should we be teaching Nguni languages (isiZulu, isiXhosa, SiSwati etc.) and Sotho languages (SeSotho, Setswana, Sepedi) in different ways? Or are these just peripheral differences that don’t change the overall approach. At the moment there is not a large body of research on this. However, Prof Lilli Pretorius has recently published an annotated bibliography of 40 studies (2004-2017) titled “Reading in African Languages an Annotated Bibliography 2004-2017“ under the PRIMTED banner. I include their blurb below:

“This annotated bibliography was compiled by Professor Lilli Pretorius of UNISA as part of the Primary Teacher Education Project (PrimTEd). It gives a summary account of research that has been done on reading in African languages from 2004 to 2017, more specifically on languages belonging mainly to the family of Southern African Bantu languages. It comprises over 40 annotated entries, mainly research articles from accredited journals, chapters from books and postgraduate dissertations or theses, and also lists several other sources closely related to reading in the African languages. Although it was originally compiled in 2017, it is designed in such a way that new entries can be added to it as new research emerges, and it will be regularly updated.”

Screen Shot 2018-05-22 at 11.20.43

Screen Shot 2018-05-22 at 11.20.59

This is a great resource both for those just starting out in the field, but also for established researchers looking for an overview of what’s out there.

Many thanks to the Lilli and the PRIMTED team for doing and initiating this important work. I believe the English-as-First-Additional-Language (EFAL) annotated bibliography is soon to be released.

For those interested here is my Q&A with Lilli from 2014.

The stories we tell ourselves

rainbow

There are not many things that are perennially interesting to me, but one of them is the stories that we tell ourselves. We sometimes think that what we do, or think, or feel is  just a reaction. ‘Such-and-such happened which is why I acted or thought or felt the way I did’. Yet so much of how we experience the world is determined by the stories that we tell ourselves. The charming, gay neurologist Oliver Sachs puts it well:

“We have, each of us, a life-story, an inner narrative – whose continuity, whose sense, is our lives. It might be said that each of us constructs and lives, a “narrative”, and that this narrative is us, our identities. If we wish to know about a man, we ask “What is his story – his real, inmost story?” for each of us is a biography, a story.”

I’m currently thinking about this in relation to inequality and education in a chapter I am working on, but that’s more about a collective story that we tell ourselves as a country. Thomas Piketty tells us that “Inequality in every country needs to be justified. You need to tell a story about why this level of inequality is acceptable or unacceptable.” That one quote has been really generative for me lately but right now I’m thinking about  stories on a personal level.

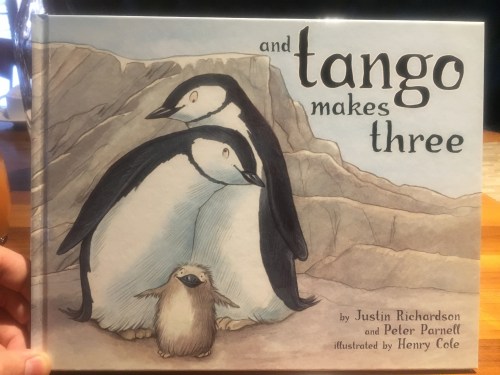
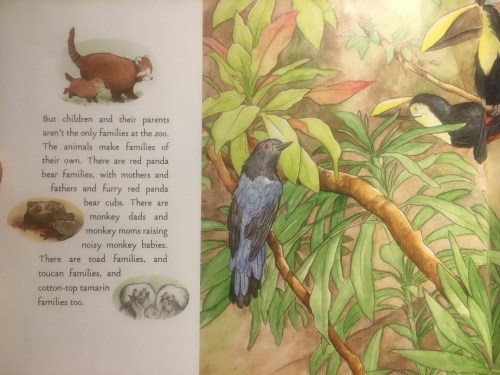
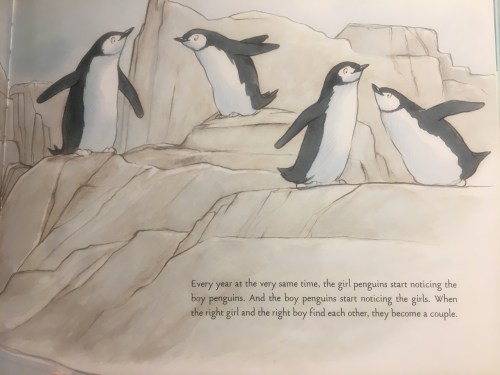
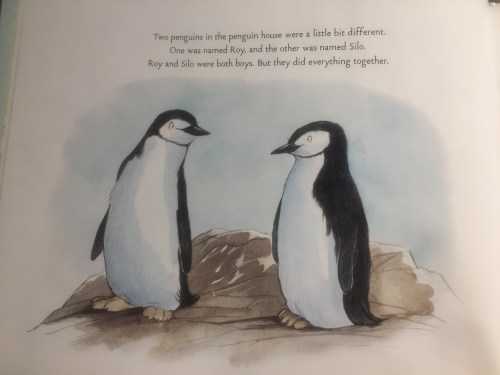
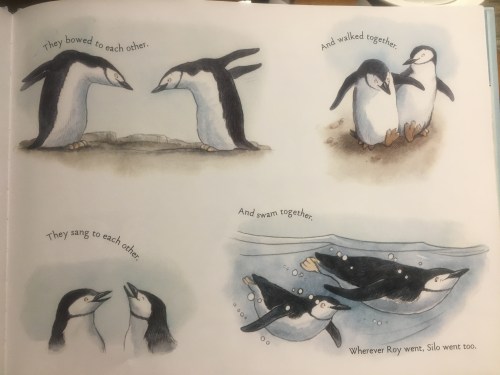
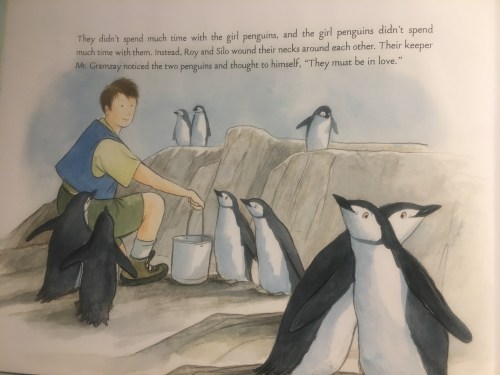
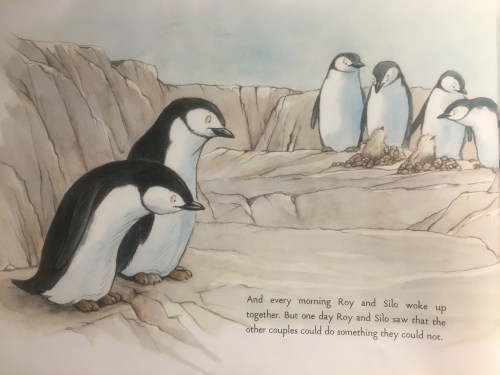
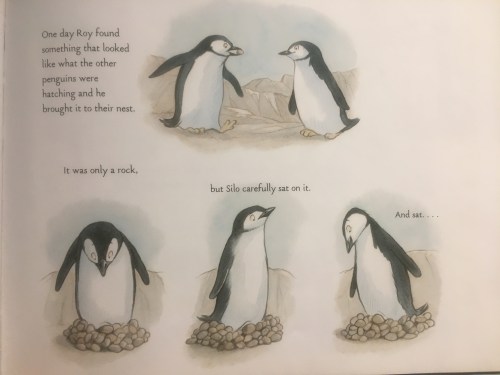
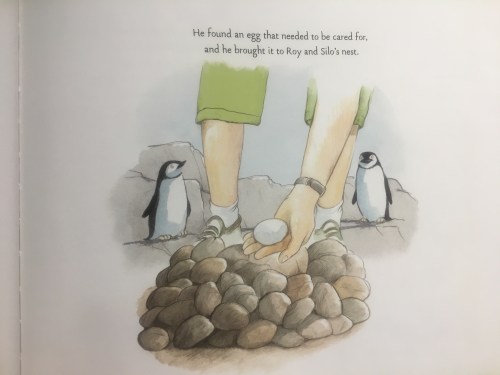
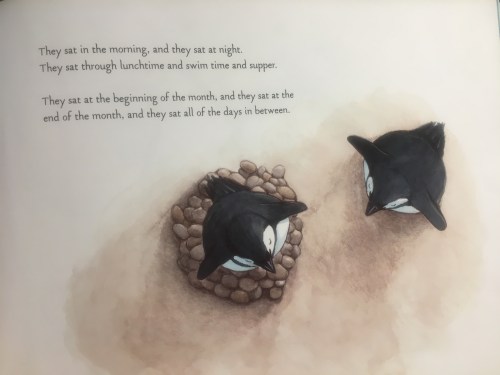
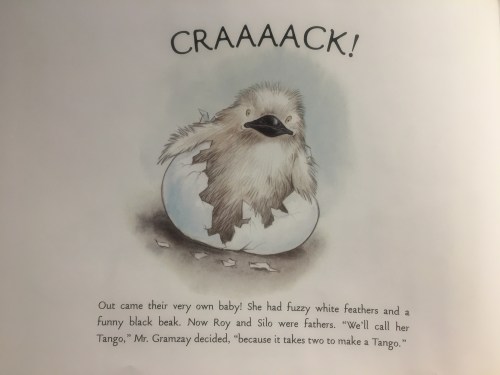
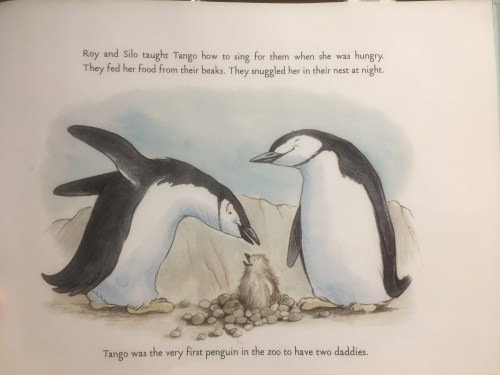
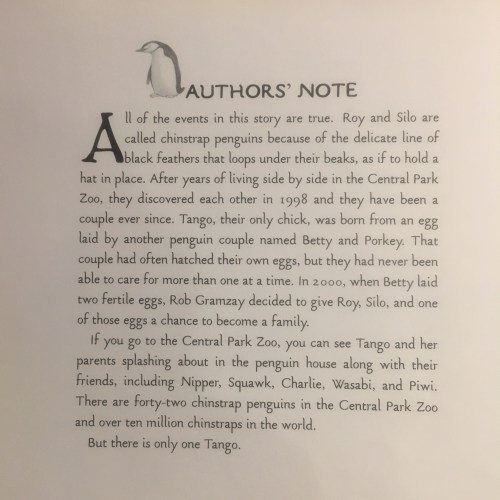
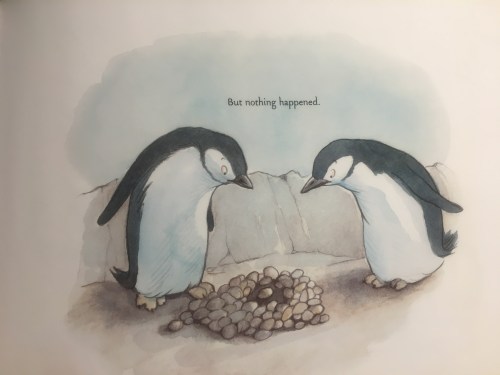
While I was overseas for a conference last week I came across a children’s book called “and tango makes three” by Justin Richardson and Peter Parnell. I love buying my niece and nephew books to read because they can never have too many books. But this book hit home for me and actually made me teary in the book store. I thought I’d share it here in the hope that others will come to the same realisation I did…


IMG_4617IMG_4606IMG_4607IMG_4608IMG_4609IMG_4610IMG_4611IMG_4620IMG_4619IMG_4612IMG_4613IMG_4614IMG_4616

IMG_4604

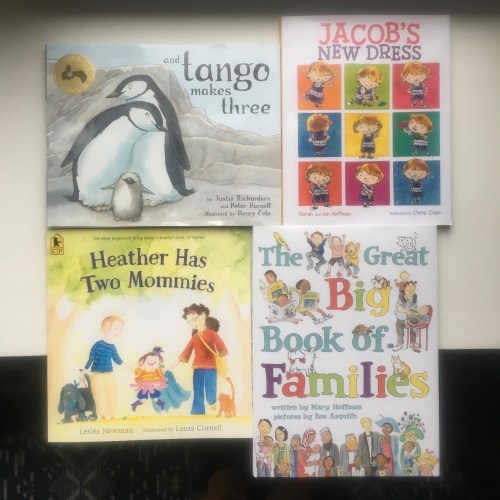
This last page was especially moving for me. As someone who grew up gay in a straight world, all the stories I was read as a child (and in fact all the books that existed in our bookstore and our library) had only straight characters. Princes marrying princesses, boys building, girls cooking, and any number of iterations on traditional gender roles and ‘normal’ sexual identities. Now that we do have stories stories with gay protagonists or children that don’t fit the norm I think some parents are reluctant to buy them. Their logic (I think) is that they don’t want to influence their child’s sexuality – or, more accurately, – to influence them in a non-heterosexual way. I find this incredibly ignorant. Nine times out of ten when you probe modern educated parents (and scientists and geneticists) they will agree that sexuality and gender identity are more likely to be about genetics (or epigenetics) than anything else. Yet this persists.

What they seem to miss is the quiet violence done to their children by presenting only one version of the world, one story, and possibly one that they do not see themselves in. Children map the world by the stories they are told and the stories they learn to tell themselves. Brene Brown has this great quote where she says that if you go around looking for a reason why you don’t belong, you will always find one. And I think this is one of the costs of growing up and not seeing yourself represented in the stories you’re told. You feel you don’t belong.

I want my niece and nephew to grow up in a world where they know that whoever they  are, they belong. Different ≠ wrong. The stories we tell ourselves, and the ones we tell our children, matter. My niece and nephew have hundreds of books with stories about everything under the sun. I want to make sure that I’m in one of those stories, and that if they are too, that’s also totally OK. Whoever they are and turn out to be, they belong.

fullsizeoutput_376

Throwing basic education under the bus (My Business Day article)

The article below first appeared in the Business Day on the 16th of April 2018. Their link here.

Basic Education Funding

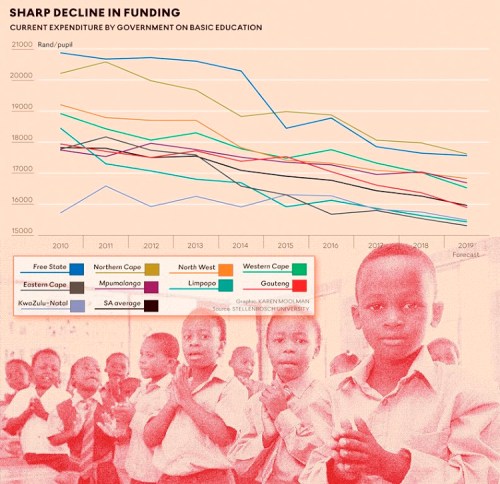
It’s not every day that Treasury reports can make you want to drink in the middle of the day. Then again, it’s not every day you realise a country-wide crisis has been brewing under your nose for a decade and no one noticed it. Over the last seven years there has been a consistent decline in the purchasing power of per-learner expenditure on basic education and no one has said a thing. To put it bluntly, funding per learner has declined by 8% in seven years. In so many ways this undoes any of the advances we think we might have made in education over the last seven years.

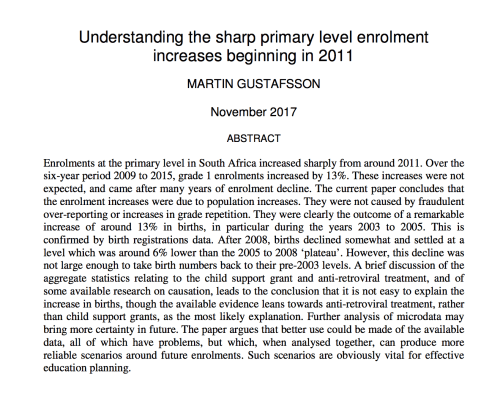
For a while now we’ve known that something funny happened in South Africa between 2003 and 2005 when births spiked by 13% and continued to stay high for a few years before coming down slightly in 2008. The leading explanation at the moment is the roll out of antiretrovirals (ARVs) over the same period. True to form, Grade 1 enrolments spiked by 13% five years later in 2008 with subsequent enrolment data showing this cohort slowly working its way through the education system with similarly large cohorts following in their footsteps each year. This group, which we’ve dubbed the ‘silent ship’ in our research group, is now in grade 8 in 2018. This weird demographic phenomenon has been confirmed by Martin Gustafsson’s comprehensive analysis of three different datasets; the Home Affairs birth registration data as well as age-specific data in the Department of Basic Education’s Annual Survey of Schools (ASS) data and the Learner Unit Record Information Tracking System (LURITS).

The aggregate effect of these increased births (and higher retention in the schooling system more generally) has meant that there were about 670,000 more learners in 2016 than there were in 2010. That means larger classes together with fewer books and fewer teachers per learner. But this is only half the story behind this unknown crisis. The other half is that there have been above-inflation increases in teacher salaries for over a decade. A decade of government gazettes together with Treasury’s Estimates of Provincial Revenue and Expenditure (EPRE) documents shows that between 2010 and 2016 teacher salaries increased by 57% compared to a 38% increase in the CPI (regular inflation). The problem with this is that total expenditure on education has only been increasing by inflation, or about 7% a year and therefore hasn’t kept up with these two factors (increased enrolment and above-inflation salary increases). Seen together this has translated into a significant decline in the purchasing power of expenditure on basic education between 2010 and 2017. Looking at the Medium Term Expenditure Framework the decline is set to continue. In 2010 we spent R17,822 on average per child dropping to R16,435 in 2017 and projected to decrease further to R15,963 by 2019 (all in 2017 Rands).  This is a 10% decline in per learner funding in ten years (2010 to 2019).

This decline in state funding is already starting to show up in international assessments. According to the Progress in International Reading and Literacy Study (PIRLS) the average class size of Grade 4 classes in South Africa was 40 in 2011 which has now increased to 45 learners per class in 2016. Yet this masks that the largest increases were found in the poorest schools. Among the poorest 60% of learners, class sizes increased from 41 to 48 learners per class between 2011 and 2016. For the richest 10% of learners, class sizes only increased from 33 to 35 learners per class. Over the same period there was no improvement in reading outcomes across the country. It’s highly unlikely that this systematic decline in per learning spending over the last seven years is unrelated to the stagnant learning outcomes reported in PIRLS over the same period.

Given the centrality of correct discounting to the overall findings here it is worth briefly explaining why using a traditional inflation rate is inappropriate for education. This is also likely the reason that this fact has gone largely unnoticed in South Africa. Essentially, because total expenditure on basic education has increased by 7,1% per year between 2010 and 2017 – keeping up with the Consumer Price Index (CPI) inflation over the period – most analysts have thought that the education budget has been keeping pace with the overall rise in costs. But CPI is the wrong index to deflate education expenditures because more than 80% of expenditures are on teacher salaries rather than a typical basket of goods. The salient question when discounting expenditures on education is thus, “How much money is required in 2017 to buy the same level of inputs used in 2010?” To do this requires the construction of an education-specific discounting index that is weighted at 80% of the cost of teachers (calculated using wage-bargaining agreements in the Education Labour Relations Council) and 20% weighted at regular CPI (for non-personnel expenditures like textbooks). Using this composite index allows us to ask how much it would cost to buy the basket of education ‘goods’ that we bought in 2010 (80% teachers and 20% non-teachers). The results are alarming. Figure 1 above shows the overall trend in per learner purchasing power in each province between 2010 and 2019 (all figures in 2017 Rands and 2017 to 2019 figures are based on MTEF projections).

All of the above is even more concerning in the context of ongoing fiscal austerity and significant increases in budget allocations to higher education. As a result of the #FeesMustFall movement, former President Zuma announced a new government policy of free higher education for poor and working-class families (reiterated by President Ramaphosa in 2018). This is now reflected in the 2018/19 budget where Higher Education received an additional R57 billion over the next three years to fund the new mandate. Basic education is being thrown under the bus as higher education becomes the new shining star.

Without detracting from the importance of decreasing financial exclusion to higher education for poor and working-class students, it must also be stressed that at most 15% of a cohort go to higher education in South Africa. Among the poorest 70% of the population it is less than 5% of a cohort who actually enter university. The battle is won or lost in primary school. Given the hierarchical nature of schooling and that university access and success are predicated in the foundations built in primary school and high school, it is an extremely short-sighted policy to continue on the current trajectory of declining per-pupil public expenditure on basic education and rising per-pupil public spending on higher education.

To all who have the inclination to look it is clear that the low quality of primary schooling in South Africa is the binding constraint – both to further educational success, but also to dignified employment, meaningful civic engagement and economic growth. Our most recent assessments show 78% of Grade 4’s can’t read for meaning and 66% of Grade 5’s can’t do basic maths. There is no conceivable route for South Africa to move from the status quo to any desirable future that does not first chart the route of significant improvements in primary education. And to put it bluntly, that is simply not possible when the overall pie is shrinking, a shrinking that is felt most severely by the poorest learners in the most challenging contexts. Treasury needs to re-assess how it is funding basic education and explain why there has been a significant decline in the actual resources available on the ground to educate South African learners.

The Comprehension Iceberg: Developing reading benchmarks in African languages

The-Iceberg-Illusion-SOURCE-openlab.ncl_.ac_.uk_

For the last few years we have been working on a project exploring reading in three African languages; isiZulu, Xitsonga and Northern Sotho (Sepedi). This was part of an ESRC-funded study looking at “Leadership for Literacy” and schools in challenging contexts. This week we published the first of a series of working papers on some of our results. The paper is titled “Investigating the comprehension iceberg: Developing empirical benchmarks for early grade reading in agglutinating African languages  (2018) and is co-authored with colleagues and friends Prof Elizabeth Pretorius (UNISA) and Mpumi Mohohlwane (DBE), who is now also doing her PhD at RESEP.

In the paper we argue here that we need to move beyond a repetitive focus on low comprehension outcomes; this is simply the tip of the iceberg. Below the surface there is widespread evidence that most children have not acquired the basic ‘tools’ for reading success – the ability to accurately and fluently decode letters and words and move from an effortful activity to an automated skill. Knowing that 78% of Grade 4’s cannot read for meaning in any language is important and sobering information, but probably not as helpful as knowing which components of reading children are struggling with and why teachers are struggling to teach them.  If children and teachers are ‘falling at the first hurdle’ (Taylor, 1989) does it make sense to focus on the seventh or eighth hurdle and ask why learners and teachers are not making it over?

One of the important contributions of the paper is that we try to estimate benchmarks for these three African languages. While many benchmarks exist in English there are currently no benchmarks in African languages and unfortunately you cannot just version the English benchmarks for the African languages because the language structures (orthographies) are so different. This is easiest to explain using an example:

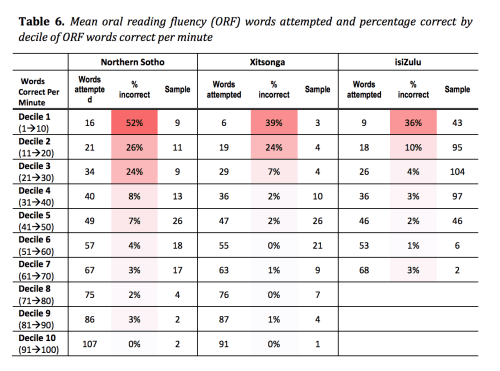
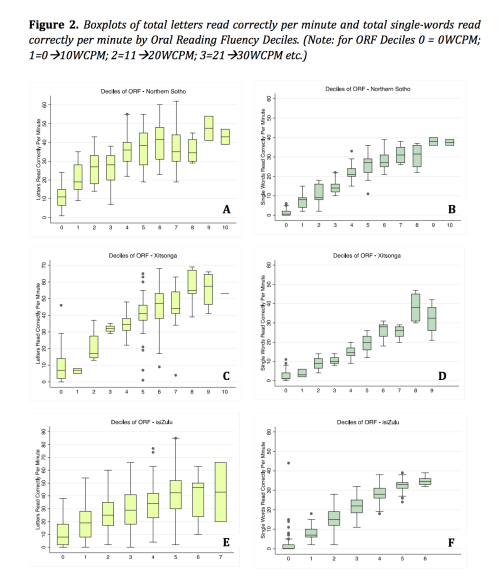
Screen Shot 2018-03-13 at 11.08.10 AMSo in isiZulu the first sentence is only 3 words while in Northern Sotho (Sepedi) it’s 13 words. We go on to show that there are also large differences in ‘required fluency’ across these languages and that accuracy rates and speed differ between conjunctive and disjunctive languages – see below.
Screen Shot 2018-03-13 at 10.54.39 AM

“Comparison across the languages shows that accuracy seems to be more important for fluent reading in isiZulu than in Northern Sotho or Xitsonga. The isiZulu learners reading at 21 wcpm or faster are reading with 95% accuracy or higher. In contrast, 95% accuracy is only associated with reading at 51 wcpm or faster in Northern Sotho and 31 wcpm or faster in Xitsonga. One of the reasons why Decile-1 learners are reading so slowly is that they are making mistakes on every second or third word. The fastest Northern Sotho readers (wcpm=107) and Xitsonga readers (wcpm=91) in the sample made no mistakes whatsoever.” (p12)

This can also be seen visually:

Screen Shot 2018-03-13 at 10.55.10 AM

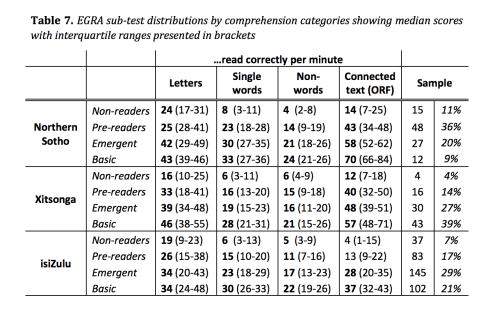
We then use this information and some rudimentary comprehension outcomes to benchmark the different languages:

Screen Shot 2018-03-13 at 10.54.55 AM

We’d encourage those interested in this type of work to read the full paper – if you have any comments or suggestions we’d love to hear from you! Please include them in the comments below.

 Abstract

The importance of learning to read in mother-tongue is widely acknowledged in the linguistics literature yet reading acquisition in African languages remains under-researched and under-theorized. While numerous studies have highlighted the low levels of comprehension among learners reading in African languages in South Africa, little has been done to understand what lies beneath this ‘comprehension iceberg.’ In this paper we present new empirical evidence on reading outcomes and the subcomponents of reading for 785 Grade 3 learners across three languages (Northern Sotho, Xitsonga and isiZulu), drawn from 61 primary schools in South Africa. This is the largest sample of such learners to date. Using an adapted EGRA-type assessment we assessed letter-sounds, single-word reading, non-word reading, oral reading fluency and oral comprehension. From this data we present results on fluency, accuracy and comprehension and how these might relate to each other in these morphologically rich agglutinating languages. We also show that there are large differences in reading subcomponents between languages with conjunctive and disjunctive orthographies. Our results suggest that there are minimum thresholds of accuracy and oral reading fluency in each language, below which it is virtually impossible to read for meaning. These are 52-66 wcpm in Northern Sotho, 39-48 wcpm in Xitsonga and 20-32 wcpm in isiZulu. We argue that there is a strong need for empirical language-specific norms and benchmarks for indigenous African languages and present our benchmarks for these three languages as a move in that direction.

“A city drowning in incompetence” – my Daily Maverick rant about the water situation in CT

water

(This article was first published in the Daily Maverick on the 22nd of January 2018.)

A city drowning in incompetence

This week the City of Cape Town announced that at the current rate the taps will run dry in Cape Town on the 21st of April and will soon announce the City’s 200 water collection points. These are central locations that can be secured with riot-police and include places like sports fields and schools. The Mayor has explained that after the 21st of April “citizens would line up to receive up to 25 liters of water per person, with a separate queue for the differently abled. Prior to filling their vessels, each person would be given a dose of hand sanitizer.”

I’m sorry but, what the fuck?!

How the hell did we get this close to what will be the biggest natural disaster of the post-apartheid period and the majority of Cape Townians are carrying on business-as-usual? Only 39% of residents are using less than 87l of water – the previous, and now surpassed, restriction (the current restriction is 50l person). In history, it has never happened that a city the size of Cape Town has run dry. As a Canadian headline announced this week: “Cape Town at risk of becoming the first major city in the world to run out of water” (Globe & Mail).

It is clear that there has been an outright failure of leadership in the City of Cape Town. How is it that we have been having a drought for more than 1000 days, with water management experts advising the City on a constant basis and yet only now, with 90 days to go they are escalating things? Patricia De Lille has been the mayor of Cape Town for more than 6 years and the DA has run the Western Cape for more than 7 years. It’s been years in the making. It is beyond clear that the blame for this crisis lies ultimately with the City of Cape Town and their too-little-too-late responses to an imminent catastrophe.

How has the City not already exacted drastic action to ensure that we never reach Day Zero? Why has it taken so long to radically and drastically escalate the issue in the public’s mind? The province’s ‘Resilience Officer’ dealing with the drought is currently on gardening leave because of an internal spat about the MyCiti Bus procurement processes. The media strategy of the City of Cape Town is an absolute disaster. Why has the Province not passed emergency measures in the legislature to require all Western Cape targeted media outlets to devote at least 10% of their prime-time coverage to either public service announcements on the drought or how to reduce water consumption? Why is there no blimp above the CBD announcing “Day Zero: 21 April! REDUCE WATER or taps run dry”? Instead the City pushes its pathetic #ThinkWater message. Who is advising the City on their public relations campaign?! This is about an imminent natural disaster, not a preschool slogan for Water Day. If I can get daily SMSes for insurance I don’t want, or from political parties I won’t vote for, why can’t I get SMSes about what DayZero looks like, where my local water collection point is or some equally-scary information to make me change my behavior?

Tom Eaton points out that in 2018 Mmusi Maimane has tweeted as many times about his child’s first day of school as he has about the largest natural disaster in the post-apartheid period, that is to say, once. Of the 76 tweets in 2018 by @CityofCT (their official Twitter account) less than a quarter have been about water. More than half are inane messages like “Top of the morning to you, Cape Town. With a high of 22, you can expect clouds and sunshine with a windy afternoon.” I don’t want the City to wish me a joyous morning and a jolly good night. I want them to make sure that I have water in my taps.

Why has Helen Zille not called for a localized State of Emergency, which Section 37, 1(a) of the Constitution makes express provision for. That is, that Parliament can declare a State of Emergency in the event of a “natural disaster or other public emergency.” A city of 4-million people running out of water sounds like the definition of a natural disaster to me.

Of the City of Cape Town’s 7 big initiatives to get more water online (V&A, Strandfontein, Monwabisi, Harbour, Cape Flats, Atlantis and Zandvliet), 6 are delayed and behind schedule. The City’s threats of fining excessive users or throttling their water have not materialized. Together with these empty threats and in-fighting within the DA, the City has not managed to get water pricing right or publicly shame non-compliers? Why is there no publicly available list of the top 200 addresses that are openly flouting the City’s restrictions?

It’s also not as if this is the first time this has happened in the world. From 1997 to 2009 Australia faced the Millennium Drought. Melbourne, also a city of four-million people, managed to drastically reduce water consumption by 50% and pre-emptively implement a slew of policies and programs to avoid a humiliating and dystopian scenario of a city running dry. This included setting up an emergency body mandated with decision-making during the drought. It had an expert advisory group with independent experts and full transparency (Google “Low and Grant 2015 Fighting drought with innovation” for an academic overview).

The fact that we are approaching a natural disaster and the majority of Cape Townians are still living their best lives and ignoring the extremely mild reproaches of government means that someone needs to take drastic action. Whether that is the Premier, the Mayor or the President remains to be seen. Whoever takes up that mantle needs to step into the vacuum that has been left by a wave of incompetence and denialism. Call an emergency lekgotla with all the MECs, the top 50 CEOs, the vice-chancellors of universities, editors of newspapers, the heads of civil society etc.  Pass legislation that needs to be passed, take out full-page ads in every newspaper every day. How is this not the single most important thing happening in our province at the moment?!

This is not about the ineptitude of some dingy Department of Water official failing to plan properly but about politicians and bureaucrats doing too little too late. The scale of this crisis is such that, if unresolved, it could cripple the City. A fall in tourism, a loss of jobs, declines in property prices, widespread sanitary diseases. That sounds quite dystopian, but that’s what happens when the taps run dry. The DA and the City of Cape Town need to accept that they should have escalated this issue far sooner, and then begin a massive escalation initiative to hit the complacent middle-class with real consequences. The time for kumbaya messages is over.

*Note, DM made a few edits and I chose to keep my original wording 🙂 

My Sunday Times article on Matric 2017

space

(This article first appeared in the Sunday Times on the 14th of January 2018).

The real matric pass rate and the real site of failure in education

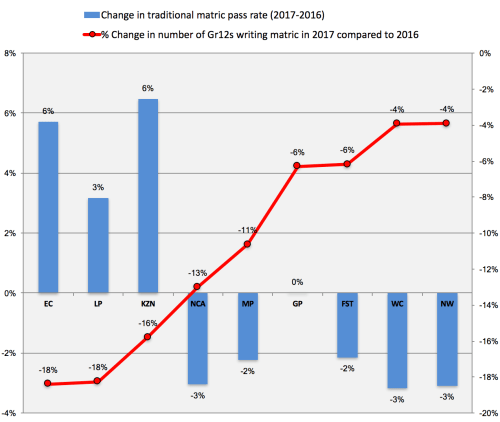
Every year the matric results come out and the whole country goes ballistic. Matric is on the front page of every newspaper and swamping the radio waves and TV stations of our country. And suddenly everyone has an opinion about what’s going on in education. “The Free State is the best province”, “We should ban the IEB and have one exam”, “The rising pass rate shows our interventions are working”. No. No. No. None of this is true. Firstly, the rising pass rate – from 73% in 2016 to 75% in 2017 is purely a function of more students being held back and dropping out. In 2017 there were only 401,435 passes compared to 442,672 in 2016 – that’s a 9% decline in one year. So why were there 40,000 fewer matric passes? It’s not because the population dropped by 9% in one year (it did go down but only by about 4%). It’s not because more candidates moved to writing their matric part-time (and therefore aren’t included in the ‘official’ pass rate); there were only 11,462 additional part-timers in 2017 compared to 2016. And it’s definitely not because there are fewer progressed learners (there were 108,742 in 2016 and 107,430 in 2017, basically the same). So we know it’s not the cohort, it’s not part-timers, and it’s not progressed learners, so what is it? Basically more kids are dropping out or being held back than in 2016. It’s also no surprise that the only provinces with increasing matric pass rates (Eastern Cape +6%, Limpopo +3% and KwaZulu-Natal +6%) were also the provinces with the largest declines in the numbers writing matric (-18%, -18% and -16% respectively). So the high-level take-home is that the more you ‘cull’ and ‘gate-keep’ the more your matric pass rate increases. It also means we have 5% fewer Mathematics and 10% fewer Physical Science passes in 2017 compared to 2016.

So what is the ‘real’ matric pass-rate. A lot of people have been asking this question, including myself, and it turns out it’s a little more complicated than one thinks. Occasionally we calculate ‘throughput pass rates’ (matric passes divided by grade 10 enrolments 2 years earlier or Grade 2 enrolments 10 years earlier), yielding figures around 39% for the 2017 Grade 10 throughput pass rate. This is the incorrect figure. The problem is that at least 20% of Grade 10 enrolments are actually ‘repeaters’ and not part of the original cohort. There are also the complications of those writing supplementary exams, getting part-time passes, or Independent schools writing the NSC exams. The most authoritative research done on this is by one of my colleagues at Stellenbosch University, Dr Martin Gustafsson, and according to his calculations the ‘true’ matric pass rate is about 55% and the province with the highest achievement is Gauteng. I believe that. While this is not as bad as the crude and incorrect figure of 39%, it is also not as high as the crude and incorrect figure of 75%. If one adds in youth who get some kind of non-matric qualification (i.e. through a technical or vocational college) the figure rises marginally to about 57%. So, 43% of youth in South Africa still get no qualification whatsoever. Not matric, not TVET, not university. Nothing. They enter the labour-market ill-prepared and inherit lives of chronic poverty and sustained unemployment. Is it any wonder that since 2002 more than 40% of 18-24 year olds in South Africa are ‘NEET’; Not-Employed-or-in-Education-or-Training?

So where do the wheels come off in the education system? The answer is long before matric. When children don’t learn to read for meaning in Grades 1-3 they fall further and further behind the curriculum even as they are promoted into higher grades.  Last month the 2016 Progress in International Reading and Literacy (PIRLS) results were announced and they showed that 78% of South African Grade 4 children could not read for meaning in any language (all 11 languages were tested). And if children don’t grasp the number concept, place-value or the four operations by the time they hit Grade 4 they are on a one-way ticket to failure. The 2015 Trends in International Mathematics and Science Study (TIMSS) showed that 61% of Grade 5 students could not do basic mathematics.

I know that for those writing and passing matric it is a momentous and important occasion. It’s the culmination of our schooling cycle and (unfortunately) a rite of passage into middle class life (note: necessary but not sufficient for said passage). But as a country I feel like we need to take active steps to de-emphasize the matric results and instead focus on the ailing primary school system, the ugly step-child in our national saga. We don’t even have national assessments in primary school anymore. If the wheels come off by Grade 4 then that’s where we need to be intervening. Prevention is better than cure. A stitch in time saves nine. A matric obsessed country misprioritizes its political and economic resources.

//

The DBE’s 2017 NSC Exam Report can be found here.


Explaining the matric results in 7 GIFs

*11pm 5/01/18: New addendum added. Note that the throughput pass rates or comparison rates discussed here are not the ‘real’ pass rate. It is not 37% but about 55% (the former is a crude approximation and underestimates the true pass rate by about 15-18 percentage points primarily because the denominator has repeaters) See Martin Gustafsson’s comment at the end of the post. 

worked up

Every year the matric results come out and the whole country goes ballistic. Front pages of the newspapers, every radio, every TV station. And suddenly everyone has an opinion about what’s going on. All the people. so. many. opinions. “The Free State is the best province”, “We should ban the IEB and have one exam”, “The rising pass rate shows our interventions are working”. No. No. No.

dulp2


  I was determined that this year I was going to stay out of the #MatricResults2017 morass and instead focus on our program to teach Foundation Phase teachers how to teach reading, because 78% of kids in SA can’t read. But no one seems to be reading the 97-page 2017 NSC Examination Report which has loads of information. Spend an hour or two analysing the data and it’s pretty easy to see what the trends are and what’s going on. So here are some of my take home points:

(1) The matric pass rate is one (very incomplete) measure of the education system and it’s a bad idea to focus on it in isolation.

got any other bad ideas (stark)

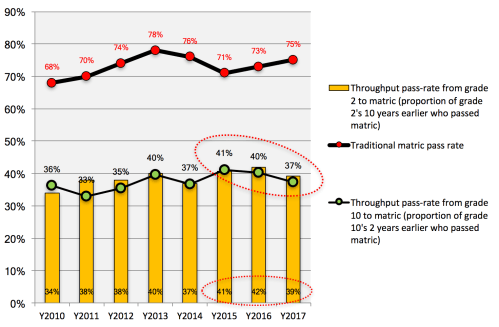
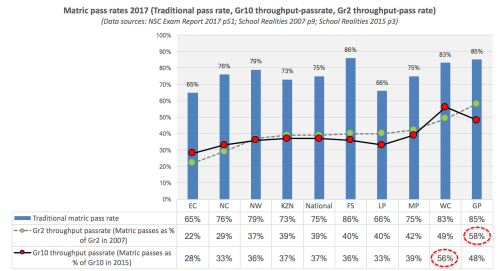
The matric pass rate is calculated as the numbers passing divided by the numbers writing. It can go up if either the numerator goes up or the denominator goes down (or both).  Nick Taylor argued this in 2011 and I’ve discussed this in 2015 and 2016. The gist of it is that it’s possible to artificially raise the matric pass rate by letting fewer weaker students write the exam (in SA this is referred to as culling or gate-keeping). So to get around this we calculate a ‘throughput pass rate’ where we divide the total number of passes by the Gr10 enrolment two years earlier or by the Grade 2 enrolment 10 years earlier. This is a VERY crude measure and does not take into account grade repetition in Gr2 and Gr10, migration, mortality etc (see Martin Gustafsson’s comment at the end of this post for a fuller discussion). So what do the trends look like in the “Traditional” matric pass rate and the “Throughput comparison rate? Basically, while the traditional pass rate has been rising the Gr10 throughput comparison rate has been declining for three years now and the Gr2 throughput comparison rate has been declining for two years. Note the ‘real’ matric pass rate is closer to 55% not 75%, but also not as low as 37%. Basically the ‘real’ pass rate is 15-18 percentage points higher than these crude estimates once you take into account repeaters and some other factors (again, see Martin’s comment at the end).

Screen Shot 2018-01-05 at 6.22.49 PM

(2) The provinces with the largest increases in matric pass rate have the largest declines in numbers writing matric

ram and cow

Basically what happens is that provinces (via principals and teachers) let fewer students reach and write matric (usually the weaker ones) which artificially lowers their denominator and raises their traditional pass rate. So the three provinces that have higher pass rates in 2017 compared to 2016 (EC, LP and KZN) also had the largest declines in the number of Gr12s writing matric between 2016 and 2017.

Screen Shot 2018-01-05 at 7.59.39 PM

(3) The Free State is NOT the best performing province in the country. Some people think that. They are wrong. 

entitled to your wrong opinion

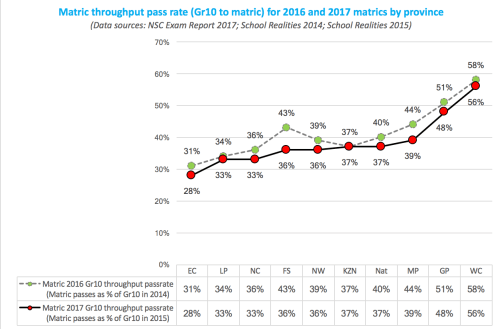
As mentioned in point (1) above, the traditional pass rate can be very misleading. This is especially the case with the Free State. While it has the highest traditional pass rate (86%), it also has the largest decline in Gr10 throughput comparison rate between 2016 and 2017 (from 43% to 36%). What does that mean? Basically that the change between 2016 and 2017 for the Free State seems to be driven by the fact that they are letting fewer of their (weaker) Gr10’s reach matric in the first place.

Screen Shot 2018-01-05 at 6.19.30 PM

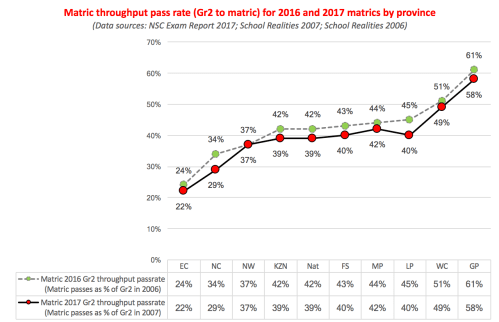
If one looks at the Grade 2 throughput comparison rate then Limpopo and the Northern Cape seem to doing quite a bit worse than they were in 2016.

Screen Shot 2018-01-05 at 6.15.27 PM

(4) So if we use the throughput pass rate who does better, the Western Cape or Gauteng?

excited

For those who follow education statistics it’s pretty clear that the WC and GP are always the top two provinces in the country. Sometimes it’s WC (PIRLS Literacy 2016, TIMSS-N 2015), sometimes it’s GP (TIMSS-Gr9 2015). So if the Free State suddenly pops up as number 1 you’ve got to look into the data a little. And what do we find? Surprise, surprise, if you use either the Gr2 throughput comparison rate or the Gr10 throughput comparison rate then the FS is fifth. And who’s first? Gauteng and the Western Cape, kind of both. You see if you take the Gr2 throughput comparison rate then it’s GP but if you take the Gr10 throughput comparison rate then it’s WC. You usually see GP ahead if you use Gr8 throughput as well. The reason is usually because the dropout that does occur in the WC usually happens before Gr10 so their Gr10 numbers are artificially low.

Screen Shot 2018-01-05 at 5.46.42 PM

But you might then ask: why not just use the Grade 2 throughput rate instead because it’s more reflective of the whole education system? Well, it’s mainly because there is likely some inter-provincial migration between Grade 2 and Grade 12 and this is most likely from poorer provinces towards WC and GP. So the WC and GP throughput comparison rates are always slightly inflated, and the Gr2 throughput rate is the most inflated.

(5) There are other things to focus on instead of the matric pass rate

I know that for those writing and passing matric it’s a momentous and important occasion. It’s the culmination of our schooling cycle and (unfortunately for some) a rite of passage into middle class life (note: necessary but not sufficient for said passage). But as a country I feel like we need to take active steps to de-emphasise the matric results and instead focus on the ailing primary school system that seems to drop off the radar after a week of new results being released. 78% of our Grade 4 kids cannot read for meaning in any language. 66% of our Grade 9’s can’t do basic maths or basic science. Perhaps because 79% of our Grade 6 maths teachers can’t pass Grade 6 maths tests? We need to get back to basics and ensure that every child learns to read for meaning and understand the concepts of number and numeracy. If the wheels come off by Grade 4 then that’s where we need to be intervening. Prevention is better than cure. A stitch in time saves nine. A matric obsessed country misprioritizes its resources.

Transmission ends.

convo over

Addendum: Important comment from the ever-wise Martin Gustafsson (I agree with all of his points here, including that the ‘real’ matric pass rate is best estimated as 55%.

“Nic, whilst I absolutely agree with the thrust of this, I don’t agree with the 37 to 39% figure. The problem with dividing Grade 12 passes with Grade 2 enrolment 10 years ago is that there are many repeaters in Grade 2. We have relatively good data for recent years pointing to around 10% of Grade 2 learners being repeaters. We don’t know with certainty what the situation was in 2007, but the figure then was probably higher. Counting NON-repeaters only in your denominator would give you a better idea of who should proceed to Grade 12. But there are other issues: mortality, migration (e.g. across provinces if you want to look at provincial ratios), enrolment in TVET colleges, supplementary examination results, part-time Matriculants, IEB. Once you take all of this into account you get around 55%, not the 37 to 39% you refer to. The DBE has published the calculations (done by me) behind the 55%. It’s at http://www.education.gov.za/Portals/0/Documents/Reports/Education%20Sector%20review%202015%20-%202016.pdf.

PS: for those who want to review the numbers and do their own calculations the Excel file and references for all the stats are available here. 

Open Letter to the next president of South Africa: We need a Marshall Plan for Reading

849x493q70nic-carel-openletter
 This article was first published online on the Daily Maverick on the 6th of December 2017. It is available here. 
Open Letter to the next South African president: We need a Marshall Plan for Reading . – Nic Spaull & David Carel
Cyril, Nkosazana – are you sitting down?

By now we trust that your advisers have informed you about the latest reading results released yesterday: 78% of our Grade 4 students can’t read. That’s eight out of every ten children in the country. Not in English, not in their home language, not in any language. Among Setswana and Sepedi home language learners the figure is over 90%.

We came last. Of the 50 countries that participated in the test, we came dead last.

But what does that mean? After four years of full-time schooling the vast majority of our kids cannot understand what they read, if they can decode the words at all. Simple questions, workbook exercises, even the most basic story book. These are meaningless to them. And if we don’t teach our kids how to read we’ve failed them before they’ve even started.

So what does this mean to you? In all likelihood one of you is going to be our next president. Sadly, we have a fatal history of presidents denying epidemics. This is not to say that your comrades haven’t made strong statements about education – they have. They have gazetted a host of well-intentioned policies, appointed task teams, procured service providers, promulgated Norms & Standards. There has been a lot of activity.

And yet, how then do we explain that there has been no improvement in reading outcomes since 2011?

We’re not saying that your predecessors weren’t trying. Naledi Pandor implemented the National Reading Strategy in 2006 and later the Foundations for Learning campaign in 2008. Minister Angie Motshekga helped stabilise the education system with a new curriculum and is currently backing the single bright, shining star among reading interventions – the Early Grade Reading Study.

But we’re fighting forest fires with buckets. Moving the needle in education will require a radical rethinking of both what’s needed and what’s possible.

Dr Dlamini Zuma and Mr Ramaphosa, respectfully, what we do not need is another steering committee, another convening of experts, another 12-point plan. We do not need another lengthy speech or moving statement telling us how committed you are to solving the reading crisis, and to “our children’s futures”.

What South Africa needs is to decide what Japan decided in 1872, that “there must be no community with an illiterate family, nor a family with an illiterate person”. This became Japan’s ‘Fundamental Code of Education’, the core of their development strategy, and they actually did it. Within decades they had successfully eradicated illiteracy.

What South Africa needs is to decide what Cuba decided in 1961 when it implemented the Cuban Literacy Campaign. They galvanised a million Cubans to systemically eliminate illiteracy across the country. It worked.

What South Africa needs is a Marshall Plan for Reading. We need you to use yourpresidency to mobilise our country behind one goal:

That all children can read for meaning by the end of Grade 3.

When eight out of 10 of our children can’t read for meaning, overcoming this challenge might seem impossible. But insurmountable problems are not new to our country. In 2000, at the peak of the AIDS crisis, who would have thought that four million South Africans would now be on antiretrovirals? Or that the ANC government would ultimately mobilise the country to build the largest AIDS treatment programme in the world?

Will you do the same for reading?

The unfolding reading crisis: The new PIRLS 2016 results…

pirls 2

Today the PIRLS 2016 results were released by the Minister of Basic Education Ms Angie Motshekga. To say that they are anything but devastating would be a lie.  8 in 10 children cannot read for meaning. This new report provides the latest evidence helping us to understand the unfolding reading crisis. I received an embargoed copy of the final report from the IEA last week late in the evening and battled to fall asleep after reading it. 78% of South African Grade 4 children cannot read for meaning in any language. I think this was the most striking thing for me -that we had previously underestimated the number of South African children that couldn’t read for meaning. Previously we thought the number was 58% (using prePIRLS 2011 Intermediate Benchmark) but it turns out that it is 78% (PIRLS Literacy Low International Benchmark). Basically we were using the wrong benchmark in the past. This is the first time that the easier PIRLS test (which used to be called prePIRLS and is now called PIRLS Literacy) was put on the PIRLS scale.

Apart from the horrifically low levels of reading achievement, South Africa also has the highest incidence of bullying among all 50 countries that participated in the study. 42% of Gr4 students indicated that they were bullied weekly (p226 in the report). Compared to 15% in the US and England.

I’ve summarized what I think are the main findings from the PIRLS 2016 report below. You can download the full report HERE and it is also available on the PIRLS website. The SA Summary reports are now also available (SA PIRLS Literacy, ePIRLS, SA PIRLS) The DBE’s official response is here.

Main findings:
  1. 8 of 10 SA children cannot read: 78% of SA Grade 4 students cannot read for meaning. That is to say that they could not reach the Low International PIRLS Benchmark in reading. They could not locate and retrieve explicitly stated information or make straightforward inferences about events and reasons for actions (PIRLS report page 55)
  2. SA scores last in reading of 50 countries: South African Grade 4 children have scored the lowest mark in the latest 2016 round of the Progress in International Reading and Literacy Study released today. The study included mostly High Income Countries but there were a number of middle-income countries such as Iran, Chile, Morocco, and Oman.
  3. SA lags far behind other countries: While 78% of SA Grade 4 kids cannot read, in America this is only 4% and in England just 3% cannot read. However the study also included middle-income countries. In Iran only 35% of Grade 4 students could not read for meaning and in Chile it was only 13% (PIRLS report page 55).
  4. Reading crisis deeper than previously thought: When South Africa participated in prePIRLS 2011 (an easier version of PIRLS) we thought that 58% of SA Gr4 children could not read for meaning. However this was on a separate test and not on the PIRLS scale score (i.e. not the same metric). 2016 was the first time that prePIRLS (now called PIRLS Literacy) was put on the same scale score as PIRLS. The true figure for children that cannot read for meaning is 78% – revealed today. Note this does NOT mean that reading outcomes have gotten worse between 2011 and 2015. In 2011 77% could not read for meaning and in 2016 78% cannot read for meaning (this difference is not statistically significant, i.e. the difference is negligible).
  5. Some evidence of improvement in reading 2006 to 2011 but stagnant since 2011: The only good news coming out of PIRLS 2016 is that there may have been significant improvements in reading between 2006 and 2011. Because the scale scores are now comparable we can compare the performance of Gr4’s in 2006 and Gr4’s in 2011 and 2016. This comparison seems to suggest quite a significant increase in reading scores between 2006 and 2011. Notably the Gr4 students in 2011 achieved higher scores than Gr5 students in 2006. Further analysis is needed but there does seem to be legitimate evidence of improvement between 2006 and 2011. Unfortunately no evidence of improvement between 2011 and 2016.
  6. SA reading scores stagnant since 2011: There has been no improvement in reading scores over the last five years (i.e. 2011 to 2016). Note that although the average scored declined from 323 to 320 this can NOT be interpreted as a decline. The standard errors overlap here so there is no certainty that there was any decline whatsoever (this is like taking your sitting heart rate 10 times and getting very tiny differences each time – they are not statistically significantly different) (PIRLS report page 29)
  7. SA gender gap in reading 2nd highest in the world: Girls score much higher than boys in reading across the board. In Grade 4 girls are a full year of learning ahead of boys. This gender gap is the second largest among all 50 countries that participated. Only Saudi Arabia’s is higher. (PIRLS report page 36). The gap between boys and girls is also growing over time. The gap between boys and girls was larger in 2016 than in 2011 (PIRLS report page 43).
  8. SA boys scores seem to have declined between 2011 and 2016: The average Grade 4 girl in SA scored 341 in 2011 and 347 in 2016 (unlikely to be statistically significant). The average Grade 4 boy in SA scored 307 points in 2011 and 295 points in 2016 (this is likely to be statistically significant but we cannot tell until the SA report is released  (PIRLS report page 43).
  9. Declining number of SA students reaching high levels of reading achievement: In 2011 3% of SA Gr4 students reached the High International Benchmark. In 2016 only 2% reached this same benchmark  (PIRLS report page 58).

Results within South Africa:

  1. Massive provincial differences in percentage of Gr4s who can read. 91% of Grade 4 children in Limpopo cannot read for meaning with equally high percentages in the Eastern Cape (85%), Mpumalanga (83%), Gauteng (69%), Western Cape (55%). Pg 5 of this report.
  2. Very large differences by test language. 93% of Grade 4 students tested in Sepedi could not read for meaning with similarly large percentages amount Setswana (90%), Tshivenda (89%), isiXhosa (88%), Xitsonga (88%), isiZulu (87%) and isiNdebele (87%) Grade 4 learners. Pg 5 of this report.
Background: PIRLS is implemented by the Centre for Evaluation and Assessment (CEA) at Pretoria University headed by Prof Sarah Howie. CEA press release here. In 2016 it tested 12,810 Gr4 students from 293 schools across the country (PIRLS report page 309). The sample is nationally representative and can be generalized to the entire country. Students were tested in whatever language was used in that school in Grades 1-3, i.e. all 11 official languages were tested and children were generally tested in the language with which they were most familiar. The results were released by Minister Motshekga today (5 Dec) in Pretoria.
The full report is available here and also on the PIRLS website from 11am today: – http://pirls2016.org/pirls/summary/
I have provided some boilerplate comment for journalists HERE. If you would like additional comment you can email me. (Comment ONLY via email. Please do not phone).

It rained tonight and I thought about crying

grey

It rained tonight and I thought about crying.

Last week I read about a drought in Yemen and a dying camel.
The severity of the drought was unclear
Until they saw the dying camels under a tree.
Apparently the dormant grass was about to open, as it always had
But the rains never came and the seeds never opened.

We don’t get camels here.
But I can feel them dying anyway.


Do girls do better than boys at school & university? (my Sunday Times article)

The article below was published in the Sunday Times. The article is based on a Working Paper that my co-author (Hendrik van Broekhuizen) and I published this week. The full PDF of that article is available here.  I’ve extended that article slightly by including a few more graphs from the paper. 

darling

Do girls do better than boys at school and at university? That’s a question that occupies the minds of many parents and teachers. The short answer is yes, they do. Many people think girls are disadvantaged in education in South Africa, and while that might be somewhat true among the very poorest girls, on average girls actually do better than boys. They learn to read much quicker than boys do (which is true of pretty much all middle- and high-income countries). In South Africa girls also perform better in mathematics. Looking at large nationally-representative surveys from 2011 and 2015 we can see that by Grade 4 girls are a full year of learning ahead of their male peers in reading, despite being in the same grade. By Grade 5 girls are about 40% of a year of a learning ahead of boys in mathematics. 

But do these advantages continue into high school and university? That’s a question that my co-author (Dr Hendrik van Broekhuizen) and I tried to address in a paper we released this week. To do this we followed the entire matric class of 2008 into and through all public universities in the country. Using data from the Higher Education Management Information System (HEMIS) we followed all the students from the matric 2008 class that went on to university and followed them for a six-year period (2009-2013). There were 112,402 students in our dataset! Because the Department of Basic Education (DBE) and the Department of Higher Education and Training (DHET) collects detailed information on the results of all students we were able to see whether or not there was also a female advantage in matric and at university. 

The results are truly remarkable. We find strong evidence of a large female advantage that continues to grow at each hurdle of the higher education process. To be specific, relative to their male counterparts we find that there were 27% more females who qualified for university, 34% more who enroll in university, 56% more who complete any undergraduate qualification and 66% more who attain a bachelor’s degree. This despite there being roughly equal numbers of boys and girls at the start of school. 

Screen Shot 2017-11-08 at 11.30.55 AM

Another striking finding is the very large drop-off from Matric to degree attainment. The diagram below shows that for every 100 females in matric there are only 85 males in matric. And for every 100 females in matric only 8 females will complete an undergraduate degree within six years, with even lower numbers for males (only 5 males).

Screen Shot 2017-11-08 at 11.31.41 AM

Because of the richness of the data we can also see whether this advantage remains after controlling for various background factors like race, age, socioeconomic status etc. We can also control for school-level achievement. We find that this large female advantage remains after controlling for school-level performance, and exists for all subgroups of race, age, socioeconomic status, and province of origin.

But perhaps it is because females choose ‘easier’ fields of study than males – and that explains the ‘advantage’? The short answer is no. We examine 19 fields of study and find that females are significantly more likely to get a degree in 12 of the 19 fields (often by substantial margins), and are significantly less likely to get a degree in five of the 19 fields. However, this is almost entirely because they do not access these traditionally ‘male’ programs rather than due to lower completion rates once they are in. Only in Engineering and Computer Science do girls do worse than boys once they are accepted to the program. But while there are these  two fields where girls do worse, there are nine where boys do worse (including Health Sciences, Business Studies, Natural Sciences, Psychology etc.). One of the most interesting findings of the paper was that females are always and everywhere 20% less likely to dropout than their male counterparts (including in traditionally ‘male’ fields like Engineering and Computer Science), even after controlling for field of study, race, age, socioeconomic status, and location.

It is important to recognize that South Africa is not an outlier in this regard. The emergence of a female advantage in education (both at school and at university) is a global trend among middle and high-income countries. In the 33 countries that make up the Organization for Economic Cooperation and Development (OECD) – mainly a club of rich countries – 58% of bachelor’s degrees were awarded to women (in SA it is 61%). The question we usually get asked is why is this the case? We don’t really know yet, but the best international evidence points to the fact that girls have more and better “non-cognitive skills.” These are things such as self-control, self-motivation, dependability, sociability, perceptions of self-worth, locus of control, time-preference and delayed gratification. Other scholars argue that schooling is set up in such a way that it favors girls over boys, and favours the traits that society expects from girls or, alternatively those that girls just naturally have more of.

Another conundrum is how it’s possible for girls to do better at school and better at university but then worse in the labour-market? Women in South Africa get paid about 15-17% less than men do for the exact same work (again this is true around the world). The answers here are also complex and link to some easily observable features of society – like who is expected to care for children – and some less observable features like patriarchal norms and gender discrimination.

What our research shows is that girls in South Africa have a clear advantage at school and at university. Any conversation about ‘gender equality’ needs to take into account the disadvantage faced by boys at school and university, but also why this reverses when one moves into the labor-market.


DBE Research Protocols

DBE protocls

If you’ve ever wanted to conduct research on education in South Africa you may have been a little confused about the processes to follow when requesting data, getting approval to visit schools etc. The Department of Basic Education (DBE) has recently released research protocols for requesting data, getting research projects approved etc. There are two documents that you need to complete and email to them:

I think this is a great step towards standardising and formalising the processes for interacting with the DBE around research. I personally think that all of this could be done on a Google Form or a Surveymonkey questionnaire, eliminating all the paperwork, but baby steps 🙂