Links I liked and new research

backwards
Links I liked:
Research
As part of project we are doing for the EU/SA Presidency, two RESEP-affiliated researchers – Martin Gustafsson and Stephen Taylor – have published important papers extending our understanding of education in South Africa. The first looks at the spatial distribution of teachers in South Africa and pays special attention to post-provisioning, the recruitment and employment of teachers and how policy can be improved in these areas. The second looks at the impact of treating schools to a new provincial administration, exploiting a change in provincial boundaries that led to some schools ‘moving’ into different provinces.
“Teacher supply and the quality of schooling in South Africa. Patterns over space and time” (Gustafsson 2016)
  • The paper addresses policy questions in South Africa’s education system using a newly merged 1999 to 2013 panel of data that includes school enrolments by grade, staff details from the payroll system, examination and test results and the geo-coordinates of schools. This combination of data, which is seldom used, at least in developing countries, permits new and important knowledge about a schooling system to be uncovered. Whilst policy conclusions are South Africa-specific, the methods would be largely transferable to other contexts. It is shown that school data can complement official population data with respect to the monitoring of within-country migration and in determining the rate of urbanisation. An approach for calculating the viability of small schools in a context of migration out of rural areas is presented, using assumptions around maximum distance to be travelled by pupils and the degree to which multi-grade teaching by teachers should be permitted. Cost reductions associated with a reduced presence of small schools, and greater economies of scale associated with larger schools are found to be smaller than what is generally assumed. Correlations between pupil under-performance and the under-staffing of schools are found to be higher at the primary than the secondary level, apparently confirming the greater importance of personal interaction with a teacher for younger pupils. Between-school movements of pupils other than those associated with urbanisation are found to be high, and highly variable across districts. This further complicates the allocation of publicly paid teachers. An approach to gauging whether teachers avoid moving to schools on the other side of provincial boundaries is presented. It is confirmed that movement across provinces, which are the employers of teachers, is restricted, creating further obstacles to efficient teacher allocation. It is confirmed that teachers tend to move to better performing schools, but that the performance signals that influence this movement are often inaccurate and a few years old.”

    “Treating schools to a new administration: Evidence from South Africa of the impact of better practices in the system-level administration of schools” (Gustafsson & Taylor, 2016)

  • “School examination results are far from ideal measures of progress in schooling systems, yet if analysed with sufficient care these data, which are common in education systems, can serve this purpose. The paper partly deals with how various student selection and year-on-year comparability issues in examinations data can be dealt with. This is demonstrated using South African student-level results, aggregated to the school level, for Grade 12 mathematics in the years 2005 to 2013. This was a period during which provincial boundaries changed, creating a quasi-experiment which is amenable to impact evaluation techniques. Value-added school production functions and fixed effects models are used to establish that movement into a better performing province was associated with large student performance improvements, equal in magnitude to around a year’s worth of progress in a fast improving country. Improvements were not always immediate, however, and the data seem to confirm that substantial gains are only achieved after several years, after students have been exposed to many grades of better teaching. The institutional factors which might explain the improvements are discussed. Spending per student was clearly not a significant explanatory variable. What did seem to matter was more efficient use of non-personnel funds by the authorities, with a special focus on educational materials, the brokering of pacts between stakeholders, including teacher unions, schools and communities, and better monitoring and support by the district office. Moreover, the education department in one province in question, Gauteng, has for many years pursued an approach which is unusual in the South African context, of hiring a substantial number of senior managers within the bureaucracy on fixed term contracts, as opposed to on a permanent basis, the aim being to improve accountability and flexibility at the senior management level.”
  • I have just discovered John Jerrim’s website. He seems like an extremely prolific scholar and has done loads of research on PISA. As important, he seems to be working closely with education policy makers in the UK.
  • “Duration of unemployment in youth transitions from schooling to work in Cape Town” (Mlatsheni & Leibbrandt 2015)
  • “Starting together, growing apart: Gender gaps in learning from preschool to adulthood in four developing countries” (Singh & Krutikova, 2015)
  • Durevall, Lindskog & George (2016) – Three approaches all suggest no impact of secondary school attendance on HIV incidence in South Africa #CSAE2016
  • Nice round up of economic research on Africa from the first day of CSAE s well as Day Two and Three.

The Biggest Solvable Problem in SA: Reading

book

Whenever I travel overseas I am asked the question “What is the biggest problem in South Africa?” And I typically respond, “The biggest problem or the biggest solvable problem?” In the 2000’s the biggest problem was HIV/AIDS. After hundreds of thousands of unnecessary deaths – the equivalent of a small genocide – the government ceded to the courts and offered life-saving ARVs to those infected with HIV and saved their lives. HIV was, and is, a solvable problem. Unfortunately the three biggest problems in South Africa today – too few jobs, too little growth, and too much inequality – are not easily solvable. And because we don’t exactly know how to ‘create’ jobs or growth, we don’t really know how to decease inequality much further.

Of course everyone has theories about how we can increase jobs, but the evidence is pretty thin. Depending on your political fancy and chosen economic guru there are various concoctions ranging from youth wage subsidies, eliminating red-tape, decreasing taxes, increasing taxes, digging holes, filling holes…you get the picture. Ask the top labour-economists in the country how to create jobs and you won’t get a straight answer (This is partly a provocation to said labour economists to tell us if there is in fact any coalesced consensus). You won’t even get consensus on the next three steps towards finding the answer; which is, incidentally, not a uniquely South African problem. So what to do? I think the best response is to keep cracking away at the problem; experimenting, evaluating, moving forward. But in the mean time we should also be allocating time, energy and resources to solvable problems; those we haven’t currently cracked but have a pretty good idea of how to do so. Epidemic HIV; distribute free ARVs. Crippling poverty; introduce the child support grant. Widespread malnutrition; provide free school meals to most children. The government should be heavily praised for all of these important initiatives.

But the problem I want to focus on here is the fact that most kids do not learn to read in lower-primary school. South Africa is unique among upper middle-income countries in that less than half of its primary school children learn to read for meaning in any language in lower primary school.

Irrespective of how tenuous or strong you believe the relationship is between education and economic growth, teaching all children to read well is a unanimously agreed upon goal in the 21st century. It is necessary for dignified living in a modern world, it is necessary for non-menial jobs, it is necessary for a functioning democracy. It also usually helps with ignorance, bigotry and a lack of empathy. In a modern context illiteracy is a disease that is eradicable, unlike unemployment or inequality. Like polio, illiteracy practically does not exist in most wealthy or even middle-income countries (defined here as basic reading). Illiteracy rates among those who have completed grade 4 are in the low single digits in wealthy countries like England (5%), the United States (2%) and Finland (1%) and less than 50% in most middle income countries such as Colombia (28%), Indonesia (34%), and Iran (24%). It’s difficult to get directly comparable estimates for the whole country but the best estimate from the recent pre-Progress in International Reading Literacy Study (PIRLS) surveys is about 58%. That is to say 58% of Grade 4/5 students cannot read for meaning in any language. And why is Grade 4 a critical period? The South African curriculum (like most curricula) prescribes that in the first three years of schooling children must ‘learn to read’, then from grade 4 onwards they must ‘read to learn’. The fact that almost 60% cannot learn through reading means that these children cannot really engage with the curriculum beyond grade 4. It really isn’t much more complicated than that

Reading for meaning and pleasure is, in my view, both the foundation and the pinnacle of the academic project in primary school. Receiving, interpreting, understanding, remembering, analyzing, evaluating and creating information, symbols, art, knowledge and stories encompasses pretty much all of schooling. Yet most kids in South Africa never get a firm hold on this first rung of the academic ladder. They are perpetually stumbling forward into new grades even as they fall further and further behind the curriculum.

Based on my reading of the academic literature – which may differ from others – there are three main reasons why the majority of kids don’t learn to read in lower primary school.

  1. Foundation Phase teachers (grades 1-3) do not know how to teach reading in a systematic way and pre- and in-service courses teaching this topic are unsystematic, inadequate or nonexistent.
  2. Text-poor environments; the School Monitoring Survey showed that half of schools in quintiles 1-3 (i.e. poorest 60%) had no school or classroom library or even a book corner. (Importantly, research has shown that even when there are libraries they are frequently mismanaged, have inappropriate materials and they are not integrated into reading lessons),
  3. Wasted learning time; A number of South African studies have aimed to measure opportunity-to-learn and have frequently found that less than half of the official curriculum is being covered in the year and fewer than half of the officially scheduled lessons are actually taught. In one study in the North West Grade 6 teachers only taught 40% of scheduled lessons for the year (compared to 60% among schools across the border in Botswana). It is not clear what was happening on the days where there was evidence of teaching or learning.

For me the solution is simple: we need to address these three problems: (1) decide how to teach existing and prospective teachers how to teach reading (as is done all over the world in contexts as linguistically and socioeconomically complex as our own), (2) ensure that all primary schools have a bare minimum number of books and that these are managed effectively, (3) monitor how often teachers are actually teaching and introduce meaningful training first and real consequences second for those teachers who are currently not teaching.

We may not have consensus on how to create jobs or increase growth, but there is consensus on how to teach children to read: with knowledgable teachers who have books and provide their students with enough opportunity to learn. If you want to improve matric, you need to start with reading. It’s not rocket science.

*This article first appeared in The Star on Tuesday the 29th of March 

**Image from here

Links, presentations and new research

21

Links I liked:
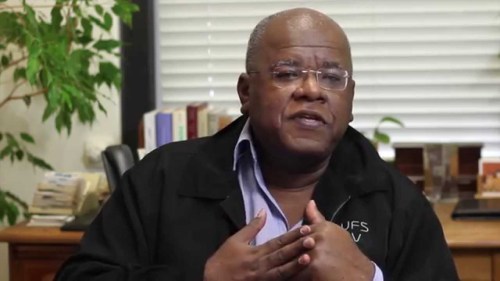
  • The story of Judge Lex Mpati who went from being a petrol attendant after matric to the President of the Supreme Court of Appeal and Chancellor of Rhodes University where he studied (bartending on the side to pay for his studies). Such an inspiration that we have people like this who have gone from the very bottom to the very top.
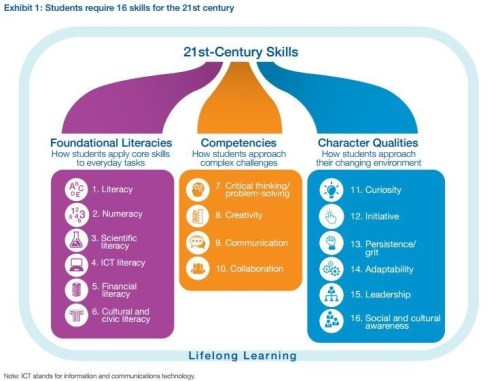
  • The World Economic Forum (WEF) has a new report out titled “New Vision for Education: Fostering Social and Emotional Learning Through Technology.” (picture above taken from here). Interesting. Would like to see more research on this. (Again I reiterate that there isn’t anyone looking at grit – ala Duckworth – in South Africa).
  • The “What Works Clearinghouse” funded by the US Department of Education is an exceptional piece of scientific wisdom. Reviewing the evidence and coming up with recommendations on “what works” – what a brilliant (and obvious/logical) idea! Anyone in SA want to take this on? 🙂  (Thanks John Aitchison for reminding me of this).
  • NATURE has published a “Twenty tips for interpreting scientific claims” – Great!
  • Great Quartz article taking a behind-the-scenes look at the Hillary Campaign and how Google’s top dog (Eric Schmidt) is funding a startup that provides analytics support.
  • “Labyrinth of Lies” (2015) – great German film about prosecuting those responsible for the atrocities at Auschwitz, and this at a time soon after WW2 when key Nazi officials remained in high office in Germany. I watched this on the plane to Vancouver and was particularly moved by the scene where Jewish survivors explain what happened to them at Auschwitz (at the time this wasn’t discussed in Germany). The dialogue goes silent and all you see is the faces of the secretary transcribing the accounts in disbelief.
  • Knight Lab Timeline – Great resource to make Timelines for presentations. Thanks Shelanna Sturgess!

Some presentations I’ve given in the last month:

Some new research…

  • “Schooling inequality, higher education and the labour market: evidence from a graduate tracer study in the Eastern Cape, South Africa” 2015 article by Michael Rogan and John Reynolds comparing graduates from Fort Hare and Rhodes ABSTRACT: An emerging body of research has shown that there are large inequalities in access to higher education in South Africa. There remains a gap, however, in identifying how factors such as schooling background, academic performance, race and gender are linked with key higher education outcomes. In particular, the significance of these factors for first-choice degree attainment at university and in the subsequent transition to the labour market are of interest. This paper addresses these questions by presenting a descriptive and multivariate analysis of data collected through a tracer study which interviewed graduates from two Eastern Cape universities. The results suggest that schooling history, race and gender are associated with career choice and unemployment. These findings have important implications both for equity and for the efficiency of higher education institutions. The article concludes with a discussion of potential policy responses and the implications for equity in higher education.
  • “Learning from Failure: why large government policy initiatives have gone so badly wrong in the past and how the chances of success in the future can be improved” by Sheringold (2015)
  • System-wide improvement of early-grade mathematics: New evidence from the Gauteng Primary Language and Mathematics StrategyB Fleisch, V Schöer, G Roberts, A Thornton – International Journal of Educational Development 2016 ABSTRACT This article reports on a two-year evaluation of the Gauteng Primary Language and Mathematics Strategy (GPLMS), an innovative system-wide reform intervention designed to improve learning outcomes in Gauteng Province, South Africa. Using data from universal testing of all learners in 2008 on a provincial systemic evaluation, as well as data from the 2011, 2012 and 2013 Annual National Assessment tests, this article investigates whether or not the GPLMS improves the numeracy skills of learners in early-grade mathematics in underperforming schools. Using as identification strategy, the natural experiment that resulted from a miscalculation of the provincial systemic evaluation test scores in 2008, which had been used to assign schools to the GPLMS intervention, the study shows that the GPLMS intervention is positively associated with improvements in early-grade mathematics performance of schools in the neighbourhood around the assignment threshold. The findings of the study contribute to the growing body of knowledge that shows the effectiveness of combining lesson plans, learner resources, and quality teacher capacity building.
  • Treating schools to a new administration: Evidence from South Africa of the impact of better practices in the system-level administration of schools M Gustafsson, S Taylor – 2016 ABSTRACT: School examination results are far from ideal measures of progress in schooling systems, yet if analysed with sufficient care these data, which are common in education systems, can serve this purpose. The paper partly deals with how various student selection and year-on-year comparability issues in examinations data can be dealt with. This is demonstrated using South African student-level results, aggregated to the school level, for Grade 12 mathematics in the years 2005 to 2013. This was a period during which provincial boundaries changed, creating a quasi-experiment which is amenable to impact evaluation techniques. Value-added school production functions and fixed effects models are used to establish that movement into a better performing province was associated with large student performance improvements, equal in magnitude to around a year’s worth of progress in a fast improving country. Improvements were not always immediate, however, and the data seem to confirm that substantial gains are only achieved after several years, after students have been exposed to many grades of better teaching. The institutional factors which might explain the improvements are discussed. Spending per student was clearly not a significant explanatory variable. What did seem to matter was more efficient use of non-personnel funds by the authorities, with a special focus on educational materials, the brokering of pacts between stakeholders, including teacher unions, schools and communities, and better monitoring and support by the district office. Moreover, the education department in one province in question, Gauteng, has for many years pursued an approach which is unusual in the South African context, of hiring a substantial number of senior managers within the bureaucracy on fixed term contracts, as opposed to on a permanent basis, the aim being to improve accountability and flexibility at the senior management level.
  • Also, this isn’t new (it’s 2012) but I’ll be buying/ordering this volume ASAP: “Handbook of International Large-Scale Assessment: Background, Technical Issues, and Methods of Data Analysis“

From petrol-attendant to President of the Supreme Court of Appeals SA: Judge Lex Mpati

judge2

This is the story of Judge Lex Mpati who went from being a petrol attendant after matric to the President of the Supreme Court of Appeal and Chancellor of Rhodes University where he studied (bartending on the side to pay for his studies). Such an inspiration that we have people like this who have gone from the very bottom to the very top.

“When you drive around Grahamstown in the Eastern Cape with Judge Lex Mpati you take in the tour of his life, starting at the old garage in Beaufort Street.Here, as a young man he worked as a petrol attendant and felt proud to be earning his own money. It was his first job after completing matric at Mary Waters High School in Grahamstown. His family had sent him here from Fort Beaufort where he grew up on a farm and attended the Catholic school in town, which stopped at Grade 8.Our tour continues, and we drive on to the motel where he once worked as a bartender. He recalls how kind the owner and manager were to him when he told them he wanted to study law. They encouraged him and allowed him to fit his bartending hours around his classes and studies.

Next is the furniture shop where he once worked as a salesman. This is the only job he has ever hated because he could not bear to see people being hoodwinked into hire purchase contracts they could not afford.Judge Mpati’s first home in Grahamstown was the two-roomed home in Victoria Road in the township of Fingo Village that he shared with his mother’s brother while schooling and later with his wife Mireille.From here we head across town to Rhodes University where he achieved his dream of studying law; a dream that started when he was arrested for illegally operating as a taxi at the railway station in 1968.

“I had just completed the night shift at the garage when I decided to make some extra money as I had the use of my grandfather’s car at the time,” he explains. “It was December and a lot of people were arriving by train, so I headed for the station and offered my taxi service. I was about to drive away with my clients when the police stopped me and charged me with pirating as a taxi.”He was given the option to pay a fine or go to court and he chose the latter. “I decided to defend myself and came up with a story about how I had gone to the station to pick up family members who didn’t arrive,” he recalls. “I explained that as I was leaving some people at the station had asked for a lift. When I told them I didn’t have enough petrol to take them home, they gave me 30c for petrol, which is how I came to be in possession of the money, which was quite a bit at the time. It cost 34c per gallon for regular and 38c for super. I felt I had done fairly well when I was found Not Guilty!” he smiles.It was not his first time in the magistrate’s court. Out of interest he had sat in on several cases when he had time off from the garage.

“I attended all sorts of cases – from early political trials of student activists from Healdtown and Lovedale to criminal cases. I would sit in the back listening to the charges being put to people and agonise over how they tried to defend themselves. Mostly they were black people and not being educated they were not able to conduct a good defence.”
He would get upset when people were sent to jail simply because they couldn’t ask the state witnesses the appropriate questions. “It was clear to me that the justice system was simply not working well and too many people were going to jail. That is what pushed me to decide to do law, I felt they needed someone who could defend them.”


Judge Mpati started his law degree at Rhodes in 1979 at the age of 30, paying for his first year with his earnings as a bartender. In his second and third year he received a scholarship, which covered his studies with some change to buy books. By this time he had met, courted and married Mireille who trained as a teacher and later as a nurse.In his third year he started working as a clerk for a legal firm in Grahamstown and stayed on after he graduated.“I mainly did criminal cases, which is precisely what I wanted to do. I was fulfilling my goal of helping people and I felt very good about it,” says Judge Mpati who was admitted as an attorney in 1985. “What made me especially proud was when people from my community would come up to me and tell me I had inspired them; that they had watched me go through university and qualify and it gave them the confidence to further their studies.”In February 1989 he joined the bar. Now an advocate he worked on his own from his chambers in Grahamstown until 1993 when he took up the post of in-house counsel at the Legal Resources Centre and immersed himself in human rights work in the Eastern Cape.“It has always been important to me to contribute to the growth of a society in which we can respect each other, not as a white person or black person, but as human beings who want to contribute to peace and upliftment in our country.”

In 1997 after he had served as an acting judge for a period of eight months, he became a judge. Two years later he was invited to the Supreme Court of Appeal in Bloemfontein where he was permanently appointed in 2000. Eight years later he was appointed President.While he is based in Bloemfontein, Grahamstown is still his home and he and Mireille return whenever they can. They now live in Knowling Street, which is part of the tour, and this is where they raised their four children. Lyle (40) their eldest is a Mechanical Engineer, Dawn (38) is an attorney, Ludi (26) is in IT and Demi-Lee (21) is studying law through Unisa.Judge Mpati is now in his fifth year as the President of the Supreme Court of Appeal, which he describes it as “an extremely challenging job”.“The judges at the Supreme Court of Appeal need to be the best in the country, and we need to maintain that standard but at the same time we need to see the judiciary transform, particularly when it comes to race and gender,” he explains. “As part of the process of transforming the judiciary you appoint a combination of the best judges and judges with the best potential to reach the level at which you wish to maintain the court.”

In February this year Judge Mpati was appointed Chancellor of Rhodes University.“It feels as if my life has come full circle,” he says. “When I arrived in Grahamstown as a young boy I could never have imagined that one day I would be the Chancellor of the University I attended and of which I am so proud.”Commenting on his appointment, the Vice-Chancellor of Rhodes University Dr Saleem Badat said: “Judge Mpati personifies the values we embrace at Rhodes of rising above self, of modesty, commitment, excellence and ethical behaviour. His is an inspiring story and we are honoured to have him as our Chancellor.”

From here (via Janet Love).

Vancouver Public Library. The Force is strong with this one.

vpl-outside

I recently had the privilege of visiting the incredible Vancouver Public Library for a few hours on Sunday morning and was totally blown away (thanks Kelsey for recommending it!). I was at the CIES education conference in town during the week and in hindsight I wish I had just spent it talking to the librarians instead, documenting what, how and why they do what they do. As it turns out, while I was wandering the floors of the library I was actually in the process of missing my flight home! In the end I had to book a series of one-way flights home which turned into a long (52-hours!) and expensive journey back to Cape Town. Nevertheless, I probably wouldn’t have had time to visit VPL had I not missed my flight. C’est la vie.

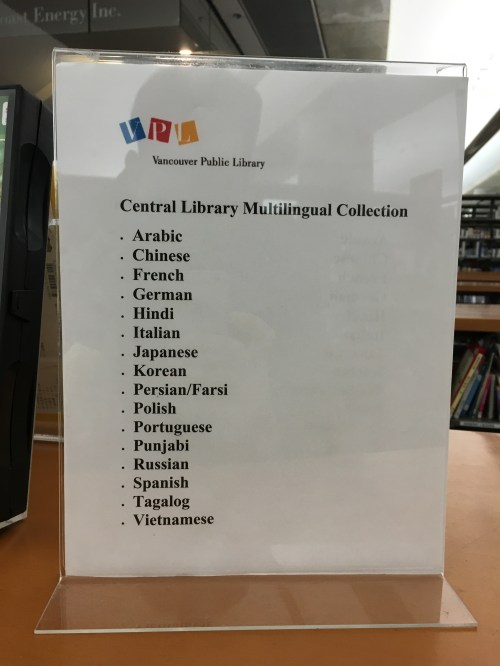
If I’m honest I found parts of my VPL experience a little emotionally overwhelming. I don’t think this was because of the library itself but rather because of the Canadian values and philosophy that it embodied. Walking around Vancouver and seeing various public announcements all in multiple languages was mirrored at VPL where half of an entire floor was dedicated to books published in other languages.

IMG_8565

IMG_8559

There were also some children’s books in other languages but not nearly as many (or as diverse) as in the adult books section.

IMG_8560

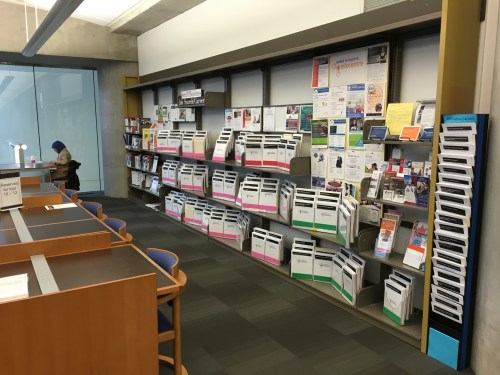
The part that I found quite emotional was the “VPL Skilled Immigration Information Centre” which helps newly resident skilled immigrants find work. They have created 8-10 page booklets on each career with information on things like starting salaries, industry websites, and who the large employers are in that field. In the handbook on ECD practitioners there was even a section on “hidden jobs” and how to access these (jobs that aren’t advertised anywhere!).

IMG_8579

Like many people I have been following the US presidential nominations and the contrast between the Canadian and American responses to the Syrian refugee crisis are just worlds apart. America has agreed to welcome 10,000 Syrian refugees while Canada is taking in 25,000 Syrian refugees (Note: American population: 319 million,  Canadian population: 35 million). But for me it actually wasn’t about the numbers it was about the tone and the attitude towards refugees (and diversity in general). This was one of the posters in the library:

IMG_8585

The day before I was taking the bus to the Capilano Suspension Bridge Park and saw a photo of a Syrian girl on the side of the bus with an explanation that the government of Canada would match dollar-for-dollar any donation Canadians made to charities supporting the Syrian refugees (Red Cross, UNICEF, Save the Children etc.), and that this was up to $100 million. Once at Capilano I was also encouraged by the way that the official guides spoke of the traditions and knowledge of the First Nations people. As we walked around the park the guides told us why the First Nation’s people named certain trees the way they did and about their cultural traditions and practices. At no point did I feel that they were being exoticised or belittled. Their insights and names were woven into the park’s signs and boards and included in the children’s treasure/science hunt maps.

Back to the library, thisScreen Shot 2016-03-19 at 3.28.49 PM disposition towards diversity was strongly emphasised. The library not only has an Author-in-Residence, but also an Aboriginal-Storyteller-in-Residence aiming to foreground and highlight the oral tradition of the aboriginal people.


Throughout the library there were references to Syria and the refugee crisis with materials, both for Canadians and Syrians. In the children’s section there was even a list of picture books about refugees from other countries to help children understand what was going on.

Screen Shot 2016-03-19 at 4.22.18 PM

I was so impressed by the work that the children’s librarians had done. There were curated reading lists for different age groups and different topics with brief explanations of each book next to a picture of the front page. The front covers of each booklet are included below:

IMG_8690

Forging the path of what a library looks like in the 21st century

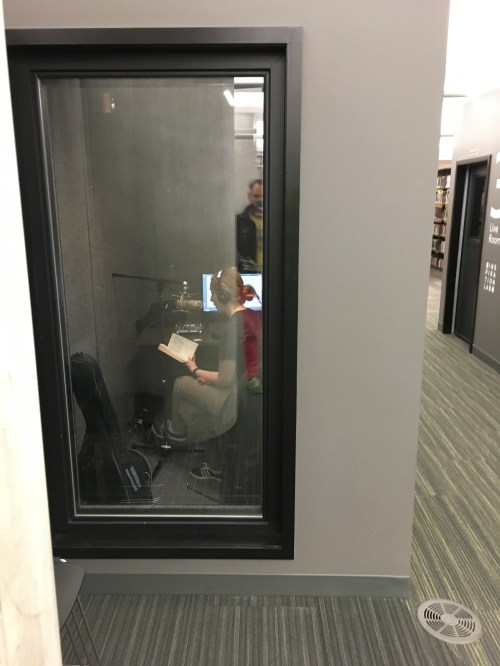
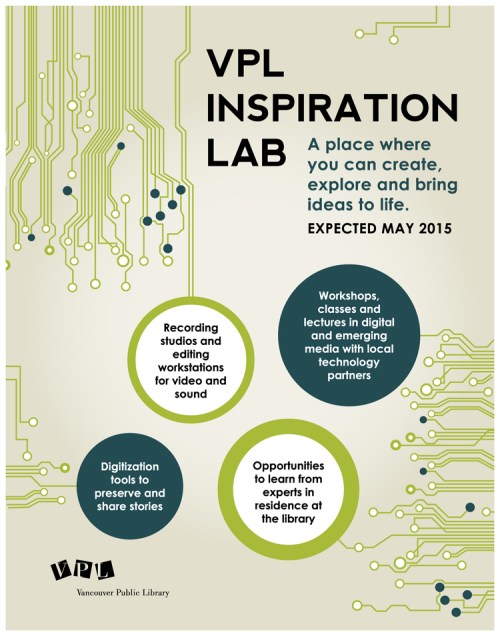
Another thing I was struck by was how modern and professional everything looked. Apart from things like couches, computers, wifi and art, I got the distinct sense that the library was trying to claim for itself a space in the digital age. At the VPL Inspiration Lab there were multiple recording rooms  with specialist microphones and video-cameras, green-screens, conversion devices (digitising VHS, for example). And all of this was free. There were also pamphlets and courses on things like how to save a document, how to browse the internet, and how to use social media (presumably for the elderly).

InspirationLab2

In fact while I was walking around the Inspiration Lab I saw someone giving a talk to about 12 people on ISBN numbers and how to publish your own book, and someone recording their narration of a book…

IMG_8571

And this is something that is explicitly encouraged and facilitated by the library:

Screen Shot 2016-03-19 at 3.30.17 PM

Since coming home and reading their Annual Report I quickly realised that the VPL is not the norm, either in Canada or in the OECD countries, and certainly not in South Africa. The Vancouver Public Library was ranked the best library in the world in one study. Now obviously these rankings (like all rankings) are a little dodgy, but the point is that this is one of the top libraries in the world.

My thoughts about VPL have been sloshing around in my brain for a week now and I’ve started realising a number of things about myself and public versus private goods. Growing up I think we did visit the public library a few times but it wasn’t anything spectacular or interesting. I never developed a love of public libraries or fully appreciated the role they could play in providing a social commons where books, information and knowledge were the principal means of engagement and interaction. Rather they were low-budget cranky places with old books and old people. Instead I developed a love of book-shops and book ownership. I think this was because walking around a good book shop felt welcoming and interesting; it has new books, has displays, has events (book launches, readings, discussions), it doesn’t feel grimy. But this is only because I can afford to buy the books that I like. And so here I start to see in my own life one small example of the way that the South African cogs work to perpetuate an unequal system. I don’t use a public library because they are of low quality, I buy books instead. So I never see the value of funding and using a great public library (at least until now). So here we are with thousands of wealthy people with small private libraries essentially each creating their own space that could otherwise be collectively provided by a great public library (and with public funds), which could then also be used by everyone.

I’m sure you can see that it’s not difficult to find the parallels between this and the private provision of healthcare, schooling, legal services, recreational facilities etc as compared to the public provision of these services. So it feels like we’re in a low-level equilibrium where the rich in SA can afford to fund for themselves whatever they need without any recourse to their tax money, and the poor are forced to accept whatever the government provides. This explains why many tax-payers (at least the South African tax-payers I know) see their tax as a kind of fee where you pay it with little expectation of return or service.

It costs a lot of money to fund and operate the 22 libraries that make up the Vancouver Public Library system, R527 million to be exact. Yet 94% of Vancouver residents support the use of tax dollars to fund the VPL.

If I had to say, I do not think that we can simply say “the first step is that the libraries that we do have need to better serve the communities within which they are situated.” while of course that is true, the apartheid legacy means that there are very few well-resourced libraries in the poorest areas (notably townships). I think it is an open question, and one that’s worth discussing, whether a functioning public library system that has the expertise and resources to support local residents (and especially local schools) is worth the considerable resources it would take to create such a system. The case needs to be made that (and in my view, is yet to be made) that it is possible to create such a library given our capacity and resource constraints. And secondly that it is a better use of resources than additional money on housing, child-support grants, teacher development etc.

I’m interested to hear your thoughts Equal Education, Nal’ibali, Bookery, Fundza, Bookdash and everyone in this space. Should we be funnelling millions of rands into creating functional public libraries in low-income high-density locations like Khayalitsha? Why aren’t we? Do we know how to do it? Who should lead the way?

Afrikaans universities perpetuate racial divisions (our M&G article)

black and white

[Image: Norman Akcroyd]

[This article first appeared in the Mail & Guardian on the 4th of March 2016]

Afrikaans universities perpetuate racial divisions – Nic Spaull & Debra Shepherd

In the last 2 weeks we have seen a number of protests erupt at former Afrikaans-only universities, specifically at the University of Pretoria and the University of the Free State. The reasons for the protests were numerous and included workers’ wages, accommodation, fees and the use of Afrikaans as a medium of instruction. At Stellenbosch University, a court case between AfriForum and the University was settled out of court last month and seemed to involve a reversal from the position of making English the primary medium of instruction at the University and instead giving English and Afrikaans equal status. For too long the issue of language in education has been dominated by ideological viewpoints that have little appreciation for, or understanding of, the empirical reality in South Africa. Of course language is inherently political – dealing as it does with issues of power, culture and identity – but those promoting or opposing a particular view need to show how those views square up with the linguistic, historical and socioeconomic context that we find ourselves in. Our aim here is to put some empirical evidence on the table so that we can move away from the anecdotes and ideologies that are currently driving policy and public-perception.

For over 50 years the apartheid government nurtured and resourced White-only schools and universities – both English and Afrikaans – while systematically under-resourcing institutions serving Black students. At the height of apartheid, the government allocated the same amount of resources to one White student at school as it did to 10 Black students at school. Even at the end of apartheid the average White child was receiving three and a half times as many resources from the government as the average Black child in one of the homelands. This legacy lives on in the post-apartheid period with ‘ex-Model-C’ schools continuing to be well-resourced as a result of the inertia of institutional functionality and the on-going investment by parents (of all races) that can afford fees, bequests and donations. The same can be said for former-White-only universities.

At universities the three major barriers preventing Black students accessing high-quality institutions are fees, language and weak academic results (from attending dysfunctional schools). The evidence of financial exclusion and financial inaccessibility is now well known. A research note published by our colleagues earlier this year showed that the cost of a BA degree at Stellenbosch had increased 30% between 2006 and 2015 and now requires 44% of average adult income. However there is far less evidence on the table about how many students are excluded from Stellenbosch because of language.

Of those students who qualified with a bachelor’s pass in matric 2014, every single student in the country took either English Home Language or English Second Language. In contrast, 61% of matrics who qualified with a bachelor’s pass did not take any Afrikaans subjects, either as a Home Language or a Second Language. If one looks at Black African students only, then 86% took no Afrikaans at all. It is reasonable to assume that 86% of Black African students who qualify to go to university understand no Afrikaans at all. How then are these students meant to understand some of their university subjects in Afrikaans if they are accepted at our university?

Frequently these students are told “If you don’t speak Afrikaans then go to one of the English universities”, as if there were an abundance of high-functioning English universities. There are only a limited number of ‘first-choice’ universities, and Stellenbosch is one of them. Under apartheid Stellenbosch, like it’s English White-only counterparts, was heavily resourced for 50 years and cannot now be ‘claimed’ by only one group. Stellenbosch has some of the best facilities and the best faculty in the country and should be available to all students, not only those that understand Afrikaans.

It is an uncomfortable truth that not all of South Africa’s 26 universities were born equal or are equal today – much like the born-frees. In the recent QS University ranking Stellenbosch was ranked the second best university in South Africa (after the University of Cape Town). In contrast, during the last 5 years three South African universities were placed under administration due to gross maladministration and bankruptcy. Of course the QS Rankings (like any rankings) are always dodgy, but Stellenbosch remains in the top 5 universities in the country irrespective of the measure you choose; NRF rated professors, research output, PhD production, students’ ‘first-choice’ etc.

At Stellenbosch there still exist dual-medium English and Afrikaans classes where lecturers switch between the two languages as they teach, essentially excluding (or confusing) those students who do not understand Afrikaans. In some courses there are also interpretation services. (Importantly this is usually from Afrikaans to English, not the other way around). A common thread of student protests at Stellenbosch has been that the interpretation services – referred to as ‘ghost whisperers’ – are inadequate, frustrating and create second-class students in the lecture hall. Having a mediated, second-hand learning experience is extremely frustrating and alienating. The issue of ‘separate’ English/Afrikaans classes and separate residence allocation based on language (which is against policy) is also highly problematic. It often leads to White-only Afrikaans classes or accommodation, which exists alongside mixed English classes and accommodation. How does this lead to integration and mutual understanding?

In a multilingual country like South Africa the ideal would be the development and use of all languages to the exclusion of none. The thing is, we have 11. This is simply not feasible in the short or even medium term. It is our view that in the balancing act between the right to access a historically well-resourced and currently highly-functional university; and the (qualified) right to learn in a home language, the former outweighs the latter. 100% of students that qualify for university do understand English while only 40% understand Afrikaans. Among Black African students, only 14% of those who qualify for university took any Afrikaans at school. We cannot see how excluding 86% of Black students from accessing Stellenbosch University is fair given our apartheid history, or how the University will become more representative of the country without transforming its language policy. In our view, ensuring that all courses are offered in at least English (without translation) is the least bad alternative of those available. It is not the responsibility of public universities to protect and defend any one language or culture. This is especially so when the patterns of historical and current privilege and exclusion are essentially one and the same.

Nic Spaull & Debra Shepherd are researchers in the Economics Department at Stellenbosch University.

On UFS brutality: No peace without justice

justice

“Justice requires not only the ceasing and desisting of injustice but also requires either punishment or reparation for injuries and damages inflicted for prior wrongdoing. The essence of justice is the redistribution of gains earned through the perpetration of injustice. If restitution is not made and reparations not instituted to compensate for prior injustices, those injustices are in effect rewarded. And the benefits such rewards conferred on the perpetrators of injustice will continue to “draw interest,” to be reinvested, and to be passed on to their children, who will use their inherited advantages to continue to exploit the children of the victims of the injustices of their ancestors. Consequently, injustice and inequality will be maintained across the generations as will their deleterious social, economic, and political outcomes.”

― Amos Wilson

Watching the racial dynamic cluster-fuck that is unfolding at our former White-only universities in South Africa feels like a kind of national de-ja-vu; the revisitation of the ghosts of apartheid. White brutes beating Black protesters in an attempt to protect their privileged way of life even as the legitimate demands of the working class become un-ignorable.

Land, fees, language, inequality…IMHO all of these boil down to a lack of adequate reparation and restitution at 1994. Too much fake kumbaya, too little real redistribution. As an artificial group ‘selected’ and ‘glorified’ by apartheid, White people did not offer up an unqualified admission of guilt and of unlawful enrichment as apartheid ended. Forgiveness was offered before it was asked for. Looking back over the last few years, or looking ahead at the elections to come, the topic may change but the tune is the same – people that have been consistently fucked over by colonialism, apartheid and now a self-enriching elite are eventually saying “Enough is enough, we also want a dignified existence.”

I cannot see how there can be true forgiveness and reconciliation without justice and reparations. There can be no sustainable peace and shared prosperity without justice.


In the Olden Days there were no women…

The trouble with women

From here.

New education research (SA)

Screen Shot 2016-02-21 at 1.33.10 PMImportant new research article by Stephen Taylor and Marisa von Flintel (2016) titled “Estimating the impact of language of instruction in South African primary schools: A fixed effects approach“
“For many children around the world, access to higher education and the labour market depends on becoming fluent in a second language. In South Africa, the majority of children do not speak English as their first language but are required to undertake their final school-leaving examinations in English. Most schools offer mother-tongue instruction in the first three grades of school and then transition to English as the language of instruction in the fourth grade. Some schools use English as the language of instruction from the first grade. In recent years a number of schools have changed their policy, thus creating within-school, cross-grade variation in the language of instruction received in the early grades. Using longitudinal data from the population of South African primary schools and a fixed-effects approach, we find that mother tongue instruction in the early grades significantly improves English acquisition, as measured in grades 4, 5 and 6.”

“A rising number of school leadership changes have been occurring in South African schools as a large proportion of incumbent principals near retirement age. While this presents opportunities to replace weaker school principals with better performing ones, these changes may also destabilise school environments and impede on learning. This paper explores how these principal change events affect school performance in the context of South Africa using a unique administrative dataset constructed by linking payroll data on the population of public school principals to national data on schools and matriculation examination outcomes. Exploiting the panel structure of the data, a school fixed effects strategy suggests that principal changes are indeed detrimental to school performance especially when leadership changes are due to principals exiting the public education system. These results are robust to using an alternative estimation strategy proposed by Heckman, Ichimura and Todd (1997) which combines propensity score matching with a difference-in-difference estimation strategy. The paper also considers two mechanisms through which school leadership changes may impact on school performance, namely through rising promotion rates and teacher turnover”

  • Two new policy briefs released by RESEP (1) “Increasing the supply of teacher graduates” (Hendrik van Broekhuizen) and (2) “Education datasets in South Africa” (Chris van Wyk).

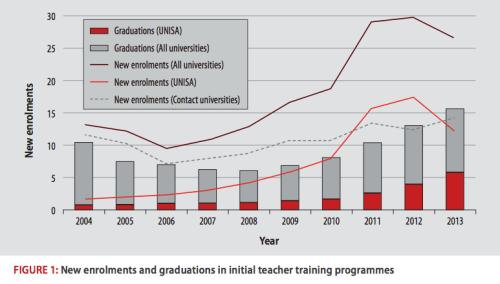
    In the first of these, Hendrik van Broekhuizen describes teacher graduate production in South Africa in the context of existing teacher shortages and finds that universities are still not producing enough teacher graduates  to satisfy the demand for qualified new teachers in South African schools.   Importantly he also stresses the importance of UNISA in the production of new teachers –  between 2008 and 2013 UNISA accounted for half (48%) of all new enrolments in initial teacher education. Despite rising enrolments in teacher training programmes over the past decade, enrolment levels remain low. This is exacerbated by the fact that too few students complete their training programmes and too few new teacher graduates become teachers. His research highlights the need to (1) promote the teaching profession, (2) increase the absorption of new teacher graduates, (3) expand targeted funding for African-language teaching students, and (4) place greater focus on UNISA’s increasingly important role in teacher graduate production.   The full research paper can be found here. The graph below summarises the UNISA situation well…

Screen Shot 2016-02-21 at 1.29.12 PM

Important new education research

holy

    • Ursula Hoadley and Joe Muller have just published their important paper looking at assessment in South Africa “Visibility and differentiation: Systemic testing in a developing country context” (Curriculum Journal, 2016)- I prefer their earlier title “Testing testing: Investigating the epistemic potential of systemic testing” (Un-gated draft-version of that paper here).
    • Why has large-scale standardised testing attracted such a bad press? Why has pedagogic benefit to be derived from test results been downplayed? The paper investigates this question by first surveying the pros and cons of testing in the literature, and goes on to examine educators’ responses to standardised, large-scale tests in a sample of low socio-economic status (SES) schools in the Western Cape, South Africa. The paper shows that teachers and school managers have an ambivalent attitude to tests, wary of the reputational costs they can incur, but also curious about the differentiated picture test results can give them as they learn to ‘read’ the underlying codes embedded in the results. The paper concludes that a focus on what tests make visible and a recognition of the pedagogic agency of teachers points to potential pedagogic benefits of systemic tests.

    • Craig Paxton has finally finished his PhD thesis “Possibilities and constraints for improvement in rural South African schools” (UCT, 2015). This is on my to skim/read list together with Eric Schollar’s PhD (see below)
    • Part of Craig’s PhD abstract:”Rural South African schools face a complex mix of challenges, which make improvement a daunting task. Not only do schools deal with the time, place and space issues that face rural schools worldwide, but in addition they contend with a legacy of severely deprived schooling under the apartheid system. Using the framework of the Five Essential Supports, developed by the Consortium on Chicago School Research, together with Bourdieu’s notions of habitus and doxa, this thesis examines what improvement might mean in this deeply disadvantaged context. The five supports – leadership, learning climate, school-community ties, ambitious instruction and professional capacity – are contextualised to account for both the rural setting and the peculiarities of education in South Africa’s former homeland communities. Alongside this largely quantitative framework, Bourdieu’s conceptual tools are brought to bear, offering an alternative perspective that makes sense of the complex forces produced by history and rurality

    •  Pritchett’s new (2015) RISE Working Paper “Creating Education Systems Coherent for Learning Outcomes.” This has been quite an influential paper for me. Although in the South African context I would almost always add “Capacitation” to his four criteria Delegation, Financing, Information, Motivation. Lant also has a great (and scathing) critique of meta-analyses of quantitative studies:
    • If one were to take this approach of “rigorous evidence” at face value then there is rigorous evidence that nothing in the conventional wisdom actually works. There is rigorous evidence that giving out textbooks doesn’t matter, there is rigorous evidence pay for performance doesn’t matter, there is rigorous evidence that class size doesn’t matter. Of course there is also rigorous evidence that all these elements of the conventional wisdom do matter. The usual approach of doing a “systematic review” of the literature that simply counts studies (in a quality weighted basis) is not at all helpful. Suppose that context A is a system coherent for learning—so that teachers know what students should learn, that learning is measured on a regular and reliable basis and teachers are motivated to achieve high student learning—and class size is reduced. Let’s assume that learning improves (as there is RCT evidence from the USA, for instance, that this is true). Context B is a system coherent for schooling only. Class size is reduced. Let’s assume learning doesn’t improve (as there is RCT evidence from Kenya, for instance, that this is true). Suppose the only two studies in the systematic review were USA and Kenya. Then the conclusion would be that “class size improves student learning in 50 percent of the studies.” Now suppose that 8 more rigorous studies were done in the USA so that a systematic review would conclude “class size improves student learning in 90 percent of studies.” Suppose, in contrast, 8 more studies were done in Kenya. Then a systematic review of the rigorous evidence would conclude “class size improves student learning in 10 percent of the studies.” All three statements are equally worthless. The (assumed) truth is that “class size improves performance in context A but not in context B” and hence unless one knows whether the relevant context is A or B the systematic review finding of impact in 50 percent, 90 percent or 10 percent of the studied cases is irrelevant.

  • Glewwe & Muralidharan’s new (2015) RISE Working Paper “Improving School Education Outcomes in Developing Countries” they find that:
  • Interventions that focus on improved pedagogy (especially supplemental instruction to children lagging behind grade level competencies) are particularly effective, and so are interventions that improve school governance and teacher accountability

Matric 2015 standardisation matters

denial

OK so I got a little frustrated with explaining the whole matric standardisation vibe to a million people, so here’s the deal once and for all…

Soon after the matric results jamboree ended and people went back to work, there were a few unanswered questions about how the matric exams of 2015 were standardised by Umalusi. Already in September of 2015 I was asking some Departmental officials whether the Minister was going to report the matric results of progressed and non-progressed learners separately (which is what I would’ve done). The logic being that the public (wrongly) view the matric exam as the main indicator of the health of the education system and that if progressed learners were lumped with non-progressed learners there would be excess pressure to ensure that the matric pass rate did not drop too much. But this is not the approach that the DBE took. I also emailed someone in Umalusi to ask how they were planning on doing their standardisation given that the two groups of matrics (2014 and 2015) were so different, with the latter having many more students due to the progressed learner policy.

After comparing the publicly-available Umalusi statement and the publicly available DBE NSC Technical Report 2015 it became possible to see how large the Umalusi adjustments were this for 2014 and 2015 for nine subjects – see table below.

Screen Shot 2016-01-24 at 1.27.52 PM

I won’t rehash my full argument here (if you’re interested read my article Matric Cracks Starting to Show). The yellow highlighted subjects are those that had big jumps in enrolments, for example there were an extra 76,791 learners taking maths-literacy in 2015 compared to 2014. Notice that the pass rates increased substantially between the raw pass rate and the pass rate after (1) Umalusi adjustment, (2) language compensation, (3) school-based assessment. The gist of that article was to say that the progressed learners of 2015 were not properly accounted for in the Umalusi standardisation process and that the most logical reason for a drop in performance of the raw marks was the inclusion of extra (weaker) learners, i.e. progressed learners, rather than a much more difficult exam.

bother

Subsequent to my article, the CEO of Umalusi, Dr Rakometsi, wrote a reply titled “Promoted pupils had no big effect on matric rates” and clarified a number of issues. For the sake of brevity I will summarize the most salient points here:

  • Umalusi was told by the DBE that there were only 66,088 progressed learners
  • If one excludes these 66,088 progressed learners then the failure rate within subjects increased by between 1% and 4%.
  • He confirmed that “the pass rate on raw marks is at 38% for maths-literacy
  • The maximum adjustment that Umalusi can make is 10 percentage points which was applied for mathematics literacy “because the paper turned out to be more difficult in 2015 compared to previous years. As a results of this maximum adjustment, 27% of learners who scored between 20-29% obtained a pass”
  • One paragraph in the article is particularly important and so I quote it verbatim:

“The report indicates that the impact of progressed learners to the individual subjects was minimal. As a result, there was no basis to standardise the results of the progressed learners separately. What we call progressed learners is actually only the KNOWN progressed learners. The argument that there were more is an assumption. Umalusi can only work on the information before it, not on assumptions and extrapolations.”

From the above we can draw two important conclusions:

(1) The 66,088 progressed learners were not excluded when the results were standardised relative to earlier years, despite knowing that these learners were weaker students. This seems totally bizarre. We know that these are weaker learners, why would we include them in the norm-referencing curve and compare to earlier years were these students did not exist? Even if they only contributed to a drop in the pass rate of between 1-4% why were they excluded?

2) (the most important conclusion) Umalusi only looked at the 66,088 “officially” progressed learners and ignored all the other information suggesting that there might be additional weaker learners who were actually progressed learners but were not captured as progressed learners, what I called “quasi-progressed” learners in my article. We know that provinces are not recording who is a progressed learner with the same accuracy.

Perhaps the most telling evidence is just to ask how many extra matrics there were in 2015 compared to 2014? The answer is 111,676 (644,536 in 2015 compared to 532,860 in 2014). But if there were only 66,088 progressed learners, where did the remaining 45,588 learners come from?

dissolve

Some have suggested that it’s from a change of age policy that happened in 1998, but that lead to a small cohort in 2011/2012 not now, as Stephen Taylor has shown using EMIS data. The table below (taken from here) shows the different enrolment numbers by year and grade. What we can see is that the matric class of 2011 was always going to be small  If we look at the matric class of 2011 there were 534,498 learners in matric and only 930,019 learners in grade 8 four years earlier. Basically we knew that the matric class of 2011 was going to be smaller. Whereas if we look at the matric class of 2015 (with 687,230 learners according to this table) this is unexplainably big. If we look at the grade 8 cohort of 2011 we see that there were 1,008,110 which is only about 7000 learners more than the grade 8 class of 2010. So how are we to explain the massive difference we see when we compare the 2014 and 2015 matrics (111,676)?

Screen Shot 2016-01-24 at 2.04.53 PM

In my mind the answer is straight-forward – the extra learners in matric 2015 are the direct result of trying to decrease grade repetition by “promoting” weaker learners into higher grades rather than fail them. If this is correct then we needed to exclude the full 111,676 learners when standardising relative to earlier years. Umalusi will (and has) argued that this was not possible and that they did not even try to take into account of quasi-progressed learners.

head banging

So those of you that’ve read this far might be asking “So who cares? Why is this even important?” and the answer is that it matters a lot for universities and the labour-market if Umalusi gets this wrong.  If the standardisation process assumed that a drop in the raw marks was only due to an increase in test difficulty (which is what Umalusi did) when a more plausible explanation was that it was because we included an extra 21% of weaker learners, then the real value (and signal) of a basic matric is actually declining over time.

On page 171 of the 2014 Ministerial Task Team Review of the NSC we read the specifications of when Umalusi can and cannot adjust matric marks:

“Reasons for differences may include: cohort differences, changes in curriculum, changes in setters of the examination papers, disruptions in the schooling processes and security leakages. In the absence of evidence of such possible reasons, it is then generally accepted that the differences are due to deviations in the standards of the examination or marking and therefore marks are adjusted to compensate for the deviations (Umalusi 2007a, 29).” [emphasis added]

Personally I do think that some of these tests increased in difficulty, but it is ludicrous to think that adding 21% more students who are KNOWN to be weaker students would not decrease the marks. Also this is the first year where basically all adjustments were upward. There was not a single downward adjustment. Coincidence much?

thats messed up

Just because Umalusi could not identify the quasi-progressed learners doesn’t mean they can just ignore them. Hence the cartoon above. It would seem that Umalusi has essentially said “Yes we can see that the cohort is much bigger. Yes we can see that there was a clear policy intervention to progress weaker learners. Yes we can see that the official numbers of progressed learners do not match with the full increase in the size of the cohort. But we are going to pretend that there were only 66,088 progressed learners. We refuse to accept any other reality because we can’t do anything about it anyway so what’s the use in knowing.

The fact that the marks were pushed up primarily at the bottom (probably too much) means that students passed in 2015 who would not have passed in 2012. It means students have qualified to study basic degrees in 2015 who would not have qualified if they wrote in 2012. So, if I’m right, any of the following could result:

  • There will be a flood of applications for degrees and diploma’s that require the lowest levels of matric points. Thousands more students will have ‘met the criteria’ and the universities would not have not anticipated this. In fact I have already heard that UNISA has had an unprecedented increase in applications, Edgewood at UKZN has been swamped. Damelin has a huge spike in applications. If I’m right then these students should never have qualified for university and will fail. They might incur debt, move province, make life decisions based on incorrect signal. (Let us not speculate on how the surge in applications for NSFAS will stoke the FeesMustFall fire and mean that there is less to go around and more angry students with hopes and dreams that the State cannot fulfil.
  • Universities will see students that are not even remotely prepared for higher academic study and will have to increase their access programs and expect higher failure rates.
  • As a result of the above the universities will increase the matric-point requirements for entry into their programs for 2017 (particularly programs like B.A, B.Soc-Sci, B.Ed etc.). They will also start to rely more on the National Benchmarking Tests in their selection criteria. [Sidebar, researchers should compare NBT results with matric results in 2013, 2014 and 2015 to see if there are any differences that might be attributable to wrongly-boosted matric marks]. 
  • The gap between the earnings of those with a matric and those with a matric+degree will grow (note it is already large, see graph below). This is largely because the adjustment was primarily at the bottom meaning there are many more students with a low-level-matric who have, in effect, lower levels of knowledge and skill than low-level-matrics of 5 years ago.

Screen Shot 2016-01-24 at 2.30.15 PM

(Source: Hendrik van Broekhuizen, 2013, here)

As I said, none of the above precludes the fact that the tests were more difficult in 2015 (although this is still speculation). I am only saying that there is no way in my mind that including an extra hundred thousand weaker learners didn’t play any part in the drop in the raw marks. And, in essence, that is what Umalusi is arguing.

oprah no

Dr Rakometsi and I will be discussing this on the Redi Hlabi show at 10am tomorrow (25 Jan 2016). It should be an interesting discussion 🙂

redi-tlhabi_detail.jpg

Links I liked

think


“Matric Cracks Starting to Show” – my ST article

crack

(The article below first appeared in the Sunday Times on the 10th of January 2016)

Like so many things in South Africa, this year’s matric results are a paradox of good policies badly implemented. This time it was the Minister’s bold ‘promotion policy’ that led to an extra 21% more learners writing matric (644,536 this year compared to 532,860 last year). The policy limits the number of times learners can repeat a grade to once every three years and means fewer students drop out, being ‘promoted’ instead. While her decisive action has led to increased efficiency and improved access, it has also inadvertently caused a huge crack in the matric standardisation process, one that is only now starting to become apparent. The fact that the Department did not properly identify all progressed learners, and that Umalusi did not (and perhaps could not) take account of all progressed learners in their standardisation process calls into question the massive upward adjustments in marks that took place behind the scenes.

As usual, some commentators have myopically focussed on the drop in the matric pass rate, from 76% (2014) to 71% (2015) as if this, in and of itself, were a meaningful indication of anything. It isn’t. Or that it signalled a decline in quality, or harder exams. It doesn’t. Yes, the matric pass rate went down but the number of learners passing it went up. And in fact the real question might not be why the matric pass rate dropped, but why it didn’t drop further. In comparing the media statement from Umalusi and the technical report from the Department, the answer is quite clear. The decision was made to raise the raw marks across the board, from Maths and Physical Science to Life Science, Maths Literacy, History, Accounting, Geography and 24 other subjects. Umalusi themselves make a point of emphasizing that this was an “unprecedented set of adjustments”. When the Maths Literacy pass rate is adjusted from 38% to the final (and publicly reported) 71%, this is most certainly unprecedented, and I would argue, unwarranted. Was the test really so much more difficult than previous years? (This is the only reason why one is allowed to adjust the marks at all). Why did the internal and external moderators not pick up the huge increase in difficulty? Is it not more plausible that the massive drop in pre-adjusted performance was actually due to the additional 112,000 weaker learners who would’ve otherwise dropped out? If so, Umalusi shouldn’t have adjusted.

This is not to say that the Minister was wrong in introducing the promotion policy. Quite the opposite; she was heeding local and international research which shows that excessive repetition is costly, inefficient and has no educational benefit to the learner. Yes, we do need to find ways of preventing and remediating the problem, but rooting out wasteful repetition in the mean time is prudent and wise. A positive effect of this policy and the extra-large class of 2015 meant many more learners taking and passing key subjects, with about 52,000 extra matric passes, 9000 extra maths passes and 15,500 extra bachelor passes.

Both Umalusi and the Department claim that there were only 65,671 progressed learners. Yet there were an extra 111,676 matrics this year. So where did the other 46,005 extra learners come from? The clear answer is that there was a big policy change preventing schools failing learners multiple times and encouraging them to promote weak learners and push them into matric. Secondly, the way provinces record and report who is a progressed learner is highly dubious and varies by province and district. So, although we have approximately 66,000 ‘officially’ progressed learners, we also have 46,000 ‘quasi-progressed’ learners (what Umalusi calls ‘borderline candidates’).

The reason why all of this matters is because it influences the decision of whether to adjust the matric results and by how much. Umalusi is only ever meant to adjust the marks up or down if they believe the exam was harder or easier than previous years. The core assumption in this standardisation process is that the different matric cohorts (2013, 2014 or 2015 matrics) are of equal ability. Thus, any differences between the years can only be because the paper was easier or harder. And this is where the crack emerges. There is simply no way that the 2015 distribution of 645,000 matrics (including progressed and quasi-progressed learners) are as strong as the distribution of 533,000 learners in 2014. Thus the reason the 2015 cohort did so much worse on the raw scores was because of the extra 112,000 weaker learners, not because the tests were harder. We know that Umalusi did not take this into account because there is no way of identifying the 46,000 quasi-progressed learners. In Umalusi’s defence they couldn’t have excluded them even if they had wanted to because provinces didn’t record them. But it doesn’t seem Umalusi excluded these 112,000 (or even the 66,000) learners when they standardised the 2014 and 2015 distributions. This is illogical.

In an unusual change from previous media statements, this year Umalusi included the raw failure rates of subjects (i.e. before any adjustments). This can be compared to the marks in the technical report issued by the Department. The only difference between the two figures are the Umalusi adjustment, a small change due to school based assessments and a small language compensation for second language learners (extra 4 percentage points). When I refer to ‘raw’ and ‘final-adjusted’ pass rates I mean before and after these are accounted for. The three subjects I will focus on here are Maths Literacy, Geography and Business Studies since they all have big increases in enrolments which suggests these were the subjects taken by the progressed and quasi-progressed learners. The differences between the raw pass rate and the final-adjusted pass rate are large for Geography (increased from 66% to 77%), for Business Studies (increased from 54% to 76%) and especially for Maths Literacy (from a shockingly low 38% to 71% after adjustments!). For a national assessment these are incredibly large adjustments.

This could only be justified if the 2015 exams were extraordinarily more difficult in 2015 than in 2014. I simply do not buy it. The internal and external moderators all agreed that these exams were set at the appropriate level. To warrant adjustments of this magnitude they would have had to have been way out in their judgements. Why are we looking for alternative explanations for the big drop in raw marks when this one is staring us in the face? The most logical and obvious reason for the drop is the inclusion of an extra 112,000 weaker learners in 2015. Paper difficulty is marginal by comparison. In maths literacy alone there were 76,791 extra candidates in 2015. Where did these learners come from? It is clear that these are the weaker progressed and borderline candidates and that they are the main reason why the raw marks dropped so much. If so then we cannot just adjust the raw marks upwards, as was done this year.

The Umalusi standardisation process is necessary and probably the best we can do when different papers are written year-on-year, but Umalusi needs to clarify what happened here and in future be more transparent in their standardisation process. Unfortunately, no amount of standardisation can solve the biggest problem in our education system which is the fact that most children attending the poorest 75% of schools do not learn to read for meaning by the end of grade three and are forever behind. Indeed, matric starts in grade 1.

Dr Nic Spaull is an education economist at Stellenbosch University. He can be found on Twitter @NicSpaull and his work can be found at nicspaull.com

Guest blog: Gabi Wills on “Teacher union membership in SA”

triangles

Below is an Extract from Gabi Wills forthcoming PhD thesis:

Chapter 4: Teachers’ unions and industrial action in South African schooling. Exploring their impacts on learning. In Wills (2015, forthcoming) An economic perspective on school leadership and teachers’ unions in South Africa”

Teacher union membership in South Africa

During apartheid, the provision of unequal education to race groups was an instituted policy mechanism to supress the majority of South Africa’s black population. Most notoriously, black people were intentionally provided inferior education through the then ruling party’s “Bantu education”[1] policies. Separate education departments, divided along racial lines, implemented not only distinctive curricula for students but distinctive forms of authority over teachers. As noted by Chisholm (1999), control over white teachers was largely professional in nature where they were consulted in the formation of curricula and given a degree of autonomy in work. By contrast, control over black teachers was intentionally bureaucratic and authoritarian in line with state intentions for social control. Black teachers were closely monitored by inspectors, subject advisors and other representations of white subjugation. In the late eighties, however, large political opposition arose to apartheid in general and particularly its unjust education policies (Govender, 2004). The linkage with the apartheid state of bureaucratic controls over teachers generated considerable teacher resistance which persists today.

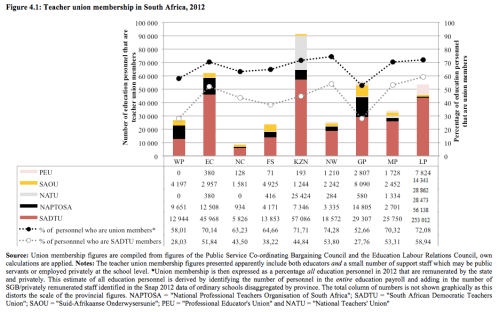
As a rough estimate, two thirds[2] of all persons in education (including administrators, management, support staff and privately employed personnel in schools) are formally identified as members of a teacher union in South Africa. In absolute terms, this represents 380 000 members using 2012 data where membership rates and choice of teacher union differ across provinces.

Screen Shot 2015-12-24 at 9.15.41 AM

Figure 4.1: Teacher union membership in South Africa, 2012

If one limits the national teacher union membership estimate to only teachers this estimate is likely to be higher. Armstrong (2014: 4) using the Labour Force Surveys between 2000 and 2007 identified that roughly 76 percent of teachers in South Africa are union members. What these national estimates do not recognise is the interesting provincial dimension to union membership in the education sector which is highest in provinces such as the North West, Limpopo, KwaZulu-Natal, Mpumulanga and the Eastern Cape but notably lower in Gauteng Province and the Western Cape.

There are various different teacher unions in South Africa, but by far the dominant union is the South African Democratic Teachers’ Union, most commonly referred to as SADTU. Audited 2012 figures indicate that their membership comprised roughly 253 000 personnel which represents two thirds of all registered teacher union members. SADTU membership has also grown substantially over the past twenty years, with membership figures in 2012 that were 2.5 times that in 1996 (Govender, 2004).[3] A clear provincial dimension exists to SADTU affiliation. Their proliferation is strongest in the Limpopo Province where figures from the Public Service Co-ordinating Bargaining Council suggest that 82 percent of all unionised education personnel in Limpopo are registered members of SADTU, compared with a figure of 48 percent in the Western Cape. The next largest teachers’ union is the National Professional Teachers’ Association of South Africa (NAPTOSA) with just over 50 000 members as at December 2012. Affiliation to this union is strongest in the Western Cape and the Gauteng Province when expressed as a proportion of unionised teachers in each province. These provincial differences in union membership are worth noting. They may have implications for differences in the balance of negotiating power across provincial chambers of the ELRC and in the functioning of provincial administration departments of education.

Considering the two largest teachers’ unions in South Africa, SADTU and NAPTOSA, both play a role in negotiating conditions of work for teachers in two sets of combined teachers unions[4] in the sector specific ELRC. Both unions fulfil a primary function as bargaining agents for their members, although on the basis of sheer vote size SADTU’s influence in negotiations is considerably more substantive. However, in balancing their secondary functions as political and professional organisations[5] they are divergent in their ideologies (Chisholm, 1999; de Clercq, 2013). Teacher unions represented in what is now NAPTOSA existed in the early days of apartheid with typically white leadership and an agenda largely concerned with the professionalism of teachers. By contrast SADTU, having emerged in direct opposition to apartheid, is understandably more militant, political and concerned with the rights of the ‘worker’ than promoting professionalism (Chisholm, 1999). Moreover, SADTU is an affiliate of COSATU – one of the three members in the tripartite ruling alliance – which prioritises their role as a political organisation over their function as a professional body. As a political organisation, their presence is extensive not only in terms of membership numbers. The organisational structure of the union facilitates an on-site presence across almost all school districts and in the majority of schools.

______________________________________________

[1] The Bantu Education Act of 1953 was the designed plan of former Prime Minister H.F. Verwoerd. In his own words he said, “There is no place for [the Bantu] in the European community above the level of certain forms of labour. It is of no avail for him to receive a training which has as its aim, absorption in the European community” (Senate, 1954). The Bantu Education system was established to educate black youth only to a level where they could operate as labourer, worker and servant.

[2] See the notes of Figure 4.1 for a description of how this figure was estimated relying on union membership figures from the Public Services Bargaining Council (PSBC). Calculating teacher unionisation rates with available data in South Africa is not straight forward, where it is not obvious what groups of education personnel are included in the PSBC figures. On the basis of a priori expectations this estimate of 66 percent seems too low but it must be noted that in both the numerator and denominator of the calculation are non-educator personnel such as provincial or district staff, school support staff and privately employed SGB or other staff members at the school level. If one were to limit the numerator and denominator to include only educators, this figure may be higher if more educators than administrators are unionised. It is also noted that some studies have erroneously attributed teacher union membership figures reported by the PSBC as referring to teachers only, when non-teachers in the education sector are also included in these figures. For example, both SADTU and NAPTOSA attract teachers in the public and private sector and other workers in the education sector to their membership base. If this is not recognised, this results in over inflated estimates of teacher unionisation as high as 90 percent in some studies.

[3] The majority of the growth in SADTU’s membership took place between 1996 and 1999 when their membership base grew from 106 000 to nearly 200 000 three years later (Govender, 2004).

[4] At the ELRC, negotiations and consultation takes place between the Employer (the DBE) and two sets of combined trade unions (CTU). The first is the CTU-SADTU where SADTU membership vote weights are combined with the Cape Teachers’ Professional Association (CTPA). NAPTOSA’s bargaining power is established through the combined ‘Autonomous Teachers Union’ (ATU) which includes a number of smaller unions including the Suid-Afrikaanse Onderwysersunie (SAOU), the National Teachers’ Union (NATU), the Professional Educators Union (PEU), the Public Servants Association (PSA) and the Health and Other Service Personnel Trade Unions of South Africa (HOSPERA).

[5] As noted by Cowen and Strunk (2014), there are three main functions of teachers’ unions. The first and most dominant role is that of a bargaining agent for member teachers and the second role is that of a political organisation advocating for teachers. As a political organisation, their function is to act as an interest group, “active not only in promoting or opposing particular pieces of legislation or administrative policy, but also as a force in national, state and local elections” (ibid, 2014: 4). The third role is that of a professional organisation, providing support to individual teachers. In particular, where teacher unions embrace their role as a catalyst for the professionalization of the teaching force, this can yield very positive impacts for educational systems. However, this role is not widely explored in relation to its influence on student achievement and altering district/national resources for education (Cowen and Strunk, 2014: 4).

Q&A with Jonathan Jansen (SAERA SIG)

jansen

The Q&A with Professor Jonathan Jansen below first appeared in the SAERA “System-wide Educational Change” Newsletter.

Q&A with Jonathan Jansen

You have recently published two new books on educational change that have received critical attention from the public, How to Fix Schools (2014) and Leading for Change (2015). What is it about your thinking that has attracted so many readers?

First of all, everyone knows that there is something wrong in education, those that work in schools and those that send their children there and the general public. So I think that it helps attract a broad readership because of the focus on the issue in the media. Second, I think people don’t just read books they read authors and so the fact that I have been in the public space a lot more in recent years largely through my column in The Times for example. This gives the books the kind of attention that they would not have gotten otherwise. Third, in both of these publications, I try not to deal with these concerns in abstract academic language but to make them as practical as possible and to be as insightful as possible for people who are not specialists. It is for them to enjoy and to spur them to action. And fourth, I try to insert a sense of hopefulness at the end to each book.

Much of your work centres on educational leadership at various levels, particularly the role of leaders in transforming relationships. Can you talk a little about how you conceptualise the relationship between leaders and leadership at institutional level and system-wide policy or programme driven change?

I have more or less given up on the ability of system leaders to be able to make change from the top. I have been around too long to believe that this is even possible.
As you know in the early days of the transition, during and after the days of NEPI, I sat on committees of government when there was excitement about being able to say something worthwhile and there was a fair chance that you would be heard by the minister or the DG. I don’t have that sense anymore. My sense is that critics and public intellectuals are being shut out of these kinds of spaces. So I made a conscious decision to engage through visible practices of leadership. Sometimes these gain the attention of those in higher authority. Idon’tthinkwehavea government that is attentive enough or serious enough about educational change to allow practice and research to inform policy. For example, the most profound piece of practical research ever done in the history of this country is the National Development Plan. The diagnosis is profound. And yet, the government seems unable to absorb the good thinking and sound data into development actions. In saying this, I have not strayed too far from my work on the symbolic functions of policy. That is not to say that I am cynical or unpatriotic. Quite the opposite. There is limited space time and space to make a difference. For me, I am able to do this, for example, by working on projects like How to Fix Schools by providing books and videos to all high schools in the country with training support where required.

This doesn’t require working directly with government at national, provincial or local levels on policy.

What do you consider to be the key research areas to focus on for young and mid-career researchers interested in leadership and system- wide educational change?

The first thing to be said to young and mid-career scholars working on system-wide educational change is that it is time for bold new ideas and approaches to the subject. In other words, instead of replicating the kinds of things senior scholars like myself, Pam Christie and Jo Muller have done, a new generation needs to ask different kinds of questions and experiment with new methodologies. The upcoming generation of scholars need to provide new insights about the persistence of certain kinds of problems built into the system of education. Second, we need to move away from the fidelity perspective in policy studies. Too many policy studies still focus on how faithfully people implement this or that policy. When there is a big gap, they explain it as the consequence of ‘stubborn teachers’ or think that policies are ‘stupid’. We need to move beyond this fidelity approach to policy studies and introduce new questions about the relationship between policy and practice. This will take us away from stale formulations. Third, I also think we need to move away from a pre-occupation with analyses of exceptional cases. When we do use them, we need take a fresh look at how they are used. Finally, I think we need to shift our focus from the problem of change to the problem of continuity.

The System-wide Educational Change SIG has had its inaugural meeting this year in Bloemfontein at SAERA. What do we need to do as an emerging research community to build scholarship in our field?

We need to get more people with great potential into the field. That must be the number one priority. We need to connect them with scholars and scholarship around the world. It is not sufficient that they do their PhD studies at UCT, Wits or the Free State. New scholars with great potential need to spend time with people like Alma Harris in the UK or Andy Hargreaves at Boston College. The capacity to speak to local problems in intellectually powerful ways means knowing about and being fluent with educational change discourse and practices in other parts of the world. This would allow us to be theoretically courageous. As you know I have often say that you cannot get very far at UCT without referencing Bernstein or Bourdieu, at UWC without referencing Marx and Frere, and Stellenbosch without van der Walt or van der Stoep. Getting out will allow people emerge from the deeply entrenched tracks of theory and method. Broadening intellectual life requires being international and comparative in focus. Advanced scholars these days need more than a PhD and for a good post-doc experience, they need wider exposure.

We know that you tweet and have a strong presence on YouTube. How should our research community be engaging with the new media space?

This is an important issue less for myself than for a new generation of scholars. I really cannot see how a new PhD scholar in the post 2015 world can work unless they are connected to a whole lot of sites and platforms for their day to day research. Online professional networks provide a platform for your ideas, for your CVs, for the circulation of your research papers. These new media spaces allow for wider audiences to actively engage with your ideas and scholarship. The people I spoke about earlier, Alma and Andy use twitter to give

the latest updates on the papers they are presenting at conferences in Malaysia and Australia. I’m amazed at how a bunch of us get tagged and can engage with their ideas through the simple medium of twitter. I have just recorded a series of lectures on leadership and research that will go on YouTube. And we will see the responses from around the world. We are certainly not going to get far unless there is a consciousness about social media and the technical ability to navigate with these new spaces.

What would you want to see us doing with the SAERA SIG newsletter?

I’m excited about the potential of the newsletter. It can allow us to know more about what everyone is doing around the country. I often get surprised about research that is going on in some institution or another, and I think of myself as being in touch. The newsletter is a forum for sharing new ideas, new questions, and new methodologies. It can also showcase the experts in specific areas. For example, Brigette Smit knows a lot about computerised qualitative data analysis. It also provides a space to highlight what is happening around the world. The newsletter can also stimulate a dialogue between up- and -coming scholars and established academics. I’m amazed at how many emails I get from young scholars asking advice and requesting to be mentored. The newsletter would provide an organised platform for this.

Links I liked (and some personal reflections)

rise

  • Taylor, N. 1989. Falling at the First Hurdle: Initial encounters with the formal system of African education in South Africa. Research Report #1. EPU. (via JET Education). – an old but important report that is not in the public domain yet (as far as I’m aware) – thanks JET for scanning this.

  • “Improving learning in primary schools of developing countries: A meta-analysis of randomized experiments” – Patrick McEwan (2015) (via Servaas van der Berg).
  • The independent Task Team led by Prof John Volmink, which was appointed to look into the ‘jobs-for-cash’ scandal exposed by CityPress last year, has found that SADTU has a ‘stranglehold‘ over the State in provinces such as the Eastern Cape, Limpopo, Mpumalanga and KwaZulu-Natal. These scandals sometimes turn deadly when the ‘right’ candidate is not appointed. On this topic I would highly recommend Gabi Wills’ new article “Informing principal policy reforms in South Africa through data-based evidence.” To give you the highlight: The cohort of principals that are currently in the system are, on average, much older than they were in the past meaning that there is soon to be a wave of principal retirements. Whereas in 2004 only 17% of principals were aged 55yrs+, in 2012 that figure was 33%! If these principals retire at 60 this means that between 2012 and 2017 there will be about 7000 principal replacements! (remember there are only about 24,000 public schools in SA).
  • This latest report shows that the South African Council of Educators (SACE) is a toothless dog, as I have argued before. Earlier this year SACE ran their own investigation into the exact same jobs-for-cash scam and could not find “a single bit of evidence” that there was corruption in the appointment of teachers and principals in SA. Subsequently CityPress has claimed SADTU ‘told SACE to end their investigation” after the names of top SADTU officials started cropping up in the investigation. So how is it that SACE ran an investigation on the same issue at the same time and found no evidence while Volmink’s team found multiple examples of corruption, and 13 of the cases were so strong that they could already be passed on to the police? Go figure. Minister Motshekga needs to put a target on SACE and reform the entire organization. It is rotten through and through.
  • Holstee have come up with a set of 10 questions to ask yourself about the year that was. Reflection. Contemplation. Good stuff.
  • I’m re-reading Henri Nouwen’s “Reaching Out” – the book where he outlines his understanding of spirituality from the Christian perspective. It’s lovely, not too preachy or crispy-clean / three-bags-full-sir Christianiaty which I have little tolerance for. One quote:

“When loneliness is haunting me with its possibility of being a threshold instead of a dead end, a new creation instead of a grave, a meeting place instead of an abyss, then time loses its desperate clutch on me. Then I no longer have to live in a frenzy of activity, overwhelmed and afraid of the missed opportunity” – Anonymous in Nouwen’s Reaching Out p35

“All models are wrong but some are useful.“

— George Box (via Farnam Street Brain Food)

I am really enjoying poetry for the first time in a long time…

“I said to my soul, be still and wait without hope, for hope would be hope for the wrong thing; wait without love, for love would be love of the wrong thing; there is yet faith, but the faith and the love are all in the waiting. Wait without thought, for you are not ready for thought: So the darkness shall be the light, and the stillness the dancing.” – T.S. Elliott

Also Pablo Neruda.

It was also my birthday last month which started in tears and ended in champagne with a view! Ad Astra Per Aspera!

IMG_7650

Photo credit: Michael Chandler (@MrChandlerHouse)

Important new SA education research (SAJCE Special Issue)

moon

As part of my postdoc at Stellenbosch University and Stanford University I have been managing a large research project commissioned by the SA Presidency and funded by the EU in the Programme to Support Pro-Poor Policy Development (PSPPD for short!). The aim is to identify the ‘binding constraints’ in the SA education sector – more on that in the coming months. As part of that project we asked Elbie Henning if we could dedicate a special issue of the South African Journal of Childhood Education (SAJCE) to the research emerging from the project. As the editor she agreed and we asked Nick Taylor (JET) and Thabo Mabogoane (Presidency) to be the guest editors for the special issue. That special issue was published online last week and there is no pay wall (viva open access!). I have included the abstract for each article as well as links to the full text for each one. I would strongly recommend reading Nick and Thabo’s editorial if you don’t have time to read through all the articles. They provide a good overview of the key findings. The research here covers a number of fields ranging from ECD, matric assessment, reading, teachers, principals, and education data.

Editorial: “Policy research comes of age in South Africa” (Nick Taylor and Thabo Mabogoane)

Investment in Early Childhood Development (ECD) has the prospect of cultivating potential within individuals and can assist in bridging the social equity gap from a very young age. Over the past decade Grade R has been the strongest policy lever used by the Department of Basic Education to improve early learning. The National Development Plan calls for universal access to two years of early childhood development prior to entering Grade 1. This paper explores the merits of this proposal, given the specific South African context. More specifically, this analysis intents to bring new information to bear on three matters. The first relates to the demand-side and aims to identify participation trends among four and five year olds. The second objective is to consider the supply-side and aims to understand the policy space in which pre-Grade R will function, the quality and quantity of infrastructure already in place, and the expertise of ECD practitioners. The final question considers the implementation of a universally accessible pre-Grade R within a constrained system and the requirements to ensure that it will have a significant impact on those children most in need.
Much hope is placed on education systems to reduce socioeconomic learning gaps. But in South Africa, uneven functioning of the school system widens learning gaps.This paper analyses education performance using ANA data. Weak calibration and inter-temporal or inter-grade comparability of ANA test scores limit their usefulness for measuring learning gains. However, relative performance provides meaningful information on learning gaps and deficits. A reference group that is roughly on track to achieve the TIMSS average is used to estimate the performance required in each grade to perform at TIMSS’ low international benchmark. By Grade 4, patterns across quintiles of on track performance approximate matric exemption patterns. Viewed differently, academic and labour market prospects may be bleak for children who are no longer on track. Improvement in outcomes requires greater emphasis on the Foundation Phase or earlier, before learning deficits have grown to extreme levels observed by the middle of primary school. This statement is true whether deficits arise from weak early instruction, or simply because a disadvantaged home environment requires early remedial action. The emphasis on the early grades that this analysis of the ANAS suggests is contrary to the conclusions drawn from the ANA results by policy makers, that weak test scores in Mathematics in Grade 9 require major interventions in that grade.
The ability to read for meaning and pleasure is arguably the most important skill children learn in primary school. One integral component of learning to read is Oral Reading Fluency (ORF), defined as the ability to read text quickly, accurately, and with meaningful expression. Although widely acknowledged in the literature as important, to date there have been no large-scale studies on ORF in English in South Africa, despite this being the language of learning and teaching for 80% of ESL students from Grade 4 onwards. We analyze data provided by the National Education and Evaluation Development Unit (NEEDU) of South Africa, which tested 4667 Grade 5 English Second Language (ESL) students from 214 schools across rural areas in South Africa in 2013. This included ORF and comprehension measures for a subset of 1772 students. We find that 41% of the sample were non-readers in English (<40 Words Correct Per Minute, WCPM) and only 6% achieved comprehension scores above 60%. By calibrating comprehension levels and WCPM rates we develop tentative benchmarks and argue that a range of 90-100 WCPM in English is acceptable for Grade 5 ESL students in South Africa. In addition we outline policy priorities for remedying the reading crisis in the country.
This study analyses information and feedback from matriculation level continuous assessment in the South African education system. Continuous assessment (CASS) at the time carried a 25% weight in the final matriculation (Grade 12) mark, and it provides feedback that affects examination preparation and effort. Weak assessment in schools sends wrong signals to students that may have important consequences for the way they approach the final examination. Moreover, similarly wrong signals earlier in their school careers may also have affected their subject choice and career planning. This study compares CASS data to the externally assessed matric exam marks for a number of subjects. There are two signalling dimensions to inaccurate assessments: (i) Inflated CASS marks can give students a false sense of security and lead to diminished exam effort. (ii) A weak correlation between CASS and the exam marks could mean poor signalling in another dimension: Relatively good students may get relatively low CASS marks. Such low correlations indicate poor assessment reliability, as the examination and continuous assessment should both be testing mastery of the same national curriculum. The paper analyses the extent of each of these dimensions of weak signalling in South African schools and draws disturbing conclusions for a large part of the school system.
In the past decade there has been a notable shift in South African education policy that raises the value of school leadership as a lever for learning improvements. Despite a growing discourse on school leadership, there has been a lack of empirical based evidence on principals to inform, validate or debate the efficacy of proposed policies in raising the calibre of school principals. Drawing on findings from a larger study to understand the labour market for school principals in South Africa, this paper highlights four overarching characteristics of this market with implications for informing principal policy reforms. The paper notes that improving the design and implementation of policies guiding the appointment process for principals is a matter of urgency. A substantial and increasing number of principal replacements are taking place across South African schools given a rising age profile of school principals. In a context of low levels of principal mobility and high tenure, the leadership trajectory of the average school is established for nearly a decade with each principal replacement. Evidence-based policy making has a strong role to play in getting this right.
This research makes use of hierarchical linear modelling to investigate which teacher characteristics are significantly associated with student performance. Using data from the SACMEQ III study of 2007, an interesting and potentially important finding is that younger teachers are better able to improve the mean mathematics performance of their students. Furthermore, younger teachers themselves perform better on subject tests than do their older counterparts. Identical models are run for Sub Saharan countries bordering on South Africa, as well for Kenya and the strong relationship between teacher age and student performance is not observed. Similarly, the model is run for South Africa using data from SACMEQ II (conducted in 2002) and the relationship between teacher age and student performance is also not observed. It must be noted that South African teachers were not tested in SACMEQ II so it was not possible to observe differences in subject knowledge amongst teachers in different cohorts and it was not possible to control for teachers’ level of subject knowledge when observing the relationship between teacher age and student performance. Changes in teacher education in the late 1990s and early 2000s may explain the differences in the performance of younger teachers relative to their older counterparts observed in the later dataset.
This paper provides an overview of the various datasets pertaining to education in South Africa that are informing or could inform policy making in education. The paper serves as an inventory for anyone interested in understanding what data is available, how it may be accessed, what the quality of the data is and in what formats it may be accessed. The paper is divided into three parts. The first part provides a description of existing education datasets and the basic data elements contained in each of these datasets. When discussing each of the existing education datasets, the paper addresses the quality of the education data available in South Africa. The first part also refers to the policy implications and the important role that data plays in policy-formulation. No information system on its own is comprehensive enough to provide all the information needed in strategic decision-making. Hence, part two of this paper discusses the need for data integration as an important data management strategy. The third part examines the effectiveness of implementing a learner unit record system nationally in comparison with the EMIS system that is currently in place and that is based on aggregate or summary institution–level data.

______________________________

The full Special Issue can be found here.

Links I liked

listen

  • It is worth reading and re-reading the DBE’s “Second detailed indicator report for the basic education sector” published last year. The infrastructural backlogs in the Eastern Cape particularly are truly unbelievable.
  • The MEC of Gauteng has proposed rotating principals every September in an effort to curb corruption. As a friend of mine said “It takes at least 3 years to find your feet in a new school – this is like school leadership musical chairs. It’s ludicrous.” I agree.
  • New IJER Special Issue on Teacher Rounds, like medical rounds but for teaching practice.
  • Instil Education – a private teacher development startup in SA – are looking for an “Instil Fellow” and a “Director of Teacher Development” – links here.
  • I’m currently reading through one of my masters students dissertations and came across this lovely quote by Martha Nussbaum:
  • “Nothing could be more crucial to democracy than the education of its citizens. Through primary and secondary education, young citizens form, at a crucial age, habits of mind that will be with them all through their lives. They learn to ask questions or not to ask them; to take what they hear at face value or to probe more deeply; to imagine the situation of a person different from themselves or to see a new person as a mere threat to the success of their own projects; to think of themselves as members of a homogeneous group or as members of a nation, and a world, made up of many people and groups, all of whom deserve respect and understanding” – Nussbaum (2006, p.387).
  • I am currently staying with a friend and his family and made a few meals from Nigel Slater’s “Tender: Volume 1” which is lovely. My kind of a cookbook.  Kathleen Alcott captures the appeal in her New Yorker article
  • “Slater is the writer for those of us who have ended up in the kitchen because transforming chopped vegetables and seasoned meats into complex dishes makes us feel that we have acted capably for the sake of our own well-being, and for the well-being of those we love. The hours I spend bent over an evolving meal are, as I believe they are for Slater, a step in the direction of the person I want to be and the home I’d like to have, even if I am frequently not that person, even if I do not come from that type of home. We conceive who we are as we conceive the meal in front of us.”
  • Two documents that will be helpful for those in government and in the NGO world. They are “Database of potential funders for municipalities” and in a different version: Database of potential funders (both from the CSI Trialogue Newsletter)

NEEDU 2013: Moving from Form to Substance (Guest blog post: Gabrielle Wills)

lines

NEEDU 2013: Moving from Form to Substance

Guest blog post by Gabrielle Wills

The NEEDU 2013 report entitled “Teaching and Learning in Rural Primary schools” has finally entered the public domain. Subsequent to the release of the first NEEDU 2012 report, sensational headlines in the press presented certain findings that were isolated from the wider objective of the report. This potentially misrepresented both the objective of the report and the much needed role of NEEDU, which (as its name suggests) is the national evaluator of education. It is no surprise then that the 2013 report has been withheld from public view, delaying constructive dialogue and systems thinking that will emerge out of this insightful material. Compared with the press’ responses to the release of NEEDU 2012, media reporting has been somewhat less damaging in its representation of the findings this time round. However they have still not conveyed the most pertinent messages of the report. This article is intended to direct the reader to the report’s substance.

Before considering the details, a noted conceptual contribution of the report is this: it moves towards being systemic in its evaluative approach, even when considering individual elements that make up the whole. In Lant Pritchett’s book “Rebirth of Education” he draws on Howard Gardener’s (1991) evocative phrase, arguing that we live with an “unschooled mind” about systems. Many activities and research undertaken in the field of education and education economics are modular, focusing on aspects or isolated interventions without considering how these link together within the wider system. NEEDU 2013 moves beyond just a discussion of just individual symptoms of a broken system, of which we are becoming acutely aware (for example poor teaching content knowledge and absurdly low levels of learning in the classroom), getting closer to the institutional inefficiencies that must be addressed before we can move forward.

Much of the discussion of the report is framed under two headings: accountability and instructional leadership. The first is a term with which most economists are well-familiar (and our education system far less so). However the notion of ‘instructional leadership’ is used in the education administration literature, usually in reference to school leaders and the extent to which they organise the school environment to focus on the core business of the school, namely learning. The report extends this terminology to wider administration at the district, provincial and national level to consider that the management of curriculum, assessment and resources will have a strong bearing on learning improvements.

“Instructional leadership may be thought of as the ensemble of processes, operating at different levels of schools, and directed towards leading the system to improved quality (NEEDU 2013, pp 13)”.

One of the most important processes within this ensemble is the management of human resources and particularly the post provisioning process, recruitment and promotion, and professional development. “HR management is the single most important tool available to PDEs (provincial directorates of education) in giving effect to curriculum policy. It provides the tools for the optimal deployment of the costliest and most important resource, educators.” The discussion draws our attention to how provinces have lost control of the post provisioning process, which has the largest budgetary implications for the department (and arguably national spending). The provincial personnel-non-personnel spending split should be 80:20 but has become increasingly skewed towards personnel, impeding on the system’s ability to deliver non-personnel resources to schools.

Screen Shot 2015-12-10 at 4.13.09 PM

Without discipline in spending, the stability of provincial departments to execute functions is severely threatened. This has far reaching consequences for system functionality. It follows that the first three recommendations of the report, and rightly so, are that post provisioning norms and standards need to be unambiguously communicated and applied where strengthening education management information systems aids this process. It also highlights how the process of post provisioning and the recruitment and promotion of personnel must be removed from the influence of the predatory behaviour of organised interest groups.

Strongly related to instructional leadership, the report raises the importance of monitoring and evaluation required within education. However, much of what is being done in this regard takes on a ‘form’ of these things yet lacks any substance. This quotation sums it up well:

“.. in large parts of the system and with respect to a number of instructional leadership processes, both systems management and teachers are going through the motions, with little impact on the objects of their attention… Activity does not necessarily signify progress: there is a great deal of instructional leadership activity throughout the system, but much of it is undertaken at too superficial a level to make any impact on the quality of teaching and learning… If going through the motions is the first step towards effective instructional leadership, then engaging with the substance of the activities is the next (NEEDU 2013, pp 48).”

 This is an acutely important observation. In reading recent Annual Plans and Annual Reports prepared by the DBE there is great deal of activity and forms of monitoring taking place. In many ways, some activities have been admirable and NEEDU 2013 directly acknowledges such successes. Yet many activities are divorced from the objective of improving learning. Consider the following examples:

  • The quality of management in school is being monitored using perfunctory checklists of certain documents such as school improvement plans (SIP) and up-to-date records. But the majority of schools have a SIP and documents can readily be organised and kept up to date even in the presence of incompetent leaders. What is required is hiring the best leaders, on the basis of expertise not years of service or political affiliation. What is required is monitoring their performance using proven instruments of assessment rather than a checklist of activities accomplished.
  • There is no doubt that the introduction of ANA has signalled a major step forward in monitoring whether the system is working. However these are neither standardized tests in the sense that year-on-year comparisons are possible, nor are the majority of schools and districts using these effectively to identify learning gaps. ANA is a form of monitoring yet currently lacks substance in influencing learning or even simply monitoring systemic progress.

While focusing on institutional inefficiencies, NEEDU 2013 does not shy away from obvious problems of addressing teaching in the classroom. In recommendations five and six, the need for a roll-out of a proven reading and writing programme as well as primary numeracy and mathematics programme is expressed. Recommendation nine focusses on addressing teacher proficiencies through educational development, calling for considerable investigation into the teacher education sector and whether it is equipping graduates with necessary competencies. Despite great intentions to improve education and accompanying strategies, it is currently not possible given inherent capacity constraints of both teachers and administrators.

The time of window dressing activities that hide systemic weaknesses has continued for too long. We must move away from forms of activity that mimic best practice while neatly steering away from threatening fundamentals on the surface. Systemic weaknesses must be seen and acknowledged for what they are, and action taken to address them. In this regard, the recommendations of the report should be strongly considered.

________

Gabrielle Wills is a PhD candidate at Stellenbosch University and is part of the RESEP team. Her latest research is titled “A profile of the labour market for school principals in South Africa” which she presented at a conference earlier this year (PPT here).

Assessing oral reading fluency – some resources for teachers and researchers

reading ORF

Over the past year I have been doing some research on oral reading fluency (ORF) with Kim Draper (CDE) and Elizabeth Pretorius (UNISA). The journal article version of my paper with Kim should be available later this month in the SAJCE but you can read a Working Paper version here and the abstract at the end of this post. Lilli and I are in the process of submitting our article to journals so there is no version currently available, but there should be one early next year.

reading fluencyFor those who are unfamiliar with oral reading fluency, it is the speed at which written text is reproduced as spoken language, or put more simply, it is how quickly and accurately you can read aloud. It is one of the components of the “Big 5” which originated in the National Reading Panel in the US. Although this is a fundamental component of reading, it is rarely assessed in South African schools.

The way one usually goes about testing oral reading fluency is to sit down with a student 1-on-1 and ask the student to read a specific passage aloud. While the student is reading the passage the assessor times the reading and also follows the text on her own copy of the passage, marking any errors. At the end of the reading, or after one minute (depending on how one is administering the test), the assessor records the time, totals the number of errors and then can calculate a score called “Total Words Read Correctly Per Minute” or WCPM. This is calculated as the total of all the words in the passage up to where the student was at one minute, and then subtracting the total number of errors to give Words Correct Per Minute. Given that the same passage is used for all students this method creates a measure that is comparable across students or schools.

In 2013 the National Education and Evaluation Development Unit (NEEDU) conducted a study where they tested the oral reading fluency of 1772 Grade 5 students (all English Second Language students) from 213 schools in rural areas. The results of that study can be found here. Kim Draper and Nick Taylor were the lead researchers on this project.

A few days ago a principal from a primary school in South Africa emailed me to ask if there were any books that I would recommend that he reads over the holidays (for those interested I recommended this book and this one). But it reminded me that it would be helpful to post a link to the oral reading fluency assessments that NEEDU used to test the grade 5 students in their 2013 sample. That way other researchers can use the same tools and compare their results to those of NEEDU, and also so that primary school teachers can see how to assess oral reading fluency, with the aim of doing their own oral reading fluency assessments. So here they are 🙂 – all the materials used by NEEDU are available in THIS appendix. That includes the two reading comprehension passages, the questions associated with them and the instructions to the ORF assessors.

For those who want to assess first language English speakers or to assess other grades, I would also recommend looking at the “Florida Assessments for Instruction in Reading: Ongoing Progress Monitoring, Oral Reading Fluency Grades 1-5” which has a number of passages for each grade.

If you’re a teacher or a researcher and have conducted your own oral reading fluency assessments, I’d love to hear about how you did it, what lessons you learned, if the materials are available online etc. Please post any comments or links below.

//

Abstract:

The ability to read for meaning and pleasure is arguably the most important skill children learn in primary school. One integral component of learning to read is Oral Reading Fluency (ORF), defined as the ability to read text quickly, accurately, and with meaningful expression. Although widely acknowledged in the literature as important, to date there have been no large-scale studies on ORF in English in South Africa, despite this being the language of learning and teaching for 90% of students from Grade 4 onwards. As part of the National Education and Evaluation Development Unit (NEEDU) of South Africa, we collected and here analyze data on 4667 grade 5 English Second Language (ESL) students from 214 schools across rural areas in South Africa. This included ORF and comprehension measures for a subset of 1772 students. We find that 41% of the sample were non-readers in English (<40WCPM) and only 6% achieved comprehension scores above 60%. By calibrating comprehension levels and WCPM rates we develop tentative benchmarks and argue that a range of 90-100 WCPM in English is acceptable for grade 5 ESL students in South Africa. In addition we outline policy priorities for remedying the reading crisis in the country.