Shaky data skews literacy results (M&G article on SACMEQ IV)

screen-shot-2016-09-25-at-11-26-28-am

(The article below was published by the Mail & Guardian on the 23rd of September 2016)

Every few years South Africa participates in international tests of reading, mathematics and science in an attempt to see what our students know and can do, and how this is changing over time. These tests are independently set and usually comparable over time. Every 4 or 5 years we test our Grade 9 students in maths and science (Timss) and our Grade 4/5 students in reading (Pirls), and every 6 years we test our Grade 6 students in reading and mathematics (Sacmeq). 2016 happens to be the year when all the results of these assessments are released to the public. The 2015 Timss and Pirls results will be released in November/December this year and the 2013 Sacmeq results were presented to Parliament earlier this month, which is what I will focus on here.

In what would have been the biggest news of the post-apartheid period – at least if it were true – Parliament heard that South Africa’s primary education system improved faster than any other education system in the history of international testing, i.e. since 1967. Our alleged improvement was more than twice as large as the fastest improving country in the world, Brazil. To be specific, South African Grade 6 students’ test scores improved by more than 0.9 standard deviations between 2007 and 2013 or the equivalent of an extra 3 full years worth of learning. To put this in perspective, this is the same as taking Thailand- or Mexico’s education system and making it equal to Finland’s or Canada’s in 6 years. It makes for a great story or a wish from a Fairy Godmother, but not for plausible results from a psychometrically-rigorous international test. Note that it is not only South Africa that experienced these colossal ‘gains’, but all Sacmeq countries, which is even more suspicious. A big part of the alleged Sacmeq improvements actually arise from different methodologies employed in 2007 and 2013, making them incomparable until they are properly equated.

The results presented to Parliament compare data from 2007 and 2013, yet the way these results were calculated in each period was not the same, and I should I know. I was appointed by Sacmeq itself earlier this year to analyse the results for the international Sacmeq report. After analysing the data I raised a number of serious technical concerns about the data that significantly affect the comparability and validity of the findings, and especially the fact that the weaker students had been excluded from the final analysis. I advised the Sacmeq Secretariat to address these concerns before any publication of the results since doing so would be misleading. Based on the subsequent response from the SACMEQ Secretariat indicating that this would not happen I explained that I could not in good conscience continue with the analysis and chose to resign on technical grounds in August this year. The issues I raised have not been addressed since the results presented to Parliament were the same as those that I identified as problematic. At the same time this was going on I emailed the Department flagging my concerns and cautioning against publishing the results.

The Department of Basic Education itself was shocked by the unprecedented improvements. In the presentation to Parliament they explain: “Given the significant improvements, the South African national research team requested SACMEQ to double check the results and were subsequently reassured on their accuracy.” This is simply not good enough.

The lack of comparability between 2007 and 2013 is so glaringly obvious one doesn’t need inside knowledge of the data to see how implausible the results are. At the same time that the student reading scores soared (rising by 0.9 standard deviations), the teacher reading scores plummeted (dropping by 0.8 standard deviations), which is extremely peculiar. If we are to believe the results, by 2013 basically all South African students could read, with illiteracy rates dropping from 27% in 2007 to 3% in 2013. This is totally at odds with the other main international test we do, Pirls in 2011, which showed that 29% of Grade 4 students were reading-illiterate and 58% could not read for meaning, confirming a host of smaller studies showing the same thing.

If we dig a little deeper, the Department’s presentation to Parliament apparently showed that the biggest improvers were Limpopo and the Eastern Cape. Go figure. These are the very same provinces that were placed under administration (Section 100) in 2011 because they were so utterly dysfunctional. To use the Minister’s own words, these are the education system’s “pockets of disaster” whose 2015 matric results were a “national catastrophe.” Yet Sacmeq would have us believe that illiteracy in Limpopo has been totally eradicated, dropping from 49% in 2007 to 5% in 2013. In stark contrast, our other major international test (Prepirls) showed that of the more than 2900 Grade 4 students that were tested in Limpopo in 2011, 50% were reading-illiterate and 83% could not read for meaning.

For those unfamiliar with the norms of psychometrics and testing, it is perhaps helpful to explain by analogy. The scale of the ‘improvements’ in test scores shown in SACMEQ 2013 is tantamount to saying that Usain Bolt and all the other athletes in the race ran the 100m in 5 seconds without ever wondering whether there was something wrong with the stopwatch. The sad thing about all of this is that it does seem that South Africa is really improving – other reliable evidence points to this – but not nearly as fast as the SACMEQ IV test scores would have us believe. According to the presentation, the Sacmeq questionnaire data also encouragingly shows that students’ access to their own textbooks increased substantially over the period from 45% to 66% for reading textbooks and from 36% to 66% for maths textbooks. This is good news.

In the latest turn of events the Department explained that apparently the results presented to Parliament were in fact “preliminary”, that an “extensive verification process” is currently underway, and that it is “fully aware of the issues raised in this regard.” Yet why then did it choose to go ahead and present questionable results to Parliament? Apparently researchers – AKA me – have “mislead the public” and my motives are “unclear.” There is nothing unclear about my motives; there is a major technical concern and the public should not be mislead into trusting these results presented to Parliament. There is also no uncertainty about whether the Sacmeq IV results should have been presented to Parliament. They should not have been presented while there is still so much uncertainty around the comparability of the results, end of story. The Department has been aware of the serious technical concerns around the results for some time now, since I emailed a number of members of the Department’s own research team many months ago drawing attention to these problems and cautioning against publishing any results until they could be rectified.

What I do not understand is why the Department would undermine their own technical credibility by presenting obviously questionable results to Parliament. Personally I would also not be surprised if the Sacmeq data – once comparable – did show an improvement in line with those of other studies. Soon we will also have the Pirls results of 2015 as another data point to verify what is going on. In South African education there is probably already a good story to tell, why muddy the waters by reporting such obviously impossible improvements based on dodgy data? The Department and Sacmeq must make sure the results of Sacmeq 2007 and 2013 are strictly comparable before reporting any further results and causing additional confusion.


Serious technical concerns about SACMEQ IV results presented to parliament

 On the 12th of September the Department of Basic Education (DBE) presented a briefing to the Basic Education Portfolio Committee on the SACMEQ IV (2013) results. This was the first time that these results were presented in a public forum, and the first time that the national average SACMEQ IV reading score (558) and the national average SACMEQ IV mathematics score (587) were presented. The presentation is publicly available here.

I have an intimate knowledge of the SACMEQ IV data given that I was appointed by the SACMEQ Secretariat to analyse the SACMEQ IV data for the international report (date of appointment: 19 April 2016, Purchase Order Number UB-P02016001112, University of Botswana). After analysing the data I raised a number of serious technical concerns arising from the data  that significantly affect the comparability and validity of the findings and advised the SACMEQ Secretariat to address these concerns before any publication of the results (letter dated 26 May 2016). I also emailed the SACMEQ Technical Advisory Committee (9 June 2016) outlining the technical issues. Only one member responded and indicated that the item-response-theory (IRT) analysis should be redone with two independent verification checks. Based on the subsequent response from the SACMEQ Secretariat indicating that this would not happen I explained that I could not in good conscience continue with the analysis and chose to resign on technical grounds (resignation letter dated 7 August 2016).

The principal grounds for my technical concerns and subsequent resignation was the non-comparability of the results between SACMEQ III and SACMEQ IV because of the different methodologies employed when calculating test scores between SACMEQ III and SACMEQ IV, and particularly the fact that weaker students had been excluded from the final results in the process. This does not seem to have been addressed since the results presented to Parliament were the same as those that I identified as problematic.

Unfortunately, the contract that I have signed with SACMEQ prevents me from publishing any results that are based on that data until the international report has been publicly released, at which time I will provide a full account of my technical concerns and reasons for the non-comparability. I have also subsequently deleted the data on SACMEQ’s request.

The Department of Basic Education is already aware of all of my concerns since I emailed a number of members of the Department’s research team drawing attention to these problems and cautioning against publishing any results until they could be rectified. It would seem that the Department has chosen to push ahead and report these problematic results to Parliament in spite of these numerous concerns.

Comments on the SACMEQ IV presentation to parliament:

  • The gains in the SACMEQ reading and mathematics scores between 2007 and 2013 are so unbelievably large that they would make South Africa the fastest improving education system in the world, together with Country 2 and Country 7 (names of other countries were excluded in the presentation to parliament. These countries improved by more than 0.9 standard deviations or 0,13 standard deviations per year. The improvement from 495 to 587 is an 18,5% improvement in test scores (or 2,7% improvement per year). A 2012 study looking at how fast education systems can improve points to Brazil which is the fastest improving education system in any testing system. Yet the SACMEQ IV results presented to parliament would have us believe that South Africa (and Country 2 and Country 7) improved at least twice as fast as Brazil, the fastest improving country. This is extremely extremely unlikely. (It is also unlikely that the teacher test scores have dropped so drastically). We know from other data (such as TIMSS 2003 and 2011) that South Africa has improved in Grade 9 mathematics but this improvement was only half as large as that reported by SACMEQ IV. South Africa’s scores may well have improved between 2007 and 2013 but we cannot say if they have improved or decreased until the results are actually comparable.
  • The fact that teacher test scores plummeted at the same time that student test scores soared should already make us very curious about the technical procedures that might lead to such a situation.

I think the best way forward is for the Department of Basic Education to issue a statement explaining whether they believe the SACMEQ III and IV results are comparable and why and whether these results were based on an earlier version of the data, one which has subsequently changed. And secondly for us to wait for the SACMEQ IV Technical report to be released by SACMEQ so that the procedures, methods and assumptions underlying the SACMEQ IV results can be scrutinised by researchers around the world. This is the reason that the TIMSS, PIRLS and PISA results are all only released at the same time as the full international report.

SACMEQ is an extremely important indicator of changes in reading and mathematics achievement over time. It’s reputation and technical credibility must be upheld for it to retain its position as the main cross-national testing system in the region. To do so, the methods and analysis must be above reproach and open to scrutiny by independent researchers.


Do you know an outlier township/rural school in KZN, LP or GP??

Color pencils representing the concept of Standing out from the crowd


So I have finally taken to crowd-sourcing in my research and I need your help!

Do you know of any ‘outlier’ or exceptional township or rural primary schools in either KZN, Limpopo or Gauteng? Schools that manage to succeed against the odds and achieve great learning outcomes.

In a new ESRC/DFID study we want to understand how these schools manage to get the results they do, and specifically to understand the school leadership and management characteristics in these schools. But first we need to identify these outlier schools. We’re trying a number of different approaches to identifying these schools and then triangulating the results.

So word or mouth or your first-hand experience with an exceptional township/rural school could really help us. If you have any suggestions please send me an email at NicholasSpaull[at]gmail.com with the name of the primary school and why you think it’s an outlier school and any contact info if you have it!

Looking forward to hearing from you!!

Nic

21st Century Skills: MakerSpace

fablab_news

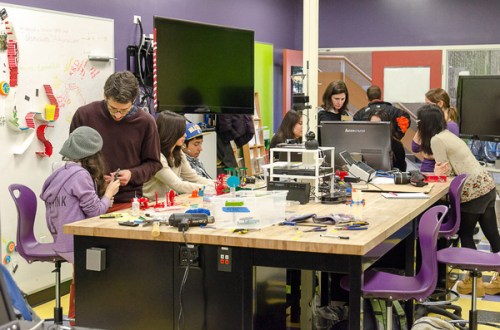
If you’re interested in 21st Century Skills (like Creativity, Collaboration, Critical Thinking, Communication), you should be looking into MakerSpace which now has a branch in Durban 🙂 The aim is a kind of ‘make it yourself’ drive, and helps by providing the skills, tools and training to do it. For education this might be about 3D-printing, or how to use and program an Arduino, or Robot Making (see pamphlet below). This reminded me of Stanford’s FabLearn Labs which works on a similar logic (the photo above is of a FabLearn Lab). If your school can afford these types of courses I would strongly recommend moving in this direction…

School programmes

Screen Shot 2016-07-29 at 11.51.20 AM

You can find out more here – http://themakerspace.co.za/

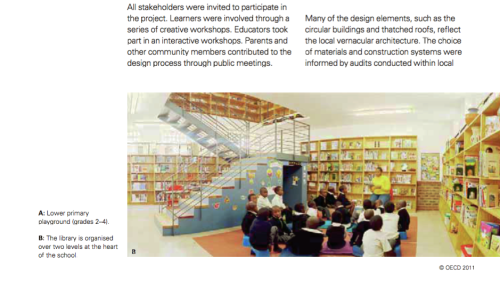
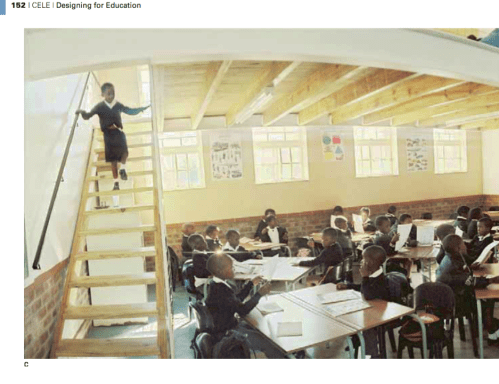
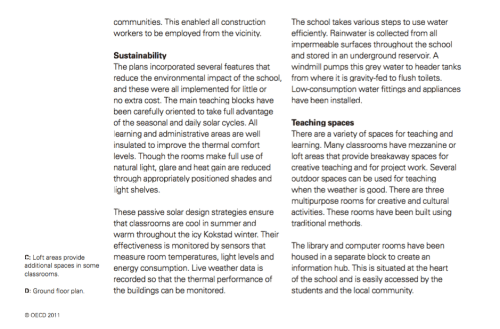
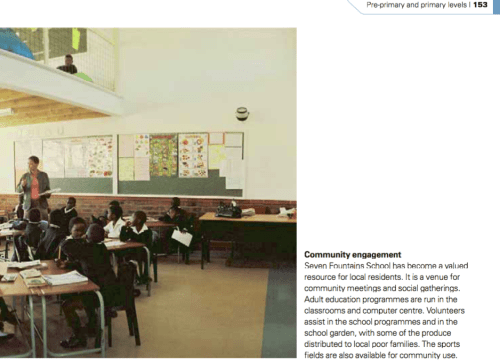
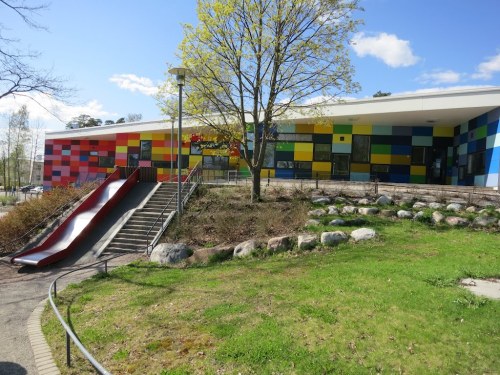
Exemplary school design: Seven Fountains Primary School (Kokstad)

Screen Shot 2016-07-28 at 1.37.54 PM

Screen Shot 2016-07-28 at 1.38.07 PM

Screen Shot 2016-07-28 at 1.38.22 PM

Screen Shot 2016-07-28 at 1.38.33 PM.png

Screen Shot 2016-07-28 at 1.38.44 PM

Screen Shot 2016-07-28 at 1.39.01 PM

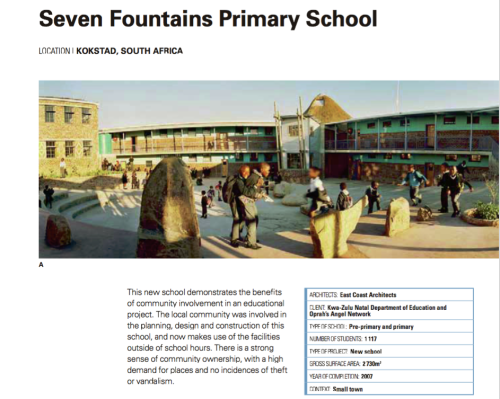
The above was one of the case studies featured in”Designing for Education” – a publication by the OECD (2011). More information about the design of this school can be found here and here.

What makes a school really great? [Guest blog post: Gabi Wills]

school

What makes a school really great? Those first impressions that count” – Dr Gabi Wills

Curriculum coverage? Teacher motivation? Print-rich environments? Learning goals and targets? These are a few of the things that I see as important as I have looked through mounds of literature on what makes an effective school. Together with a team of education experts we are preparing to engage in research in schools in South Africa in township and rural areas that exceed despite the odds. In preparation we are having to think hard and fast about questionnaires to capture what it is that separates these schools from the rest. Most of the time this can be a surprisingly difficult task. In post-Apartheid South Africa there have been numerous studies on schools where data is captured on indicators of school functionality. Using our fanciest modelling, we then try and see which of the many indicators of observed factors explain why certain schools do better than others. But most of the time we simply can’t explain the variation in learner performance that we observe across schools, particularly in the majority of poorer schools in the system. I am however starting to wonder if we simply have not measured effectively the things that really count.

As academics we tend to limit ourselves to our peer-reviewed readings, to our computer screens and the occasional conference. But we miss too many opportunities for the ‘aha’ moment when it all comes together. Increased burdens of work limit time to experiment and explore. Well at least for me. After feeling unusually disimpassioned and just wearied by just too much information, today I did something different but obvious. Rather than running off to the office and opening my computer, I started my day in the reception of a great preparatory school in Durban. I sat and observed. I started reading the display books on the reception table, observed the honour boards proudly displayed, watched teachers coming in and out and hearing in the background the sound of children vocalising their prose for the next drama production. After 60 minutes of this, and particularly reading an inspiring 2010 prize-giving speech of the headmaster in one of the coffee table books, things were becoming clearer. Before I even got to the classroom, I realised that great schools do this:

  • They celebrate their history – no matter how small or great. Equally they dream about the future. As read in one of the headmasters prize-giving speeches (also documented) there is “a deep affectionate respect for folk who have gone before”. When history has not been particularly becoming, they consider how they learn from this and how obstacles were overcome.
  • They celebrate excellence. Even the smallest achievement of present and past students is meticulously documented and preserved that all who visit can see. The annual prize-giving is a revered and celebrated event. Photographs of awards and those awarded take centre stage.

But you are probably wondering why these two features (past history, past achievement) matters for the now? The importance of this extends beyond school pride, it legitimises the worth of the institution beyond one individual. Great people create great institutions with a reason for existence beyond their founders. Moving on, great schools….

  • Are intentional about cultivating school pride. In just this reception area, school pride emanates from every intentionally displayed item on the walls, in the greeting of the security guard to the glow from the weekly polished floors. School logos, obviously displayed school songs and mottos are evident. Children don’t just come here to learn. They find a sense of a belonging in an organisation with its own unique character which parents have strategically worked at crafting with the school staff over decades.
  • They treat discipline and manners among children as non-negotiable inputs and outputs of the schooling process. I was greeted with respect by even the littlest grade Rs who politely stood aside and smiled as they did. Where the banter of naughty children is heard, the voice of disciplinary teacher towers louder. It’s clear who is in control.

These are just four observations before I have even spoken to a single person. Moving on to meeting two principals in the school…

  • Respect for teachers, visitors, cleaning staff and the security guard is evident from leaders in this institution. Despite the hassle I present, I am given a tour of classrooms, cupboards, facilities and libraries as two principals enthusiastically express why and how they do things around here. The cleaner is introduced as a fellow colleague.
  • Leaders have intentionally hired the right people (of course in this case they have the privileged control over hiring with lots of SGB paid teachers they can afford). The principal talks about each teacher as a “leader”, “striving relentlessly”, “passionate” and “dedicated.”
  • The economist in me can’t help but ask a few monetary related questions and it’s obvious that there are well-proven financial structures in place. This school doesn’t miss a beat when it comes to the financial operations it requires to keep this ship moving. This is where parents with financial skills come in and are drawn upon for their expertise. The principals I speak to are exactly aware of how much this ship requires, where it requires resources and if anything is ever left over.
  • Teachers have a sense of mastery of the curriculum and are acutely aware of where it can be altered or adapted to better the learning opportunities for their students without stepping beyond CAPS learning requirements. Official workbooks are only used if a more suitable option for their students is not available (and positively at times the workbooks are often considered the best option).

After just 2 hours, I think I have got clearer what my next questionnaire needs to be about and probably saved myself two day of agonising thinking. For all our studies after just bumbling along as a regular person I come that much closer to realising what matters, what separates out the average school from the great. I suspect I have just observed what every interested parent or teacher has known all along.

//

One of Gabi’s recent Working Papers on principal leadership changes in South Africa is available here.

Recruiting 12 fieldworkers for our ESRC study :)

help

Fieldworkers required: Research on Socio-Economic Policy (ReSEP), based in the Economics Department at Stellenbosch University, has embarked on a research project focussing on exceptional township and rural primary schools in three provinces in South Africa. ReSEP plans to recruit 9 experienced fieldworkers to assist them with school-based research.

Job description: Fieldworkers

Periods of work: Early October 2016 with an option to renew for forthcoming fieldwork

Overall period of fieldwork: Early October 2016, February/March 2017, September/October 2017

Daily rate for fieldwork: R800 per day with R100 per day subsistence allowance

Daily rate for training: R450 per day

Description of the project: The main aim of the research is to better understand why some schools perform better than others specifically in township and rural areas. We will develop a new survey instrument that captures the actual practices and behaviours of teachers and principals in challenging contexts.

This will be done where each exceptional school is paired with a nearby ‘typical’ school, i.e. one with similar geographical and socioeconomic characteristics.

The study will be conducted in various phases from May 2016 to September 2018 in 60 schools across the Western Cape, KwaZulu-Natal and Limpopo provinces. This advert is based on fieldwork for the first phase, piloting the various research instruments in three schools per province, this may however be extended to the subsequent data collection phases (February and October 2017) based on fieldworker performance and availability.

Fieldworkers will be required to

  • interview school principals and teachers using quantitative instruments;
  • conduct reading and vocabulary tests with young children;
  • conduct assessments of classrooms and learner workbooks;
  • provide informative insights into the school environments they visit.

Minimum requirements: 1) A bachelor’s degree (although in exceptional cases 3 year diploma’s also considered) 2) Fluency in reading and writing in English as well as one of the three following languages: Sepedi, isiZulu or IsiXhosa

Preference will be given to individuals:

  • with previous research experience particularly from academic disciplines such as linguistics, psychology, teaching and education research. Although other background disciplines will also be considered.
  • with a valid driver’s license and regular driving experience.  with a research interest in the project.
  • who live in the province in which they are surveying schools (i.e. Limpopo, Western Cape or KwaZulu-Natal).

Qualities:

Ideal candidates should possess the following qualities:

  • Integrity and honesty
  • Organised with the ability to plan effectively
  • Confident and professional
  • Good interpersonal skills
  • Works easily in a team
  • Enjoys working with children
  • Takes initiative to solve problems as they arise
  • The ability to objectively observe an environment without influencing how it functions.
  • The ability to articulate clearly in language and writing your observations.

Required time commitments:

  • 2016: Early October 2016 (6 days). 2 days compulsory training. 3-4 days pilot fieldwork.
  • Working hours in field: 6.30am/7am start to be at a school by 8am depending on travel distances. 8 hour working day. Each fieldworker will be expected to verify the GPS location/address of the piloting schools prior to the field visit. Late arrivals will not be accepted as this will jeopardise the completion of data collection.
  • Important note: Fieldwork will likely involve being away from home Monday to Friday (given that schools may be located very far from central hubs) and will potentially require driving to required areas on a Sunday to be able to start fieldwork promptly in schools on a Monday morning. All travel arrangement, logistics and accommodation will be arranged through ReSEP, however it is the responsibility of each fieldworker to verify the suitability of the arrangement.

Application:

12 shortlisted candidates will be required to attend training at a central location where 9 fieldworkers (3 per province) will be chosen from the most suitable candidates identified. All shortlisted candidates will be compensated the daily rate of R450 for the duration of the training.

If you are interested in applying for the position please send to mschreve@sun.ac.za by Mon. 8 August 2016

i) Your CV. Including two references.

ii) A short written piece (500 word limit) on what characteristics/features in your opinion distinguish a school as being better than others. The piece must be written in English and in one of the three following languages: Sepedi, isiZulu or IsiXhosa.

iii) A covering letter. In your covering letter please explain why you think you would be a good match for this position. In the subject line please include: “Application: ESRC fieldworker.”

The University reserves the right to investigate qualifications and conduct background checks on all candidates. Should no feedback be received from the University within four weeks of the closing date, kindly accept that your application did not succeed.

Links I liked :)

Screen Shot 2016-07-16 at 5.02.02 PM

Some things I’ve been reading:

New Research:

This article reports on a two-year evaluation of the Gauteng Primary Language and Mathematics Strategy (GPLMS), an innovative system-wide reform intervention designed to improve learning outcomes in Gauteng Province, South Africa. Using data from universal testing of all learners in 2008 on a provincial systemic evaluation, as well as data from the 2011, 2012 and 2013 Annual National Assessment tests, this article investigates whether or not the GPLMS improves the numeracy skills of learners in early-grade mathematics in underperforming schools. Using as identification strategy, the natural experiment that resulted from a miscalculation of the provincial systemic evaluation test scores in 2008, which had been used to assign schools to the GPLMS intervention, the study shows that the GPLMS intervention is positively associated with improvements in early-grade mathematics performance of schools in the neighbourhood around the assignment threshold. The findings of the study contribute to the growing body of knowledge that shows the effectiveness of combining lesson plans, learner resources, and quality teacher capacity building.

Sci-Hub–>Knowledge moves forward :)

sci-hub

I haven’t been blogging for a while for a couple of reasons. I’ve moved to the OECD in Paris for the TJA Fellowship and will be here until the end of August. I’m working on PISA data in middle-income countries and finding some really interesting results – working paper(s) should be done by the end of the year and I’ll be back in South Africa mid-September.

In the last few months it feels like the world became a much more interesting and scary place than it was this time last year. Apart from things like Brexit and Trump, there’ve been terrorist attacks around the world showing how vulnerable big cities are (even in wealthy countries) to very small groups of people with bombs and guns. In the last two days there has been a terrorist attack in Nice (France) and yesterday a failed coup in Turkey. So I think I’ve been running low on good news for a while. Then I was reminded of Sci-Hub, which is kind of the Naptster/PirateBay of academic publishing. If you know the DOI (document object identifier) or the journal name you can usually find it on Sci-Hub. It was founded by a 22 year-old graduate student from Kazakhstan, Alexandra Elbakyan. The site provides up-to-date access to 50 million articles. In February 2016 alone there were 6 million downloads. Providing access to the world’s academic knowledge to anyone with an internet connection is absolutely amazing. It’s also something that one of the Internet’s geniuses, Aaron Swartz, seemed to be planning before his untimely death (suicide). Millions of people (myself included) have access to online journal articles, primarily through institutional access arrangements (typically universities). Having such a distributed network of people, all of whom have access means that something like this was bound to happen and is impossible to prevent. Much like downloading pirated movies or music which are here to stay. This is creative disruption in its purest form.

I think Alexandra is a hero and that Sci-Hub is here to stay. It’s bull-shit to argue that the peer-review process depends on 37% profit margins (Elsevier) or heavily gated elite journals. The logic that we must conduct research using tax-payers money, then submit and review the articles for free but that we must pay to get access to those articles is totally antiquated and perverse. This also explains why countries (such as the US) and donors (such as the Gates Foundation) are requiring that research that they fund be made available online within a year of completion.

Onward and upward…

Gabi Wills on the overprioritisation of matric

dilbert

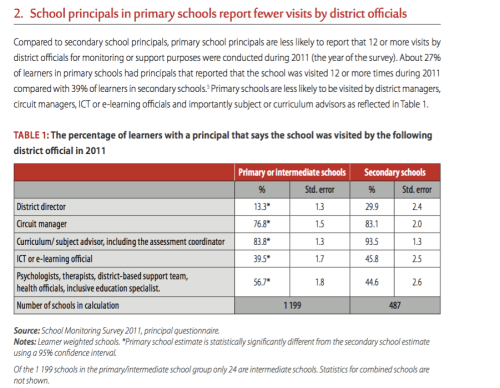
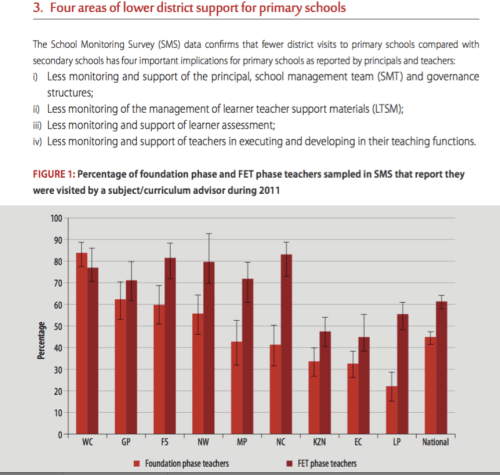
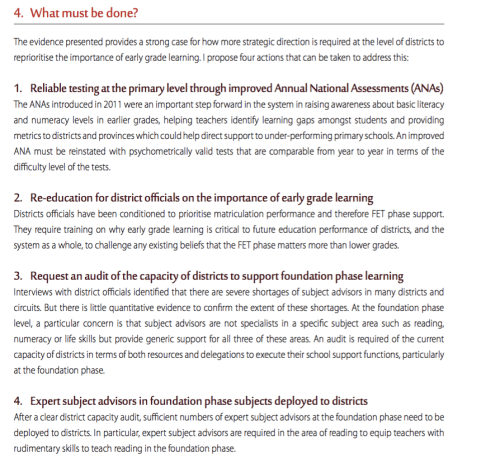
In her latest policy brief, my friend and colleague Dr Gabi Wills discusses the overprioritisation of matric/high-schools and the underprioritisation of Foundation Phase (Gr1-3) and primary schools. The full policy brief is here. She finds that high school principals are significantly more likely to have been visited by a dsitrict official than a primary school principal, leading to lower monitoring and support at this critical phase. The need to prioritise the Foundation Phase and reading specifically was the main conclusion from two major research projects that we have just finished (see here). Until we realise that we will win or lose the battle of improved educational outcomes for the poor in the primary school, and specifically in Grades 1-3, then we are doomed to go around this mountain one more time!

I include some excerpts from the policy brief below:

Screen Shot 2016-06-07 at 12.32.23 PM

Screen Shot 2016-06-07 at 12.33.00 PM.png

Screen Shot 2016-06-07 at 12.34.06 PM

I’ve moved to the OECD in Paris :)

pariss.jpg

I have now moved to Paris to work at the OECD for my TJA Fellowship on PISA data in developing countries. This is essentially an extension of my work on SACMEQ/PASEC and DHS, trying to combine surveys of achievement and attainment to get a composite measure of education system performance.  While I’m away I won’t be commenting as regularly on SA education issues as I usually do. And I will probably shift my focus to other developing countries which is the topic of my research at the OECD. I have already found a number of fascinating things about some PISA countries which I don’t think are widely known or fully appprecaited. There is more than enough included in my previous blog post (11 policy briefs, two synthesis reports and a 200+-page special issue of the SAJCE), not to mention the Volmink Report, for the media and policy-makers to focus on for the next 2 years, let alone 3 months. Keeping up with the nitty-gritty doesn’t make much sense when the underlying issues are not being addressed or taken seriously.

To be honest I’m quite glad to be taking a break from South African education and working on PISA and learning about PISA-for-Development. Clear outcomes, a competent team, and political will. That’ll be nice 🙂

Binding Constraints in Education

psppdcover

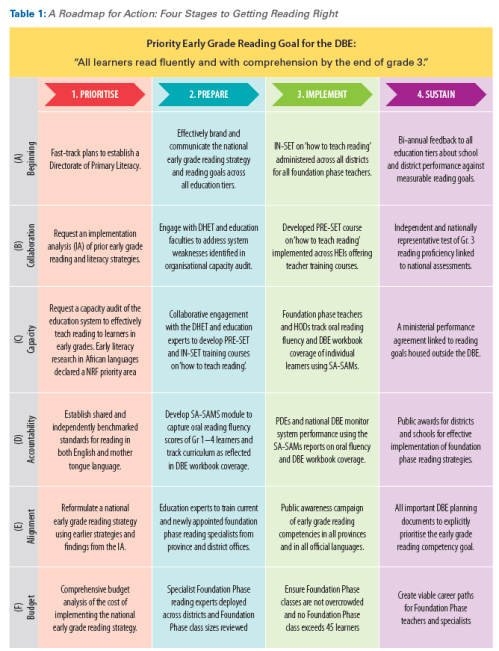
For the last two years we at RESEP have been working on two major education projects: The “Binding Constraints” project (Presidency/EU) and the “Getting Reading Right” project (Zenex Foundation). We launched the two reports on Tuesday last week (my presentation is here). Included below are the two project synthesis reports, a detailed outline on a prospective course (which needs a funder) on “Teaching Reading (& Writing) in the Foundation Phase” and 11 policy briefs. I’ve also included the “Roadmap for Reading” which provides a detailed outline of the practical steps that the Minister of Education could take if she wanted to prioritise reading in the Foundation Phase.

Projects:

  1. Identifying Binding Constraints in Education (V2) [Errata from V1 here]
  2. Laying Firm Foundations: Getting Reading Right
  3. Teaching Reading (and Writing) in the Foundation Phase: A Concept Note

Policy Briefs:

  1. Increasing the supply of teacher graduates
  2. Education datasets in South Africa
  3. Rethinking pre-grade R
  4. Is school based assessment in matric achieving its potential?
  5. Improving the calibre of school leadership in South Africa
  6. The DBE’s workbooks as a curriculum tool
  7. Adding randomised control trials (RCTs) to the education research toolkit
  8. What the ANAs tell us about socioeconomic learning gaps in South Africa
  9. Learning to read and reading to learn
  10. Excessive class sizes in the Foundation Phase
  11. Building an evidence base for inclusive education in South Africa: Focusing on learners with disabilities
  12. Limited support for the Foundation Phase: A Misallocation of district resources

reading right

All of the above are also available on the RESEP website here. The 2015 special issue of the South African Journal of Childhood Education (SAJCE) where most of the research was published is available here (ungated) for those who would like to read the full journal articles.

The presentations from the event are available here:

(I would especially encourage everyone to read through Servaas’ and Gabi’s presentations, they were exceptional!)

There is obviously a lot to be said about these two projects, some of the new research points to very tangible, actionable steps to improve the education system, decrease inequality in outcomes and arguably create a fairer and more efficient education system. Yet it is not at all clear that any of these suggestions will be followed. It was unfortunate that neither the Director General nor the Minister were able to make the report launch. I am aware that both have very busy schedules and that a lot has been happening in education in the last few months. I hope that Servaas will have an opportunity to present this research to them in the coming months. I have also been underwhelmed by the online coverage of the research.

I deliberately do not want to write about the research now since I am currently a little jaded and frustrated about the education research, funding and policy space (perhaps you can tell!). When there are clear, unambiguous and actionable steps that could be taken to improve the education system and they are not taken, this is frustrating. When funders choose to channel millions (billions?) of rands in fruitless directions toward unevaluated projects, it is frustrating. When clear priorities and needs are ignored by national government and local funders (like developing a high-quality course to teach foundation phase teachers to teach reading!), it is frustrating. And perhaps most frustrating of all is the large number of people in provincial and national government that are unable to do the jobs that they have been appointed to do. While there are a number of dedicated and competent public servants and politicians in education, the way that our system is set up means that they have to rely on people who cannot do what they are being asked to do. Those people need to be trained quickly or performance-managed out of the system. That will take courage, strategic leadership and a clear understanding that the status quo is preventing poor children from quality education. Indeed “Weak institutional functionality” or “Insufficient State Capacity” was one of our four binding constraints. Go figure.

Jobs-For-Cash report *FINALLY* released

corruption

The Ministerial Task Team Report into the sale of posts – colloquially referred to as the Jobs-for-Cash report has finally be released by the DBE. Full report HERE. The report is far-reaching, frank and damning. We all owe a huge thanks to Professor Volmink and his team for their investigation and this much needed report. When corruption is so systemic, as it is in SA education, to write a report like this without fear or favour is the mark of a deep conviction that something has to change.

I have taken out a few excerpts for those who don’t have time to read the whole (285-page report:

  • “All the Deputy Directors-General in the Department of Basic Education are SADTU members and attend meetings of that Union. (p93)
  • “The Gauteng MEC said that “the major Union is in charge of education” in his Province” (p.81)
  • HOD North West – “He said that his Department has so many cases of wrongdoing that if he asked the SAPS to follow them up, it would amount to closing down the Department. ” (p87)
  • “Of the 81 cases that were investigated, 38 cases provided grounds for either reasonable suspicion requiring further investigation or point directly to wrongdoing amounting to criminal conduct. (Reasonable suspicion exists when there are objective grounds or empirical facts that form the basis for the suspicion as opposed to mere conjecture.) “ (p18)
  • North West – “When the claims were made in the City Press in April 2014, the NWDOE appointed a forensic company to investigate the claim that SADTU had influenced the appointment of senior officials in the provincial department. The report, dated 15 August 2011, was made available to the MTT. Further investigation by the MTT indicates that in 9 cases investigated by the forensic investigative company, there was no evidence to support the allegations in 2 cases. However in 6 cases SADTU officials or representatives exerted improper influence; however is no evidence of money being involved. In one case, a senior district official acted improperly in support of the promotion of a friend. In none of the cases was action taken in respect of the findings.“ (p20)
  • Gauteng – “Following claims made in City Press in May 2014, The GDE acted promptly and appointed a firm of attorneys to investigate the claims of improper influence at school level. The detailed report included information from both written and verbal statements and concluded, inter alia, that posts are being sold for cash, that the parties operate in networks, and that there is a climate of fear that keeps people from exposing these practices. The GDE then moved to take disciplinary action, but the majority of witnesses did not wish to give signed statements.This outcome is unacceptable as in this case there is evidence that a network exists that is selling posts for cash. Steps need to be taken to support the individuals who were willing to take the risk of speaking. This requires further investigation by a competent authority. It is not acceptable that a teacher who is courageous enough to report alleged corrupt acts was told must be told to go to her local police station. This cannot be acceptable. In several cases where teachers and other informants have acted with enormous courage to report gross abuse no action has been taken.” (p20)
  • “RECOMMENDATION 4: That the Department of Basic Education regain control of administering the education system in all Provinces so that clear distinctions are established between the roles and functions of the DBE and the concerns of Teacher Unions.” (p21)
  • “The deployment of officials to the Department from Unions weakens the Department because those so deployed often struggle to demonstrate that they are able to balance the complexity of competing loyalties and demands.” (p25)
  • “RECOMMENDATION 10: That both school- and office-based educators cease to be office- bearers of political parties and that educators in management posts (including school principals) be prohibited from occupying leadership positions in Teacher unions.” (p25)
  • “If ‘undue influence’ (a polite name for corruption) is a result of cadre deployment, then cadre deployment is likely to lead to corruption. It is the impression of the Task Team that such corruption is endemic to greater and lesser degrees in the entire education system and that as a first move to cleanse the system, cadre deployment should not be permitted.” (p25)
  • “RECOMMENDATION 15: That the South African Council of Educators (SACE) be reconceptualised and freed from Union and political domination.” (p28)
  • “All the Deputy Directors-General in the Department of Basic Education are SADTU members and attend meetings of that Union. That being the case, it is not improbable to say that schooling throughout South Africa is run by SADTU. The significance of cadre deployment in South Africa’s education system is discussed below in Chapter Four.” (p93)
  • “Early in May, the North West’s Deputy HOD was held hostage overnight by SADTU officials over the unresolved matter of temporary teachers.” (p.82)

Some media reports are starting to emerge in Times Live and Citizen but it will be interesting once the journalists and commentators get their teeth into the detailed report.

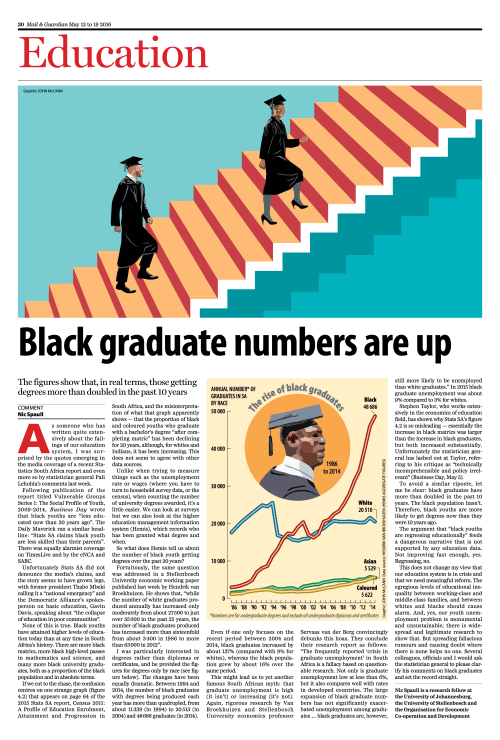
My M&G article responding to the Statistician General

Spaull M&G 13 May

This was first published in the Mail & Guardian on the 13th of May 2016. The PDF of the article is also available as text below:

Black graduates have doubled in last 10 years – Dr Nic Spaull

As someone who has written quite extensively about the failings of our education system, I was unusually surprised by the quotes emerging in the media coverage of a recent Stats SA report and even more so by the Statistician General Pali Lehohla’s comments last week. Following publication of the report, titled “The Social Profile of Youth”, the Business Day was quick to inform us that apparently black youth were “less educated now than 20 years ago.” The Daily Maverick ran a similar headline: “Stats SA claims black youth are less skilled than their parents”, with equally alarmist coverage in Times Live, ENCA, SABC etc. Unfortunately StatsSA did not denounce the media’s claims. The story seems to have grown legs, with former president Thabo Mbeki calling it a “national emergency” and the Shadow Minister of Basic Education speaking of “the collapse of education in poor communities.”

Of course none of this is true. As we shall see, Black youth have higher levels of educational attainment today than at any other point in South Africa’s history. There are more Black matrics, more black high level passes in mathematics and science, and many more Black university graduates. (Note that this is both as a proportion of the Black population and in absolute terms). In this article I will focus on black university graduates since everyone agrees that there have been large increases in black youth passing matric and achieving bachelor’s passes.

If we cut to the chase the confusion all centres on one strange graph (Figure 4.2) appearing on page 64 of the 2015 Stats SA report “Census 2011: A profile of education enrolment, attainment and progression in South Africa” and the misinterpretation of what that graph apparently shows. That graph shows that the proportion of black and coloured youth that graduate with a bachelor’s degree “after completing matric” has been declining for 20 years, while for whites and Indians it has been increasing. This is very strange and does not seem to agree with other, perhaps more reliable data sources. Unlike when trying to measure things like the unemployment rate or wages (where you have to turn to household survey data or the Census), when counting the number of university degrees awarded it’s a little easier. We can look at surveys, but we can also just look at the Higher Education Management Information System (Hemis) the record-keeping system stating who has been granted what degree and when. All degrees that are granted must be recorded on this database. So what does Hemis tell us about the number of black youth actually getting degrees over the last 20 years?

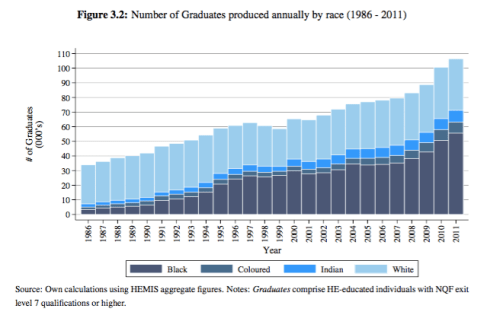
Fortuitously, this exact question was addressed in a Stellenbosch Economic Working Paper (08/16) published last week by my colleague Dr Hendrik van Broekhuizen. In that paper he shows that “while the number of White graduates produced annually has increased only moderately from about 27 500 to just over 35 000 in the past 25 years, the number of Black graduates produced has increased more than 16-fold from about 3 400 in 1986 to more than 63 000 in 2012.” For this article I was particularly interested in degrees rather than diplomas or certificates) and he kindly provided the figures for degrees only by race (see figure below). The changes have been equally dramatic. Between 1994 and 2014 the number of black graduates with degrees being produced each year has more than quadrupled, from about 11,339 (in 1994) to 20,513 (in 2004) to 48,686 graduates (in 2014). Even if one only focuses on the recent period between 2004 and 2014 Black graduates increased by about 137% (compared to 9% for whites), while the black population grew by about 16% over the same period.

This might lead us to yet another famous South African myth; that graduate unemployment is high (it isn’t) or increasing (it’s not). Again, rigorous research by Dr Van Broekhuizen and Professor Servaas van der Berg convincingly debunks this hoax. They conclude their research report as follows: “The frequently reported ‘crisis in graduate unemployment’ in South Africa is a fallacy based on questionable research. Not only is graduate unemployment low at less than 6%, but it also compares well with rates in developed countries. The large expansion of black graduate numbers has not significantly exacerbated unemployment amongst graduates….Black graduates are, however, still more likely to be unemployed than white graduates.” (Note: in 2015 black graduate unemployment was about 9% compared to 3% for whites.) [Their extended article is here]

 Another colleague of mine, Dr Stephen Taylor in his response to the Statistician General (Business Day, 29 April) has shown why Stats SA’s Figure 4.2 is so misleading (essentially the increase in black matrics was larger than the increase in black graduates, but both increased substantially). Unfortunately the SG has simply lashed out at Dr Taylor referring to his critique as “technically incomprehensible and policy irrelevant” (Business Day, 5 May). To avoid a similar riposte let me be clear: Black graduates have more than doubled in the last ten years. The black population hasn’t. Therefore, black youth are more likely to get degrees than 10 years ago. I think this is both technically comprehensible and policy relevant.

The argument that “black youth are regressing educationally” feeds a dangerous narrative that is not supported by any education data in South Africa. Not improving fast enough, yes. Regressing, no. Black youth have higher educational attainment now than at any point in South Africa’s history. This does not change my firmly held view that our education system is in crisis and that we need meaningful reform, that goes without saying. The egregious levels of educational inequality between working class and middle-class families, and between whites and blacks should cause alarm. And yes, our youth unemployment problem is monumental and unsustainable; there is widespread and legitimate research to show that. But spreading fallacious rumours and causing doubt where there is none, helps no one. Together with a number of colleagues and officials I would ask the Statistician General to please clarify his comments on black graduates and set the record straight.

//

Dr Nic Spaull is a Research Fellow at the University of Johannesburg, the University of Stellenbosch and the OECD.  

Workings for graphs (thanks Hendrik van Broekhuizen!)

Year Black Coloured Asian White
Y1986 2957 1131 1532 17601
Y1987 3153 1280 1692 19064
Y1988 3546 1349 1771 20494
Y1989 4043 1760 1930 21613
Y1990 4862 1958 1975 22747
Y1991 7115 2230 2170 23800
Y1992 8130 2270 2363 24901
Y1993 8661 2392 2621 24571
Y1994 11339 2127 3023 25538
Y1995 13123 1833 2506 16885
Y1996 15781 1785 2479 16363
Y1997 17367 1869 2713 16385
Y1998 17181 1949 2796 15650
Y1999 19093 1785 2175 15410
Y2000 20379 1909 3193 15896
Y2001 17017 1913 3430 16017
Y2002 16222 2075 3712 17094
Y2003 17234 2322 3776 17948
Y2004 20513 2640 4307 18757
Y2005 21052 2916 4505 19860
Y2006 22508 3097 4805 20732
Y2007 23356 3480 4840 20522
Y2008 25373 3677 4984 20482
Y2009 27869 3866 4774 20555
Y2010 31453 4366 4690 20456
Y2011 34209 4456 5109 20248
Y2012 40001 4778 5089 20303
Y2013 45948 5291 5748 21548
Y2014 48686 5622 5529 20510

*These include the following: General Academic Bachelor’s Degree; Professional First Bachelor’s Degree; Baccalaureus Technologiae Degree; Professional First Bachelor’s Degree; First National Diploma (3 years); First National Diploma (4 years)

Figures refer to the number of HE awards and will thus be at least as large as the number of graduates produced in each year. Includes only undergraduate degrees. (Thus excludes all UG   diplomas, and certificates

Response to the Statistician General – Dr Stephen Taylor

cat-op-ed

[Guest post – Stephen Taylor]

The Statistician General (SG) recently responded to my letter to the Business Day. A full version of what I have written is available here. I would simply reiterate what I wrote initially. In brief:

Numerous newspapers and media outlets were running with headlines such as “Black youth less educated now than 20 years ago” (Business Day) and “Stats SA claims black youth are less skilled than their parents” (Daily Maverick). The articles were referencing a recent Stats SA report as well as comments made by the SG.

My position is simple: These claims are factually incorrect and Stats SA reports and data do not actually say this. Note that I did not “adjudge a mistake” in the actual Stats SA report. I do not know exactly what the SG said at the release, which may have lead the media to run with the headlines they did, but I speculated about what I thought might have been causing the confusion.

The SG’s response has confirmed that I was right about what had caused the confusion. He had in mind a very specific “progression ratio” – the ratio of degree graduates to matriculants. This ratio may have been decreasing for black and coloured youth, but this is simply because the increase in degree graduates has not kept pace with the increase in matriculants. Importantly, both the likelihood of achieving a matric and the likelihood of achieving a degree have been fast increasing, especially for black youth. This means it cannot possibly be true that black and coloured youth are worse off educationally than their parents, which is the message the media were propagating. None of the media reports said anything about this “progression ratio” which the SG has now referred to. Instead the media were reporting that lower proportions of the entire black and coloured population were attaining a degree. And that isn’t true.

According to Higher Education data, the number of black degree graduates per year has increased more than four-fold from 11 339 in 1994 all the way to 48 686 in 2014.[Note: New SU Working Paper published by Hendrik van Broekhuizen last week on this topic]. This is much faster than population growth. For white youth, this number has essentially remained flat at roughly 20 000 graduates per year. Of course there is still a lot of inequality – these numbers mean whites are still about 6 times more likely to attain a degree than black youth.

This “progression ratio” may have some analytic value, as the SG points out. For example, it may reflect a greater policy prioritisation of secondary education relative to higher education. But this indicator must be clearly explained and it also has its limitations. I cannot imagine anyone celebrating improved educational outcomes if the numbers of black and coloured youth attaining a degree had gone down, while the numbers attaining a matric had gone down even faster, leading to an increase in the degree-to-matric progression ratio!

I know progress hasn’t been as fast as we need. But it is far from the truth to suggest educational outcomes have regressed.


Black graduates: 3 400 in 1986… 55 600 in 2011. Enough said :)

On the topic of the change in the number of black African graduates over the last twenty years (and the recent media hype) this study by my colleague and friend Dr Hendrik van Broekhuizen  is all that needs to be said:

Screen Shot 2016-05-03 at 4.23.24 PM

“In addition to the expansion of South Africa’s yearly graduate outputs, the nature of the policy changes which have affected the HE system over the past 25 years means that the demographic composition of South Africa’s stock of graduates has also changed radically over time. This is clearly evident when looking at changes in the racial composition of the graduates produced by the HE system each year. Figure 3.2 reveals that, while the number of White graduates produced annually has increased only moderately from about 27 500 to just over 35 000 in the past 25 years, the number of Black graduates produced has increased more than 16-fold from about 3 400 in 1986 to more than 55 600 in 2011. The implications of the racial differences in graduate output growth are simple: while the HE system produced 7.9 White graduates for each Black graduate in 1986, by 2011 it produced 1.6 Black graduates for every single White graduate. Figure 3.3 offers a similarly poignant illustration of the extent of change in the racial composition of South Africa’s stock of graduates by showing the respective racial shares of the total number of graduates produced in each year since 1986″ (p13).

From his 2013 Economic Society of South Africa paper.

We’re hiring a Project Administrator! (based in Stellenbosch)

help

Hi education folk

We’ve recently been awarded a grant by the UK Economic and Social Research Council (ESRC) and DFID to do research on exceptional township and rural primary schools in three provinces – Western Cape, KwaZulu-Natal and Limpopo. I will be leading the project together with a great team of co-investigators and researchers: Ursula Hoadley (UCT), Jaamia Galant (UCT), Nick Taylor (JET), Servaas van der Berg (ReSEP), Gabi Wills (ReSEP) and Linda Zuze (HSRC).

Given that we will be using a matched-pair approach, the aim of the project is to to firstly identify at least 10 high-performing township/rural schools in each of the three provinces and then match those schools to ‘typical’ neighbouring schools (thus 60 schools in total). The project will run for 2.5 years (beginning June 2016) and will involve in-depth qualitative research, administering and analysing assessments, creating new school-leadership and management instruments and analysing the data emerging from the project.

At the moment we are looking for a part time (50%) project administrator to help us with the administration relating to the project. The full job-advert can be found here. I include a short extract:

The ideal candidate should be an efficient and organised person with some experience in managing the administrative side of academic projects. They should be friendly and able to communicate well, as well as plan effectively and take initiative to solve problems as they arise. They should also be able to liaise with (1) the funders – DFID/ESRC, (2) Stellenbosch University finance and administration personnel, and (3) the 5 co- investigators as well as other researchers and field-workers. The job will include following up with government officials, managing flights and accommodation, planning reporting cycles, managing time-sheets, budgets and funding claims, proof-reading and printing questionnaires etc.

They should also be friendly 🙂 Basically we’re looking for a go-to admin guru to help us with this project. If your skills and experience are such that you would also be able to help on the non-admin research side (doing research-assistant work or interviews/assessment) then we may involve you in more than an administrative role. However this would be on top of your administrative responsibilities, and in such a case the remuneration is somewhat negotiable. It is a part-time position and it’s based at Stellenbosch University (in the Economics Department) so remuneration would be in line with university salary scales (I believe it is about post-level 11, although it would be 50% of the amount stated here) and partially dependent on qualifications and/or experience.

If you’re interested in working with this great team on an exciting new project please do apply 🙂 (and if you know of anyone who may be interested please forward this on to them!)

DEADLINE FOR APPLICATIONS: 12 May 2016


Black youths are NOT educationally worse off than 20 years ago – Dr Stephen Taylor

Screen Shot 2016-04-30 at 7.45.40 AM

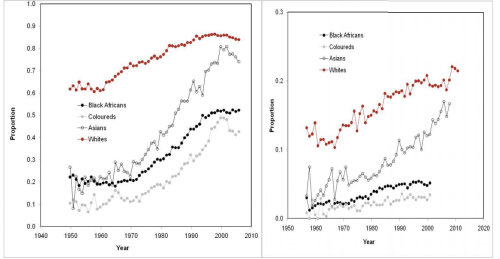
Figure 1: Proportions of the population achieving secondary education (left) and a bachelors degree (right). (Source: Stats SA (2015): CENSUS 2011: A profile of education enrolment, attainment and progression in South Africa, page 41.)

On the 18th of April the Business Day published a piece titled, “Black youth less educated now than 20 years ago.” This statement is simply wrong and unsupported by any data set. Yet the story is now gaining momentum and has been published by other news outlets, such as the Daily Maverick, reporting that “Stats SA claims black youth are less skilled than their parents.”

The article asserts that “black and coloured youths have regressed in their educational achievements” and that the proportion of black and coloured youth that complete a university degree as a share of the population has decreased. This is factually incorrect.

The article references a recent Stats SA report on the status of the youth as well as comments by the Statistician General, Pali Lohohla, as the basis for these assertions.

But in fact, the Stats SA published reports (as with all other analysis I have seen or done) indicate that the proportions of black and coloured youths who attain grade 9, grade 12, and a university degree, have all increased consistently in recent decades and are still increasing. It is thus not clear where this misconception arose.

I suspect the mistake may have arisen through a misunderstanding of a statistic which has been presented by the Statistician General recently and which appears in Stats SA’s report on educational enrolment, attainment and progression (December 2015). The statistic shows that the proportion of black and coloured youths who achieve a bachelors degree “after completing grade 12” has been declining over the last 20 to 30 years.

It needs to be understood that this statistic is the proportion of matriculants who go on to attain a degree. In other words, the denominator in this calculation is matriculants as opposed to the entire black and coloured population.

The improvement in matric attainment among black and coloured youth has been larger than the improvement in degree attainment among black and coloured youth, but – and this is the important part – there have been big improvements in both. The fact that the increase in degree completion has been slower than the increase in matric completion is not at all an indication that youth are worse off now than 20 years ago.

So the ‘bad’ news is that degree completion, although it has increased, has not kept pace with the fast increase in the attainment of matric amongst black and coloured youths. But this certainly does not mean that educational outcomes are worse than 20 years ago.

So what do the numbers actually say? The Stats SA report issued in December shows that the proportion of black people completing matric has been consistently increasing from about 20% to about 50% over the last 50 years. That report also indicates that the proportion of black people completing a degree has increased from about 2% to about 4% over the same period.

Whether you read official Stats SA reports or do your own calculations on the various Stats SA datasets – I have analysed Census data from 1996, 2001 and 2011 as well as General Household Survey data from 2002 to 2014 – it is clear that both matric attainment and degree attainment has been increasing amongst the black and coloured population.

It is also useful to consider the Department of Basic Education’s matric statistics from recent years. In 1990, there were 191 000 matric passes. By 2015 this number had more than doubled to 465 863. This increase has been driven mainly by growing numbers of black youth passing – and this growth has easily outstripped population growth, which has been about 1% a year. Even since 2008, the number of black matric passes has increased from about 250 000 to over 350 000. And the number of black people achieving a bachelors pass in matric has increased from about 60 000 to about 120 000 since 2008.

I am by no means suggesting that everything is fine in our education system. Despite the progress, there are still too many youths who do not get to grade 12, the main reason being that educational foundations laid in earlier grades have been inadequate. And completion rates at our higher education institutions should worry us. But there have been improvements in both of these areas relative to 20 years ago.

Although improved access at lower levels of education (primary and secondary school completion) has been faster than access at higher levels, paradoxically the solutions must focus on the early grades if sustainable progress is to be made.

The most alarming education statistics to me are the low proportions of children achieving basic literacy and numeracy in the early grades. International assessments of education quality point to serious deficiencies in this area, even compared to some other countries in the region. If children are not learning to read in the early grades, they will not be able to make it to higher education.

But even in the area of learning quality, the evidence points to improvement. The Trends in International Mathematics and Science study (TIMSS) showed substantial improvements in mathematics and science achievement at the grade 9 level between 2002 and 2011. However, this improvement is off a very low base.

Educational outcomes in South Africa remain far too low, especially amongst youths from poor communities. But claims that education was better under apartheid or that outcomes have deteriorated over the last 20 years are alarmist and have no basis in reality.

—

Dr Stephen Taylor is a researcher in the South African Department of Basic Education. His work includes impact evaluation of education interventions, measuring educational performance and equity in educational outcomes. In 2010 he completed a PhD in economics at the University of Stellenbosch, analysing educational outcomes of poor South African children.

(This article first appeared in the Business Day on Friday the 29th of April 2016)


Reading in FP Seminar (28 April, JHB) space available :)

ele

I’m currently involved in a number of research projects that look specifically at reading in the Foundation Phase in South Africa. In my view this is the cause of (and solution to) so many of the problems we see in our education system.

I thought it would be a good idea to get some of the SA reading researchers  in the same room to talk about the work they’re currently doing and talk about the way forward. So we’ve organized a half-day workshop for the 28th of April (8:30am-2:30pm). It will be an informal seminar of researchers and should be relatively small (<40 people) to make sure we have time to interact.

Prof Elbie Henning at UJ has kindly offered to host the workshop at UJ (as an aside I am now a part-time research fellow at her SARChI Chair).  See the programme below. There are a number of exciting presentations, perhaps most exciting is early feedback from Stephen Taylor et al’s RCT in the North West!

The good news is that we have additional space for 5 or 6 additional participants who would like to attend. So if you’re involved in reading research, teaching reading teachers or policy-making in the Foundation Phase and would like to come on the 28th please send me an email (nicholasspaull[at]gmail.com) with the title “Reading in FP Workshop.” Please also include a paragraph about who you are and why you’d like to attend.

Time Presenters
08:30 – 09:00  Morning tea and coffee
09:00 – 09:20 Nic Spaull, University of Johannesburg/OECD

Reading in the Foundation Phase – introduction, welcome and overview

09:25 – 09:45 TBD
09:50 – 10:10 Deborah Mampuru, University of South Africa

Reflections on the development of the African language DBE Workbook series

10:15 – 10:35 Elizabeth Pretorius, University of South Africa

Oral Reading Fluency and other components of ESL reading: What we know and what we still need to discover

10:40 – 11:00 Stephen Taylor, Department of Basic Education

Preliminary results of a Randomized Control Trial assessing an early grade reading intervention in the North West

11:00 – 11:20

Tea and coffee break

11:25 – 11:50 Elizabeth Henning, University of Johannesburg

Vision for the new NRF SARChI Chair in Integrated Studies of Learning Language, Mathematics and Science in the Primary School

11:55 – 12:20


Brahm Fleisch, Wits University

Reflections on large-scale interventions: Overview of ongoing interventions and discussion of the Triple Cocktail

12:20 – 13:20


Carol Nuga Deliwe, Department of Basic Education & Nic Spaull, University of Johannesburg/OECD

Facilitated discussion with everyone on prioritising reading in the DBE – moving from rhetoric to implementation

13:30 – 14:30

Lunch


Links I liked

14953538130_f8409d8508_z

    • “Civilising in Earnest: Schools and Schooling” – Chapter 18 of Weber’s “Peasants into Frenchmen: The Modernisation of Rural France.” An incredibly insightful read about the role that education plays in unifying a country, standardising a language and promoting the dominant culture. A must read.
    • Currently I’m very interested in Catherine Snow‘s research on reading – the way she writes about reading and reading research is both accessible and sophisticated but also totally unpretentious. Start with this article: “Reading Comprehension: Reading for Learning.” I also found an online version of Adger, Snow & Christian’s (2003) “What teachers need to know about language” which looks great.
    • I recently gave a workshop/seminar at Herzlia High School in Cape Town on the topic “Assessment: Helping or Hurting the Academic Project?” where we spoke about new thinking in the assessment space, as well as expanding what we consider the academic project to be; including socio-emotional skills, grit, and 21st century skills (Creativity, Collaboration, Critical Thinking, Communication). On this note, NPR published a nice post titled “Non-academic skills are key to success. But what should we call them.”
    • Evaluation of Washington DC’s IMPACT policy (controversial teacher-rating system and concomitant replacement of ineffective teachers) had a positive impact on student outcomes
    • Pasi Sahlberg writes that Harvard grad students (and all others) should be able to write op-eds and not just academic papers. Obviously I agree. Future students consider yourselves notified.
    • BrainPickings covers Krista Tippett’s new book “Becoming Wise: An inquiry into the mystery and art of living.” I thoroughly enjoyed Krista’s interview on Design Matters.
    • Cool  TED Talk by Paulo Blikstein from Stanford on his idea of the FabLab@School at Stanford.
  • “The End of the Lecture?” by Peter Struck – “In contrast a good lecture should be designed to make a student work harder to prepare for the following one. It will motivate students to carry on the really hard, self-driven work of teaching themselves. It needs to transform data into knowledge by providing a synthesis and modelling for the students how to do it. It tailors the mass of information on a subject into a comprehensible narrative that picks and chooses, making judgments and subordinating some ideas to others. It animates the raw power of the fresh ideas it conveys. In other words, what makes a good lecture in these new formats is pretty much what makes a good lecture at all. Lectures have always been hard to do well, and we would benefit from more time spent working to improve them, something that will happen only by first resisting anti-lectureism, which, as a side effect, absolves us from the task.
  • Q&A with Angela Duckworth (of ‘grit’ fame) “One thing we’re doing to learn more about what teachers are doing, what works, and how we can scale it, is we are giving grants to teachers. Teachers probably have better ideas than we do about children and how to help them. What they don’t always have is training in the scientific method, measurement, study design, and statistics. What we’re hoping to do is help those teachers test those ideas in ways that might be more systematic than they might be able to do on their own.”

Research

Minding the gap?’ A national foundation phase teacher supply and demand analysis: 2012-2020 – Green, Adendorf & Mathebula (2015)

Abstract: This paper explores the extent to which foundation phase teacher supply meets demand in South Africa, against a backdrop of considerable change in an education system endeavouring to fulfil the needs of a 21st century society while still battling with significant inequalities in the distribution of skills. The primary purpose of the paper is to use recently sourced teacher education data from a range of national databases to determine to what extent state-led interventions are assisting to meet the foundation phase teacher supply and demand challenge. The data, as well as the more qualitative aspects of their context, are analysed at the macro (national) level to present a more nuanced picture of foundation phase teacher supply and demand. The study attempts to move beyond simply basing an analysis of supply and demand on teacher attrition, and takes into account multiple variables that should be considered in supply and demand planning. It also goes beyond simply matching supply to demand in the most recent year for which data is available, to forecasting a future scenario which will need to be planned for. The paper concludes by suggesting steps that should be taken to ensure a better match between supply and demand.

Making Good Use of New Assessments: Interpreting and Using Scores From the Smarter Balanced Assessment Consortium (2015) by Linda Darling-Hammond Edward Haertel James Pellegrino. Important thinking about around new assessments.

Quasi-experimental evidence on the effects of mother tongue-based education on reading skills and early labour market outcomes (Bethlehem A. Argaw∗ Leibniz University of Hanover February 23, 2016)

 Abstract: Prior to the introduction of mother tongue based education in 1994, the language of instruction for most subjects in Ethiopia’s primary schools was the official language (Amharic) – the mother tongue of only one third of the population. This paper uses the variation in individual’s exposure to the policy change across birth cohorts and mother tongues to estimate the effects of language of instruction on reading skills and early labour market outcomes. The results indicate that the reading skills of birth cohorts that gained access to mother tongue-based primary education after 1994 improved significantly by about 11 percentage points. The provision of primary education in mother tongue halved the reading skills gap between Amharic and non-Amharic mother tongue users. The improved reading skills seem to translate into gains in the labour market in terms of the skill contents of jobs held and the type of payment individuals receive for their work. An increase in school enrollment and enhanced parental educational investment at home are identified as potential channels linking mother tongue instruction and an improvement in reading skills.

“Double for Nothing? Experimental Evidence on the Impact of an Unconditional Teacher Salary Increase on Student Performance in Indonesia” (Dee et al, 2016)

Abstract: How does a large unconditional increase in salary affect employee performance in the public sector? We present the first experimental evidence on this question to date in the context of a unique policy change in Indonesia that led to a permanent doubling of base teacher salaries. Using a large-scale randomized experiment across a representative sample of Indonesian schools that affected more than 3,000 teachers and 80,000 students, we find that the doubling of pay significantly improved teacher satisfaction with their income, reduced the incidence of teachers holding outside jobs, and reduced self-reported financial stress. Nevertheless, after two and three years, the doubling in pay led to no improvements in measures of teacher effort or student learning outcomes, suggesting that the salary increase was a transfer to teachers with no discernible impact on student outcomes. Thus, contrary to the predictions of various efficiency wage models of employee behavior (including gift-exchange, reciprocity, and reduced shirking), as well as those of a model where effort on pro-social tasks is a normal good with a positive income elasticity, we find that unconditional increases in salaries of incumbent teachers had no meaningful positive impact on student learning