DBE is hiring… (closing 14 Aug)

hiring-job-candidates-1940x900_34860

The Department of Basic Education (DBE) is advertising vacancies for a number of high-level posts. If you know of great candidates please forward this on to them. Our education system is only as good as the bureaucrats who help run it 🙂

PDF with full job descriptions and salaries HERE.

Some of them that might be interesting to some of you…

POST: Chief Director: (Ref no: 22435/02)

BRANCH: Curriculum Policy, Support and Monitoring
CHIEF DIRECTORATE: Curriculum and Quality Enhancement Programmes
SALARY: All-Inclusive remuneration package of R 1 068 564 per annum
CENTRE: Pretoria

POST: Chief Director: (Ref no: 22435/03)

BRANCH: Teacher and Professional Development
CHIEF DIRECTORATE: National Institute for Curriculum and Professional Development (NICPD)
SALARY: All-Inclusive remuneration package of R 1 068 564 per annum
CENTRE: Pretoria

POST: Director: (Ref no: 22435/05)

BRANCH: Planning, Information and Assessment
DIRECTORATE: National Assessments
SALARY: All-Inclusive remuneration package of R 898 743 per annum
CENTRE: Pretoria

POST: Director: (Ref no: 22435/06)

Branch: Planning, Information and Assessment
Directorate: Education Management Information Systems (EMIS)
SALARY: All-Inclusive remuneration package of R 898 743 per annum
CENTRE: Pretoria

POST: Assistant Director: Integrated Quality Management Systems (IQMS) (Ref no: DBE/40/2017)
Branch: Teacher and Professional Development
Directorate: Educator Performance Management and Development and Whole School Evaluation

SALARY: R 417 552 per annum
CENTRE: Pretoria

POST: Assistant Director (Reporting, Publication and Information Dissemination): (Ref no: DBE/42/2017)
Branch: Planning, Information and Assessment
Directorate: Education Management Information Systems (EMIS)

SALARY: R 417 552 per annum
CENTRE: Pretoria


Barbara Band’s links on diversity and inclusion

barbaraLast week I spoke at the South African Librarian’s Conference at Highbury in KZN (presentation one and presentation two) and heard Barbara Band speak about how the library can be a vital tool to make schools more inclusive and help all students thrive. It struck a cord for me because in high school I basically lived in the library during breaks for three years. My librarians weren’t especially empathetic or insightful but it was still a safe place in an unsafe school. As always we can’t forget that South Africa is a deeply unequal country and that only 37% of learners are in a school with a library (Page 20 from this DBE report).

In Barbara’s address she mentioned a bunch of different sites and resources and I asked her to email them to me so I could share the mall with you, so here they are:

Booklists and bookshops:

3

List of organisations that support diversity and inclusion:

  • Ditch The Label – anti-bullying charity supporting 12 – 25 year olds
    www.ditchthelabel.org
  • EACH – Educational Action Challenging Homophobia: provides training, support and resources.
    http://www.each.education/
  • Educate and Celebrate – Ofsted and DFE recognised programme to implement LGBTQ/inclusive curriculum
    www.educateandcelebrate.org
  • Gendered Intelligence – a not-for-profit company whose aim is to increase understandings of gender diversity.
    http://genderedintelligence.co.uk/
  • GIRES – Gender Identity Research and Education Society: aim is to improve lives of trans and gender non-conforming people. Lots of links to articles, research, legal advice, etc.
    http://www.gires.org.uk/
  • 6IGLYO – International Lesbian, Gay, Bisexual, Transgender and Queer Youth and Student Organisation: works with over 95 LGBTQ groups, run by and for young people.
    http://www.iglyo.com/
  • Inclusive Minds – a group of consultants and campaigners working to improve diversity in children’s literature.
    http://www.inclusiveminds.com/
  • Kidscape – deals with anti-bullying and child protection
    www.kidscape.org.uk
  • Mermaids – Family and individual support for children and teens with Gender Identity Issues.
    http://www.mermaidsuk.org.uk/
  • 4Metro – Equality and diversity charity, focusing mainly around London and South East.
    www.metrocentreonline.org
  • Rewind – works in education to challenge racism and extremism
    http://rewind.org.uk
  • Schools Out UK – aim is to make schools safe and inclusive for everyone: lots of links to resources and other relevant websites.
    www.schools-out.org.uk
  • Stonewall – help and advice, carries out research, partners with schools and organisations, lots of resources.
    http://www.stonewall.org.uk/
  • Welcoming Schools – aimed at US elementary schools but has useful information, advice, etc.
    http://www.welcomingschools.org/

ALSO USEFUL:

7


Funda Wande: Teaching Reading for Meaning

[A little info on what I’ve been working on for the last while – more details to come in the coming months!]

Guest blog post I wrote for the Allan Gray Orbis Foundation from here

Overview: South Africa is virtually unique among upper-middle-income countries in that most of our children (58%) do not learn to read for meaning in the first three years of school[1]. Without this core skill, they fall further and further behind as they are promoted into higher grades. While there are many reasons for this reading crisis one of the most prominent is that Foundation Phase teachers do not know (and have never been taught) how to teach reading. The Funda Wande: Teaching Reading for Meaning” project aims to help address this course by developing a high-quality, free, open-access and SAQA-approved course: the ‘Certificate in Teaching Early Grade Reading.” All course materials will be available in isiXhosa (the pilot language) and subtitled in English. There will also be an English First Additional language sub-course. It is largely video-based with on-site coaches visiting teachers in their classrooms once every two weeks.

Capturefw

In the 21st Century we live in a world that is inundated with written language, or ‘print’. We see it in our newspapers, on our contracts, on the screens of our cell phones and the pages of our school books. From the policies of government to the signs on our roads, it is the essential ingredient in modern life. Print is everywhere. And this is why reading is so important. Learning to crack the code of how we represent spoken language using symbols is a big part of why we go to school. We learn the differences between b and d, or between p and q. Moving from letters and syllables to words and sentences we can read about pirates, pigs and pixies or earth-quakes and igloos. Once we have cracked the code the possibilities are endless. This is the joy of being initiated into the literate world.

Aside from the practical importance of reading to make our way through the world, reading (and writing) is essential for participation in formal education since the ability to decode text, read with comprehension and learn from reading is the bedrock of most activities in institutions of learning. If reading is not mastered early on, progress in schooling is restricted. Unfortunately nationally representative surveys (prePIRLS) show that more than half (56%)[2] of South African children do not learn to read fluently and with comprehension in any language by the end of Grade 4. But, as with most averages in South Africa, it hides huge inequalities. If we compare the wealthiest 10% of these learners with the poorest 50% the differences are astounding. Among the richest learners 86% learn to read for meaning compared to less than 30% among the poorest half of learners. Why is this?

One of the main reasons behind this reading crisis is that our teachers have never been given meaningful learning opportunities to acquire this specialized knowledge, neither in their initial teacher training nor in subsequent in-service training. They often do not know what the various components of reading are (phonics, vocabulary, comprehension, fluency and motivation) or how these fit together into a cohesive whole. Many teachers are also confused about how to implement different reading methodologies like group-guided reading or shared reading. Currently teachers focus on communalized activities like chorusing and offer very little differentiation or individualized instruction or assessment. There is also little formal teaching of vocabulary, spelling, writing or phonics and almost no understanding of how to develop the most important skill in reading: comprehension. Importantly, while the majority of our learners are learning to read in an African language (70%+), almost all universities only offer pre-service instruction on teaching reading in English.


To help fill this gap, we are designing a new course to help make sure that all Foundation Phase teachers in the country know how to teach reading in their home-language and in English as a First Additional Language. The “Funda Wande: Teaching Reading for Meaning” project was initiated at the start of 2017 at the request of the Allan Gray Orbis Foundation Endowment Trustees and is now funded by the Endowment together with two funding partners: The Volkswagen Community Trust and the Millennium Trust. The course is currently being developed for two languages: isiXhosa  and English First Additional Language. Using professionally filmed in-classroom videos, animations, info-graphics and other multi-media the course will teach the major components of reading and writing.

The 11 modules are: (1) How children learn to read, (2) Decoding in reading and writing, (3) Comprehension, (4) Vocabulary, (5) Children’s literature, (6) CAPS reading activities, (7) English as a First Additional Language, (8) Writing, (9) Reading assessment and remediation, (10) Inclusive education, and (11) Planning and progression. The course will be a credit-bearing Certificate accredited by the South African Qualifications Authority (SAQA). The course and all materials developed in the course will be openly licensed (Creative Commons) and freely available for anyone to use. It will be offered as a Certificate in Teaching Early Grade Reading by at least one public university in South Africa. The course will be evaluated in 2019-2021. If the evaluation of the course shows that it significantly raises teachers’ content knowledge and improves their teaching practice, and importantly raises the reading outcomes of the learners they teach – the mandate is to adapt the course and offer it in all of South Africa’s official languages. Ensuring that all teachers know how to teach reading and writing is the first step in ensuring that all South African children learn to read for meaning and pleasure.

If you are an expert in teaching early grade reading in isiXhosa and would like to be involved in the project or to find out more information please email me nicspaull[at]gmail.com

[1] This statistic is taken from one of the nationally-representative datasets of reading achievement in South Africa (prePIRLS, 2011). See Spaull (2016) for a fuller discussion of the results from the PIRLS and prePIRLS studies.

[2] Spaull, N (2016). Learning to read and reading to learn. Research on Socioeconomic Policy (RESEP) Policy Brief. Stellenbosch.

Book reflection: “When Breath Becomes Air” – Paul Kalanithi

41f2EooDXHL._SX320_BO1,204,203,200_Recently things have been moving quite quickly in my life. Old projects are in full swing, new projects are gaining momentum and I’ve moved into a new apartment in Cape Town. (I even unpacked my books!) Somewhere in-between I travelled to Croatia and ended a long-term relationship. Today I didn’t go in to work.

Last night I finished a novel I’ve been reading for a few months on and off and cried into the sofa as I pored over the last few pages. “A Little Life” by Hanya Hanagihara was recommended to me (thanks James!) after we discovered a mutual love of “The Secret History” by Donna Tartt. A Little Life is a long book but one that is easy to slip into and feel a part of. It is a tragic story full of sadness and inhuman pain, but the relationships and the meaning sunk deep into my heart as I read on. I didn’t realise how attached I was getting to these fictional characters living non-existent lives in New York.

Before I had finished Hanagihara’s novel I came across Paul Kalanithi’s “When Breath Becomes Air” in an airport and bought it for the flight. I was absolutely hooked and read it in one day. The author, a Stanford neurosurgeon/neuroscientist, discovers that he has an aggressive cancer just at the point when he is meant to start reaping the rewards of 10-years of gruelling preparation. What do you do when you have 2 years left to live? For Kalanithi he turned to his other vocation – reading and writing.

“Lost in a featureless wasteland of my own mortality, and finding no traction in the reams of scientific studies, intracellular molecular pathways, and endless curves of survival statistics, I began reading literature again: Solzhenitsyn’s Cancer Ward, B. S Johnson’s The Unfortunates, Tolstoy’s Ivan Ilyich, Nagel’s Mind and Cosmos, Woolf, Kafka, Montaigne, Frost, Greville, memoirs of cancer patients – anything by anyone who had ever written about mortality. I was searching for a vocabulary with which to make sense of death, to find a way to begin defining myself and inching forward again” (p148).

I loved this book more than most others over the last few years. I found myself regularly reflecting on my own life as I read about his life and imminent death. Career choices, relationships, ambition, children, meaning, religion, mortality – he touches on everything and draws you in to the whirlwind that was his life growing up and now as it accelerates approaching death.

In a sense you can’t script a life like his. Before going into medicine he spent his youth obsessed with English literature and the meaning of life, giving him the lessons and existential resources our culture has found or created over the centuries. Science doesn’t comfort much in the face of death.

“A few years later, I hadn’t thought much more about a career but had nearly completed degrees in English literature and human biology. I was driven less by achievement than by trying to understand, in earnest: What makes human life meaningful? I still felt literature provided the best account of the life of the mind while neuroscience laid down the most elegant rules of the brain. Meaning, while a slippery concept, seemed inextricable from human relationships and moral values. T. S. Eliot’s The Waste Land resonated profoundly, relating meaninglessness and isolation, and the desperate quest for human connection. I found Eliot’s metaphors leaking into my own language. Other authors resonated as well. Nabokov, for his awareness of how our suffering can make us callous to the obvious suffering of another. Conrad, for his hypertuned sense of how miscommunication between people can so profoundly impact their lives. Literature not only illuminated another’s experience, it provided, I believed, the richest material for moral reflection. My brief forays into the formal ethics of analytic philosophy felt dry as a bone, missing the messiness and weight of real human life.

Throughout college, my monastic, scholarly study of human meaning would conflict with my urge to forge and strengthen the human relationships that formed that meaning. If the unexamined life was not worth living, was the unlived life worth examining?”

This last sentence hit me when I read it and hasn’t left me since. Am I really living my life?! I had recently come back from a Croatian island filled with compelling humans living such deliberate, authentic and vulnerable lives. Politicians, artists, nomads, hippies, techies, shamans – the works. Not all that glitters is gold – for sure – but there really were some golden folk there. We had endless conversations about desires, fears, comfort-zones, purpose and passion. And here I was living a fully defensible life.

Him: When last did you really fail at something?”

Me: Not recently”

Him: Are you really trying then?”

Me: I don’t know”

I realised how paralysed I was by fear and judgement. Of others, of my own. I’ve realised how incredibly critical I can be and that this has severe personal and social costs.

Kalanithi helped.

“Heading into my sophomore summer, I applied for two jobs: as an intern at the highly scientific Yerkes Primate Research Center, in Atlanta, and as a prep chef at Sierra Camp, a family vacation spot for Stanford alumni on the pristine shores of Fallen Leaf Lake, abutting the stark beauty of Desolation Wilderness in Eldorado National Forest. The camp’s literature promised, simply, the best summer of your life. I was surprised and flattered to be accepted. Yet I had just learned that macaques had a rudimentary form of culture, and I was eager to go to Yerkes and see what could be the natural origin of meaning itself. In other words, I could either study meaning or I could experience it. After delaying for as long as possible, I finally chose the camp.

Eventually the term ended and I was on the windy mountain road to the camp, still slightly worried that I’d made a wrong turn in life. My doubt, however, was short-lived. The camp delivered on its promise, concentrating all the idylls of youth: beauty manifest in lakes, mountains, people; richness in experience, conversation, friendships.

This was summer at Sierra Camp, perhaps no different from any other camp, but every day felt full of life, and of the relationships that give life meaning. Other nights found a group of us on the dining room deck, sipping whiskey with the assistant director of the camp, Mo, a Stanford alum taking a break from his English PhD, and discussing literature and the weighty matters of postadolescent life.

Back on campus, I didn’t miss the monkeys. Life felt rich and full, and over the next two years I kept at it, seeking a deeper understanding of a life of the mind. I studied literature and philosophy to understand what makes life meaningful, studied neuroscience and worked in a fMRI lab to understand how the brain could give rise to an organism capable of finding meaning in the world, and eniched my relationships with a circle of dear friends through various escapapades. We raided the school cafeteria dressed as Mongols; created a full fake fraternity, complete with fake rush-week events, in our co-op house; posed in front of the gates of Buckingham Palace in a gorilla suit; broke into Memorial Church at midnight to lie on our backs and listen to our voices echo in the apse; and so on. (Then I heard that Virgina Woolf once boarded a battleship dressed as Abyssinian royalty, and duly chastened, stopped boasting about our trivial pranks. 

I would recommend this book to anyone. I’m still processing what all this means for me and how I want to live my life. What and who I want to prioritise. Where I want to spend my energies. What I want to experience. Where I want to contribute. Who I want to be. Read this book.

“That which is only living. Can only die.” – T. S. Eliot.


EGRS is recruiting as well :)

57c129023dd337b563123a2040341bb6.jpg

The Director of Research in the DBE – Dr Stephen Taylor – is looking for a Project Associate and a Project Intern for their Early Grade Reading Study (deadline for applications: 2 June 2017). The work they are doing on early grade reading is some of the most interesting and important work on the topic not only in South Africa but across the continent. Figuring out how you improve early grade reading outcomes at scale and using rigorous scientific evidence and evaluation. Having seen the early results of EGRS 1 I can say that there is a lot of promise in the coaching model for improving teacher’s content knowledge about reading and their pedagogical practice.

While the salaries may not be amazing 🙂 the team you will be working with really is and you may think of this as a launch pad into a rapidly growing and exciting field. Stephen Taylor, Mpumi Mohohlwane, Carol Nuga Deliwe, Janeli Kotze and Brahm Fleisch are all involved in the team. If you know of anyone please forward the TOR’s in the links above and below to them – deadline 2 June 2017.

EGRS 1


egrs2

I’m also working in this early grade reading space but on developing a (video and coaching based) certificate to teach early grade reading for the Allan Gray Orbis Foundation Endowment. I think we will also be recruiting soon. Stay tuned 🙂

We’re hiring: Project Administrator

gantt-chart-pictofigo-hi-006
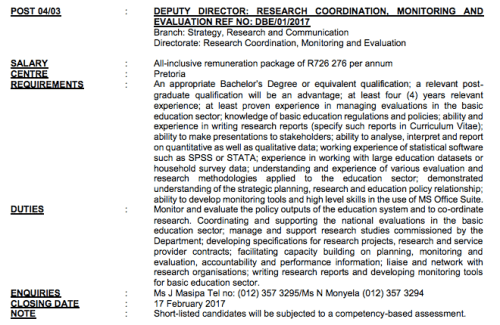
Ahoy blog-followers and other readers on the intertrons! It’s been a while since I’ve updated my blog on what I’ve been doing since I got from the OECD in Paris. Things were a little up and down about where I wanted to live, where I was going to work and the longer-term plans for life. So some of that has been resolved and things are moving ahead swiftly. I’ve been appointed as a Senior Researcher at RESEP in the Economics Department at Stellenbosch University. At the same time I’ve been seconded to the Allan Gray Orbis Foundation Endowment for half of my time to develop a video and coaching-based course to teach Foundation Phase isiXhosa teachers how to teach reading.

This is a really exciting 2-year project that I will be heading up and involving a wide range of Foundation Phase and isiXhosa experts and film professionals. A slightly-outdated (soon to be updated) overview of what we want to achieve in the course can be found HERE. If you know any isiXhosa early-grade-reading experts please also email me with more information.

For this project we are looking for a super-organised Project Administrator to work with myself and the Project Manager as we develop the course over the next 2 years. The link to the job description and application portal is here: http://agof.erecruit.co.za/candidateapp/Jobs/Categories/Project_Office/ea53aba45375451695c82c473eeec9f8

Please forward this to any isiXhosa Home-Language potential applicants you may know. I am open to adjusting the scope of the position based on the skills and expertise of the successful applicant, but it would definitely involve running the administrative side of the project (book-keeping, logistics admin, liaising with service providers etc).

Nic

Who makes it into PISA in Turkey?

Below is a quick summary of what I was working on at the OECD in Paris last year. The full paper is now available online here:

2
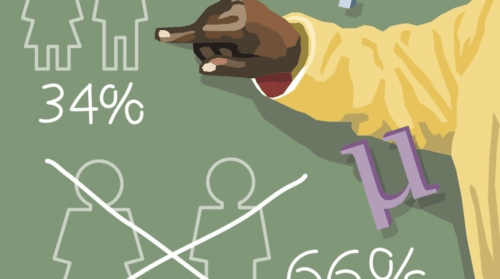
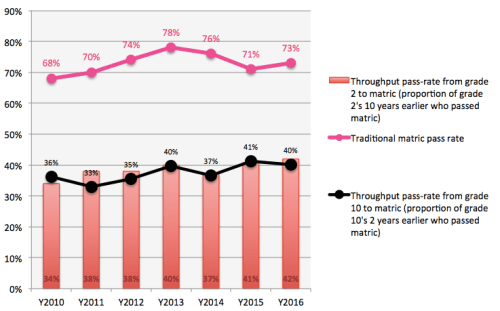
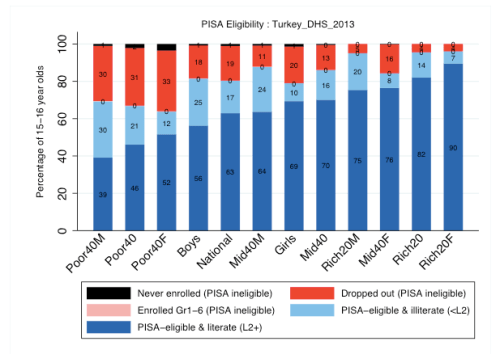
Of the OECD countries that participate in the Programme for International Student Assessment (PISA), Turkey has one of the lowest levels of performance and the highest rates of improvement in PISA scores. However, most analyses have traditionally ignored one vital question: what percentage of 15 year olds in Turkey are eligible for the PISA sample in each wave of PISA? A new OECD Working Paper focuses on this specific question and sheds new light on the performance of Turkey between 2003 and 2012. It shows that the percentage of students that were eligible for PISA in Turkey between 2003 and 2012 nearly doubled from 36% to 68% (using OECD indicators) or from 45% to 80% (using household survey data). This is summarised in Figure 1 below which provides information from the Turkish Demographic and Health Survey (DHS) of 2003, 2009 and 2012.
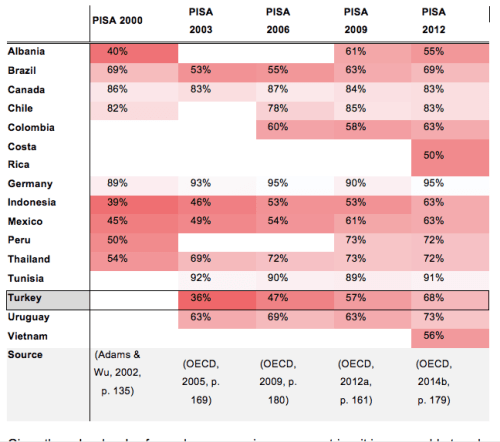
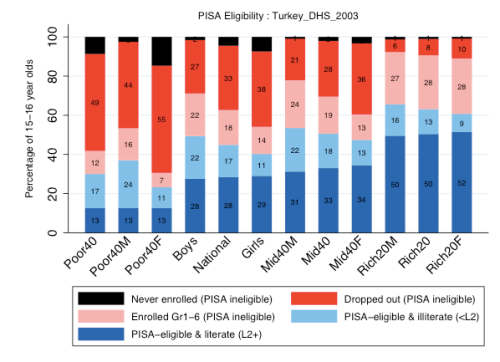
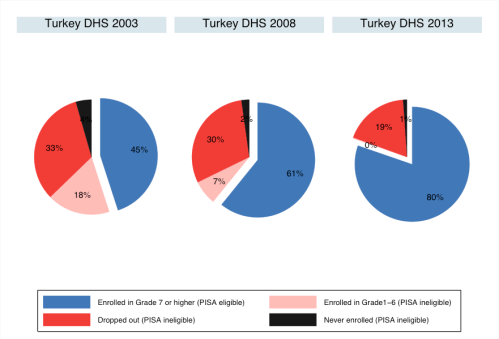
Figure 1: The educational status and PISA-eligibility of 15-16 year olds in Turkey in DHS 2003, DHS 2008 and DHS 2013

1

While PISA aims to assess a nationally representative sample of 15 year olds, because PISA is a school-based survey, in reality it excludes all students that are no longer in school (due to drop out or non-enrolment). PISA also only samples 15 year olds if they are in Grade 7 or higher. So PISA is really a nationally representative sample of 15 year old students that are still enrolled in school and are currently in Grade 7 or higher. This might sound like a trivial technicality, and in most wealthy OECD countries like Germany or Japan it is. But some OECD countries (like Turkey and Mexico) and many partner countries (like Vietnam and Indonesia) have high levels of student dropout and delay leading to low levels of PISA sample coverage. As an aside, the new PISA-for-Development initiative aims to also survey out-of-school 15 year olds in some of the developing countries participating in that programme.

Since the beginning of PISA, the OECD has reported the percentage of 15 year olds that are actually eligible for PISA, what is called “Coverage Index 3*.” This statistic is calculated using census and enrolment data in each country and is provided in the overall PISA Reports and Technical Reports for all participating countries. For example, in Turkey in PISA 2003, only 36% of 15 year olds were eligible for PISA. That is to say that PISA 2003 in Turkey is only representative of 36% of the country’s 15 year olds. By comparison, the figure in Germany in 2003 was 93%. Table 1 below provides the Coverage Index 3 rates for a selected group of PISA countries with low levels of sample coverage (Germany and Canada are included as reference countries). From this we can see that a number of partner countries have very low levels of sample coverage, including Costa Rica, Indonesia, Peru and Vietnam, but also that some OECD countries (such as Brazil, Mexico and Turkey) have low levels of sample coverage.

Table 1: The percentage of the total 15 year old population covered by the PISA sampling frame (Coverage Index 3) in selected countries

Screen Shot 2017-04-18 at 7.57.17 AM

Given these low levels of sample coverage in some countries, it is reasonable to ask: how would the results change if we included PISA-ineligible 15-year-olds in our calculations? This is the focus of a new working paper published this week, titled “Underestimating Progress and Inequality in Turkey (2003-2012): Using PISA and DHS to form a complete picture of access and quality”. The method and results are briefly summarised below.

The paper applies a new method developed by Spaull & Taylor (2015) which aims to combine statistics on the learning outcomes of 15 year olds that are still in school (using PISA) with data on the number and type of 15 year olds that are not in school (using household-survey data). By assuming that PISA-ineligible students would not have reached PISA Level 2 in Reading and Mathematics – a relatively conservative assumption – we can calculate the percentage of the total population of 15 year olds that reach Level 2 in PISA, rather than only the percentage of those that are still in school. Figure 2 and Figure 3 below provide these breakdowns for Turkey in PISA 2003 and PISA 2012 respectively, and also by gender and socioeconomic subgroups. (Note: ‘Poor40’ means the poorest 40% of 15-16 year olds, and ‘Poor40F’ means poorest 40% of 15-16 year olds that are also female).

Figure 2 Access to Literacy (Level 2) in Turkey 2003 (PISA 2003 and DHS 2003)

Screen Shot 2017-04-18 at 7.57.47 AM

Figure 3 Access to Literacy (Level 2) in Turkey 2012 (PISA 2012 and DHS 2013)

Screen Shot 2017-04-18 at 7.57.59 AM

Note the results above will be different from those found in PISA reports because these results include PISA ineligible 15-16 year olds in the calculations.

The 7 main findings from the above are as follows:

  1. There have been significant increases in PISA sample eligibility over time from around 45% of 15-16 year olds in 2003 to 80% in 2013.
  2. If we account for the growth in PISA eligible 15-16 year olds, the improvement in the percentage of 15-16 year olds acquiring Level 2 is between 2 times larger (for Mathematics) and 5 times larger (in Reading) than previously thought.
  3. Severe delays in grade progression in Turkey have been virtually eliminated and dropout has declined by 42% over this period.
  4. In 2003 the richest group were twice as likely to be eligible for the PISA sample than the poorest group.
  5. Although both boys and girls benefitted over the period, girls benefitted the most.
  6. The gap in access-to-literacy and access-to-numeracy between rich and poor has not changed and is larger than previously thought.
  7. 15-16 year olds in the East region of Turkey are less likely to be eligible for the PISA sample than 15-16 year olds in other regions.

Whether one chooses to use the Coverage Index 3 figures reported by the OECD itself, or those calculated from various DHS surveys, the conclusion is the same: there are large and changing proportions of Turkish students that do not make it into the PISA sampling frame and this has a substantial effect on the validity of inter-country and inter-temporal comparisons. This analysis shows that the gains in Turkey between 2003 and 2012 have actually been even more impressive than if one only looked at PISA data. This method could also usefully be applied to other middle-income and developing countries with high and changing percentages of PISA-eligible 15 and 16 year olds.

References

OECD. (2016). PISA for Development: Benefits for participating countries. PISA for Development Brief (Vol. 2). Paris.

Spaull, N., and Taylor, S., (2015). Access to what? Creating a composite measure of educational quantity and educational quality for 11 African countries. Comparative Education Review. Vol. 58, No. 1.

*There is an error in the Coverage Index 3 values provided in the PISA 2003 Report. The correct Coverage Index 3 values for 2003 can be found in the PISA Technical Report for 2003. See the Working Paper for a full discussion.

The Godfather Speaks

godfYesterday RESEP had our first internal education workshop of the year and it was a great success. One of the presentations was by Martin Gustafsson on various trends and shocks in the  education system. I found it to be especially important and interesting and asked if I could include the presentation in blog format, which Martin kindly agreed to (see below). For those that don’t know Martin he is easily one of the top 3 most knowledgeable people about the SA education system.

The 2 main points that Martin makes are:

  1. There is irrefutable evidence that there has been real progress in learning outcomes in SA over the last decade,
  2. That there is a very strange demographic trend in SA (confirmed by 2 independent data sources) that there was a large increase in births in 2004 and 2005 (in the order of 10%) which is extremely peculiar. Note this has significant implications for resource allocation, class sizes etc. This was discussed in the DBE 2016 Sector Review (see excerpt below), but hasn’t been given nearly enough attention.

123

Regarding #2, from discussions with Martin, who has been involved in reviewing the 2013 SACMEQ results, it seems clear that the 2007 to 2013 SACMEQ trend has indeed been positive for South Africa, and about as large as one could expect (and roughly in line with what has been seen in TIMSS). But these positive trends are smaller than the extremely large improvements, which I’ve argued are implausible, seen in earlier preliminary SACMEQ results presented to the Parliamentary Portfolio Committee on Basic Education in 2016. What the sector urgently needs is the finalising of the 2013 SACMEQ process and the release of official learner results for all SACMEQ countries.

The trends seen in #3 below are from this 2016 paper of Martin’s.

456

“At the lower primary level, what has clearly occurred is the entrance of a ‘wave’ of larger birth cohorts. In 2011, Grade 1 enrolments increased by 5.2% relative to 2010. In 2012, Grade 2 enrolments increased by 7.0%. By 2015, the increase had reached Grade 5, with enrolments in this grade increasing by 5.2% relative to 2014. As seen in Table 2 in the appendix, substantial increases were seen across all provinces, with the exception of Eastern Cape, which in fact saw a decline . The increases were strongest in Gauteng and Western Cape, almost certainly because these two provinces experienced a combination of two factors, both the demographic change in terms of larger birth cohorts, plus migration into these provinces. By 2015, grades 1 to 7 enrolments had reached 7,1 million in public ordinary schools, the highest figure since 2007 (when the enrolment total was also around 7.1 million). Moreover, total enrolment in just grades 1 to 5 was higher than it had been in any year since 2002. Projections indicate that the increases will continue to be felt in grades beyond Grade 5 in 2016 and beyond. ” Page 9 of this 2016 DBE Sector Report.

7

*Note in the graph s above (top left) the steady rise in births from 1982 to 1998 are simply because of better data-capturing rather than increased births. It stabilises from about 2000.

8910

For those that haven’t read the DBE 2016 Sector Review I would strongly recommend doing so!

Links on 21st C teaching…

21

I’ve been giving a few presentations on 21st Century Skills and thought it’d be helpful to provide some of the links I like on this topic. If you have any you’d like me to add please do include them in the comments.

Helpful links and reports:

wef

maker

Useful websites:

casel

Some videos I like:

Esther Wojcicki – Empowering Students

Screen Shot 2017-03-20 at 9.26.01 AM

Linda Darling-Hammond – New Learning for a Rapidly Changing World

Screen Shot 2017-03-20 at 9.26.47 AM

And what does the future look like? I like a few of the new WEF videos on The Fourth Industrial Revolution 

Screen Shot 2017-03-20 at 9.57.30 AM

and The New Vision for Education and

Screen Shot 2017-03-20 at 9.59.42 AM

“Matric really does start in Gr1” – my M&G/Teacher article on TIMSS 2015

screen-shot-2017-01-31-at-7-05-23-am

(The article below first appeared in The Teacher magazine in January, and in the Mail & Guardian on the 27th of January 2017)

The month of January is an interesting one in the South African calendar. It seems that this is the one time in the year when everyone cares about education, or more accurately, cares about matric. And in some senses there is a good reason for this; matric is the gateway to higher education. If we look at 25-35 year olds in the 2011 Census data we see that for those with less than a matric, 47% were unemployed (using the broad definition), compared to 33% among those whose highest qualification was a matric and only 8% for those with a bachelors degree. While matric used to be the big distinguisher between the haves and have-nots, increasingly the difference is between those with some kind of tertiary qualification and everyone else. And in 2016, as usual, mathematics proved to be a tough gateway subject for those who want to study further. Only one in three learners who wrote Mathematics in 2016 got 40% or more in the subject, with a recent study showing that only about 15,000 matrics achieved 70% or more in mathematics. That’s about 1,5% of students who start school in Grade 1.

As anyone familiar with maths will tell you, the subject is a hierarchical one that builds upon itself. You need to understand multiplication and division before you can understand fractions or rate and proportion. So where do the wheels come off? Is it just before matric, perhaps in Grade 9 or 10? Or even earlier in Grade 4 or 5? To shed some light on this question we can turn to some recent mathematics research published by the Human Sciences Research Council (HSRC) at the end of last year. Every four years South Africa participates in an international study of mathematics achievement called the Trends in International Mathematics and Science Study or TIMSS. We test a nationally-representative sample of Grade 5 and Grade 9 learners on a standardised international test, which is the same test that is written by thousands of other students in other countries and allows us to compare ourselves to these other countries. (Although almost all the countries test their Grade 4 and Grade 8 students on these tests). The most recent round of tests was done in 2015.

The results showed that only 34% of our Grade 9 learners could do basic mathematics, i.e. could reach the lowest international benchmark. That is to say that 66% of our learners could not do basic computations or match tables to bar graphs or read a simple line graph. They had not acquired a basic understanding about whole numbers, decimals, operations or basic graphs. However there was one piece of encouraging information that emerged from the study and that was that the number of students that could do basic mathematics increased from 24% in 2011 to 34% in 2015 in South Africa, one of the fastest improvements seen internationally.

But if 66% of our Grade 9 learners can’t do basic maths, when did these gaps emerge? In 2015, for the first time in our history, South Africa also participated in the primary-school level of TIMSS that usually tests Grade 4 learners – we tested our Grade 5 learners. It showed that 61% of Grade 5 learners could not reach the Low International Benchmark. Learners who do not reach the low international benchmark at the primary level cannot add and subtract three or four digit whole numbers like 218 and 191. They do not recognise familiar geometric shapes or parallel and perpendicular lines. They cannot read and complete simple bar graphs and tables. For example, according to our curriculum, multiplying a 3-digit number by a 1-digit number is meant to be covered in Term 1 of Grade 4 yet only 41% of our Grade 5 learners could calculate “512 x 3 =____”, which was one of the questions in 2015. So almost 60% of our Grade 5 learners are already significantly behind the curriculum in 2015.

The conclusion that the root of our problems is not in high school but rather much earlier, in the lower grades of primary school is not a new finding – there are many studies showing this from at least 1999. In a report published nearly 10 years ago, one South African education researcher (Dr Eric Scholar) analysed the mathematics achievement in 154 schools across the country. He concluded that the low levels of achievement we see in the higher grades are rooted in weak foundations in primary school. To quote his exact conclusion:

‘‘The fundamental cause of poor learner performance across our education system is a failure to extend the ability of learners from counting to true calculating in their primary schooling. All more complex mathematics depends, in the first instance, on an instinctive understanding of place value within the base-10 number system, combined with an ability to readily perform basic calculations and see numeric relationships … Learners are routinely promoted from one Grade to the next without having mastered the content and foundational competences of preceding Grades, resulting in a large cognitive backlog that progressively inhibits the acquisition of more complex competencies. The consequence is that every class has become, in effect, a ‘multi-Grade’ class in which there is a very large range of learner abilities and this makes it very difficult, or even impossible, to consistently teach to the required assessment standards for any particular Grade. Mathematics, however, is a hierarchical subject in which the development of increasingly complex cognitive abilities at each succeeding level is dependent on the progressive and cumulative mastery of its conceptual frameworks, starting with the absolutely fundamental basics of place value (the base-10 number system) and the four operations (calculation)’’

While as a country we continue to obsess about the matric pass rate, the research is really quite clear. The majority of our young people are acaquiring learning deficits early on in primary school and then carrying these with them as they move through school. As they are promoted into higher grades there is a decoupling between what learners know and can do and what the curriculum expects from them. We need to acknowledge that matric starts in Grade 1 (and even earlier), and that it really is possible to improve primary schooling if that is where we focus most of our time, energy and resources.

DBE needs you (2 vacancies)

we-need-you

My good friend and colleague Dr Stephen Taylor (who is the Director of Research in the National Department of Basic Education (DBE) in Pretoria) is looking for 2 people to join his team in the Research Monitoring and Evaluation unit. The full job advertisement is here and I’ve included screenshots of the relevant position below. I’ve done a Q&A with Stephen (and Martin Gustafsson who is also in DBE) to give you a flavour of the kind of people they are. I would whole-heartedly recommend Stephen as a boss and a person 🙂 they are creating a really impactful team (Janeli Kotze and Mpumi Mohohlwane have also recently been appointed there full-time). If you are looking for an excellent team, to have an impact in education and have good quantitative skills – apply! (Deadline 17 Feb).

screen-shot-2017-01-30-at-8-01-34-am

screen-shot-2017-01-30-at-8-01-43-am

PS I should totally get a finders fee for this kind of thing 🙂

Yale Young African Scholars Program 2017 (high-school students)

yyas-2017-flyer

If you know of any outstanding high-school students across the continent, this looks like a great opportunity to help prepare them for the US university admission and financial aid processes. Please forward it on to them. Deadline is the 31st of January 2017.

See excerpt from the email below

In 2016 YYAS brought 300 of Africa’s most talented high school students to programs in Rwanda, Ghana and Zimbabwe where they engaged in the sorts of robust intellectual exchanges that are crucial to understanding Africa’s most pressing challenges and exciting opportunities. With participants from over 20 countries across the continent, the students also gained exposure to the ideas and perspectives of a very diverse group of peers and took part in leadership skills development activities. Critically, however, the main focus of the YYAS program is to introduce the participants to U.S. universities’ admission and financial aid processes. Workshops led by Yale students as well as university admission representatives equipped YYAS participants with a thorough understanding of these processes, and we also offered standardized test preparation sessions plus ongoing mentorship that will see each student through his or her university application cycle.

I am very proud to be joining this exciting program and for the opportunity to help YYAS further its reach and scale across the continent. And I’m thrilled to announce that the 2017 YYAS program application is open! I hope you will share our promotional materials (see attachments) with secondary school students or organizations that work with secondary school students in Africa. Moreover, we do anticipate that many of our program’s alumni will apply to your university or programs in the near future. Please watch out for YYAS on their applications! We are certain that the academic standing and caliber of our alumni will make them excellent members of your community and hope that you will see YYAS as a stepping stone to great success in their university studies.


My M&G article on Universities in 2017

screen-shot-2017-01-08-at-1-10-29-pm

(The above article was published in the Mail & Guardian on the 6th of January 2016 and is available in PDF here).

Students contest the status quo 

Over the last two years, universities in South Africa have become increasingly contested spaces. Student movements like RhodesMustFall and FeesMustFall have categorically rejected the status quo as unacceptable and are working to reorder not only the principles that govern universities, but ultimately the principles that govern the country. Of course the first order of business is challenging our current assumptions about who should go to university, what it should look like, and who should pay for it. And on all three fronts they have been phenomenally successful. It is really quite remarkable that a loose group of students who lack a political mandate, who have not been elected by anyone, and have virtually no resources have managed to achieve so much so quickly. They have brought whole universities to their knees and prompted the creation of a Presidential Task Team. Most significantly they garnered enough support to essentially force the government to allocate an additional R17 billion to higher education in the Medium Term Budget.

About 200 years ago, Napoleon Bonaparte famously quipped that a revolution is simply an idea which has found its bayonets. In the context of the various student movements I think it’s worthwhile to try and identify the underlying idea, its animating principle. As the student movements assemble and reassemble under different names (seemingly quite effortlessly), I think there is a leitmotif running through all of them; the unfinished business of 1994. There is a generation of young Black South Africans who feel that the terms of the negotiated settlement were unjust and let White South Africans off the hook. Dr Amos Wilson. a theoretical psychologist and social theorist, makes the logic behind this position explicit in the following quote:

“Justice requires not only the ceasing and desisting of injustice but also requires either punishment or reparation for injuries and damages inflicted for prior wrongdoing. The essence of justice is the redistribution of gains earned through the perpetration of injustice. If restitution is not made and reparations not instituted to compensate for prior injustices, those injustices are in effect rewarded. And the benefits such rewards conferred on the perpetrators of injustice will continue to “draw interest,” to be reinvested, and to be passed on to their children, who will use their inherited advantages to continue to exploit the children of the victims of the injustice of their ancestors. Consequently, injustice and inequality will be maintained across generations as will their deleterious social, economic, and political outcomes.”

Thinking that the various incarnations of the student movements are primarily about universities is a mistake. RhodesMustfall was not about a statue; it was about reclamation and power and history. Similarly, the challenge today is not only about who should pay fees, but who should own the land. The discontent and anger about the ‘pay-to-play’ market system that we have – where only those who can pay for quality get it – is as much about private hospitals and Model-C schools as it is about universities. The true contested space at our universities at the moment is really about the principles that currently order our society and reimagining different ones.

Fighting for a different future

There are students in South Africa today who look at our country and refuse to accept that the way we are currently doing things is the only way they can be done. How is it that in a country with considerable wealth and resources that we still have 10 million people living on less than R10 a day? Whenever I land at Cape Town International Airport and get an aerial view of Khayelitsha, I think to myself “How the heck can we, as a country, not find a dignified solution to housing for the poor?” In Cape Town we have 400,000 people living in shacks a mere 40-minute drive from the house that sold for R290-million in Bantry Bay. We have decadent opulence living next to extreme poverty. It’s not right.

And so we come back to the contested space at universities where people have different ideas about how we get from where we are to a better future. Students associated with Black-First-Land-First argue for land expropriation without compensation. The Nobel Laureate Thomas Piketty motivates for much steeper wealth and inheritance taxes to level the playing field. The Wits SRC has proposed a once-off ‘apartheid windfall’ tax on “companies that benefited unfairly by abusing state resources” under apartheid.

But since the current discussions at universities are still centred on fees and access to university, let’s start there and think about what 2017 might hold for universities, and put some numbers on the table. Personally I think we will actually find a sustainable solution to student financing at universities, possibly even in 2017. Sizwe Nxasana – the head of the Presidential Task Team – has developed a highly sophisticated and workable model of student funding called the Ikusasa Student Financial Aid Programme (ISFAP) that is being trialled at seven universities this year, focussing on students studying medicine, engineering and accounting. This is essentially a public-private partnership which aims to “significantly increase the funding and resources which are made available to support students from working class families to graduate and find employment by leveraging private sector funding.” One can think of it as a three-tier model with the poorest students being fully funded with grants and the missing-middle with a combination of grants and income-contingent loans (to be repaid only if the recipient does graduate and earns above a certain amount). Then finally, those at the top that can pay fees do pay fees. While it isn’t free education for everyone – and the vanguard may therefore not accept it – if implemented properly it has a good shot at ensuring that no student is excluded from university on financial grounds. That would be a significant achievement.

Thankfully, many in the sector are now realising that needs-blind allocations to higher education – where all students are equally subsidised – are socially regressive and anti-poor. This is largely because the children of the wealthy attend fee-charging schools that give them a much better shot at qualifying for university than the children of the poor. We know that less than 1 in 10 children from the poorest 70% of households qualify to go to university compared to 1 in 2 or 3 children (40%) among the wealthiest 10% of households. And because of this, if one allocated an additional R10bn to higher-education in a blanket fashion, then about R6,8bn (68%) will end up benefitting the wealthiest 20% of South African households because it is their children who are disproportionately at university (according to two fiscal incidence studies). A recent study showed that 60% of students that qualified for university came from the 30% of high schools that charged fees. What is the point of raising revenue by additional taxes on the richest 20% only to give two thirds of that money straight back to them in the form of indirect subsidies to their children?

So if we agree that the rich should not be subsidised (usually defined as those in households with annual income of more than R600,000), how many students would need funding? Professor Servaas van der Berg’s analysis of household surveys has shown that about 60% of the current university-going population would be eligible for funding. (This assumes that income is under-captured in surveys by about 30% . Importantly, this would cover 73% of Black African university students and 30% of White university students.

While ending financial exclusion at university won’t solve the thornier issues in South Africa – about land, inequality, restitution, primary education, unemployment – it would serve as a powerful and invigorating example that things really can be different to what they are now. It would be poetic if the start of a successful campaign for a different South Africa could trace its origins to the toppling of a statue of Cecil John Rhodes.

Dr Nic Spaull is an education researcher at the Research on Socioeconomic Policy (RESEP) group at Stellenbosch University. He is on Twitter @NicSpaull


My take on Matric 2016…

screen-shot-2017-01-06-at-10-29-18-am

screen-shot-2017-01-06-at-10-29-36-am

Every year there is a big song and dance about the matric exams and if the pass rate went up or down, which province came out on top etc. etc. Thankfully some organisations like Equal Education are directing our attention to where the root issue is: the weak foundations students get in primary schooling. There is ample evidence of this in maths and reading as the foundational bell-weather subjects that pretty much everything else is built on.

Throughput pass rates

As I’ve mentioned before we need to move beyond our myopic obsession with the matric pass rate and start seeing the results in light of other statistics, notably the throughput pass rate. Rather than calculating the number of students passing matric divided by the number of students writing matric (the traditional matric pass rate) we should also be calculating the number of students who pass matric relative to the number of students in grade 10 two years earlier and those in grade 2 ten years earlier (throughput pass rates). This gives us an idea of how many kids are dropping out along the way and if this is increasing or decreasing over time. (Note that this is also affected by the changing number of students repeating Grade 10. Because we don’t know the number of non-repeating students we have to use the total number of students enrolled in Grade 10).

From the above graph and table we can see the following:

  • The throughput pass rate and the traditional matric pass rate do not always move in tandem. For example, between 2014 and 2015 the traditional matric pass rate went down while the throughput pass rate went up, indicative of the much larger cohort of students who did worse on average but because there were so many more students this meant a higher throughput pass rate (as I ‘ve discussed here and Nick Taylor has made the same argument in 2011).
  • The throughput pass rate has been steadily increasing over time, which is a good thing.
  • Less than half of the cohort (whether Grade 2 or Grade 10) actually pass matric. In our system about 60% of South African youth leave the schooling system without any proof of their educational status.

Standardisation and grade inflation

Secondly there is the issue of standardisation and adjustment. The quality-assurance body Umalusi is tasked with standardising the matric results so that no one year is disadvantaged relative to another. If the exams are more difficult/easy then Umalusi is allowed to adjust the marks upwards/downwards (by a maximum of 10 percentage points). As I discussed last year the presence of an extra 120,000 matrics in 2015 made the process of standardisation much more complicated than it had been in the past. We know these are weaker students and thus would have dragged down average performance, yet the decline in average performance in 2015 was attributed to more difficult papers.

“Was the test really so much more difficult than previous years? (This is the only reason why one is allowed to adjust the marks at all.) Why did the internal and external moderators not pick up the huge increase in difficulty? Is it not more plausible that the massive drop in pre-adjusted performance was actually due to the additional 112,000 weaker pupils who would have otherwise dropped out? If so, Umalusi shouldn’t have adjusted. (from here)”

In my view the standardisation of raw marks should be done without progressed learners included and then applied to progressed learners after the fact. You cannot compare the 2015 and 2016 cohorts (and to some extent the 2014 cohort) with earlier cohorts because they did not have progressed learners. I think this remains an open question and I am quite anxious about the very large adjustments that Umalusi is making, assuming that the tests are getting much more difficult when the most plausible explanation is the inclusion of many more weaker students that typically would have dropped out in the past. (In 2015 the number of students passing maths literacy increased from 38% to 71% and there were similarly large adjustments in 2016).  If I am right about this, and there is essentially a lot of grade-inflation going on, then we are likely to see universities increasing their NSC points entrance criteria and – something which we have already seen over the last 6 years – the use of other criteria like the National Benchmarking Tests.

Provincial performance and sample selection

Every year the media likes to highlight which province has done the best in the matric exams. The competition is usually between our two wealthiest provinces (surprise surprise!), which are Gauteng and the Western Cape. In 2016 the Free State had the highest matric pass rate of 88% and so MEC’s and bureaucrats were all commending the Free State for their achievement. But if we dig a little deeper there are a few thorny questions here…

In 2011 Nick Taylor argued that changes in the matric pass rate can be driven by many things, including the difficulty of the exams, subject combinations and the number of students that actually make it to matric. This later point is the one I want to highlight here – the practice of not letting weaker students get to matric, sometimes referred to as gate-keeping or — and I hate this term — ‘culling’).

When I heard that the Free State and the Northern Cape had increased their matric pass rates significantly (7 and 9 percentage points respectively), my first question was “But did they hold back more students than last year?” So let’s see what the numbers say. Does there seem to be a relationship between the number of Grade 12s writing matric between 2015 and 2016 and a change in the pass rate over the two years? Let’s see…

screen-shot-2017-01-06-at-11-24-36-am

So, the three provinces with the largest increases in their matric pass rate also had the biggest declines in the percentage of students writing matric. That’s pretty strange. So if we do a similar analysis to the throughput pass rate above but at a provincial level what do we see? The Free State is no longer first but 4th of the provinces with the Western Cape and Gauteng at the top. And the Northern Cape and KZN are now only marginally better than Limpopo – the second worst performing province.

screen-shot-2017-01-06-at-11-15-04-am

screen-shot-2017-01-06-at-11-15-19-am

There may well be a legitimate explanation for this but our first port of call when seeing a big change like this is a change in the underlying sample. Before we start asking what interventions the Free State implemented we should be asking if the ‘increase’ is legitimate. At least at face value there seems to be a lot more sample selection in the provinces with the highest increases in matric pass rates. And judging from the Grade 10 (2014) and Grade 11 (2015) cohorts it doesn’t look like there was a population decline in these provinces.

So to sum up the above I’d say the following:

  1. We shouldn’t be obsessing about the matric pass rate in isolation or as much as we do.
  2. The biggest problems that should occupy our time, energy and resources are getting the foundations right in primary school.
  3. At least part of the reason why the Free State, the Northern Cape and KZN did better in 2016 than in 2015 is that they held back a higher proportion of their Grade 10 and Grade 11 students than the other provinces.
  4. I think there are still big question marks about the way Umalusi is treating progressed learners in the standardisation process and we may be witnessing quite significant grade inflation.
  5. Universities are likely to feel the brunt of this when their first years are not as well-equipped to succeed as their grades seem to indicate.

So now, I need to get back to Foundation Phase reading research 🙂

The excel file with the above tables/graphs/figures is here in case anyone wants to do their own calculations/graphs. 

“Higher education: Free for the poor not free for all” (my ST article)

stdonald1

(The article below first appeared in the Sunday Times on the 16th of October 2016)

Across the country student protests have shut down universities with demands for “free higher education for all” prompting a Fees Commission and more recently a Presidential Task Team of Ministers to help solve the crisis. At the root of the issue is the righteous indignation about the fact that academically deserving students are excluded from university (either initially or subsequently) because they cannot pay their fees or living expenses. After overcoming countless barriers to simply get to university, these resilient students are then excluded simply because they are poor. This is unacceptable. I whole-heartedly agree with the underlying principle that no student should be excluded from university on financial grounds, which is unfortunately the status quo. Note that this is not the same as saying I think we should have “free higher education for all.” I think that subsidizing the richest 10% of South African households is unconscionable and unjustifiable, and “free education for everyone” is exactly that: a subsidy for the rich. Let me explain why.

Firstly we have to ask who makes it to university? A recent study published last month by my colleagues Dr Hendrik van Broekhuizen and Professor Servaas van der Berg shows that of 100 children that started school, only 14 will qualify for university, 12 will actually enrol and only 6 will get some kind of undergraduate qualification within 6 years. So when we speak about university we are really speaking about the 12% of students that actually make it to university. And who are the students that qualify? In a recent matric cohort, about 60% of those that qualified came from the wealthiest 30% of high schools (quintile 4 and 5), most of which charged fees. And who attends fee-charging schools? Largely those wealthier students whose parents can afford the fees. We can also look at this by race; about half (47%) of white matriculants go to university compared to less than a fifth of Black (17%) and Coloured (20%) matriculants.

This explains why blanket fee-free education is considered to be highly regressive or anti-poor. In contrast to a free-for-the-poor system which is pro-poor. The fact that the children from the wealthiest households are many times more likely to get in to university means that they would benefit disproportionately from a blanket fee-free system. It should thus come as no surprise that the World Bank (2014) and Van der Berg (2016) both estimate that as much as half (48%) of the university funding in South Africa accrues to the richest 10% of households. And two thirds (68%) accrues to the wealthiest 20% of households. As Van der Berg notes, this constitutes an “extreme bias towards spending on the rich if all students are equally subsidised.”

What is the point of raising revenue by additional taxes on the richest 20% only to give two thirds of that money straight back to them in the form of indirect subsidies to their children? No, instead we should use all the revenue raised from the additional taxes – however much that might be – to properly fund the poorest 80% of students who manage to qualify against all odds and who really need the funding.

The next question then becomes what the best modality is for ensuring that no student is excluded from university on financial grounds. While ideologically students may be demanding ‘free-education for all’, the existing economic environment of depressed economic growth and fiscal consolidation means that it is not easy to find an additional R60bn of recurrent expenditure. It is not a cop-out when Treasury says that it cannot simply ‘find’ an additional R60bn every year. To put this in perspective, the entire government budget of the Western Cape is R55bn. Health, housing, education, everything. We also need to grapple with the issue that additional money allocated to higher education is likely to crowd out other budget items like the progressive realisation of other constitutional imperatives such as universal health care (National Health Insurance) or universal housing.

Personally I am in favour of raising taxes (the skills tax and the capital gains tax) to fund poor and working class students who are currently financially excluded from university. Yet we need to go further than that to cover the “missing middle.” I think that a hybrid system of grants, subsidized loans and fees would lead to the largest reduction in financial exclusion, irrespective of how much is raised. The poorest students would receive ‘free’ education in the form of adequate grants that cover both fees and living expenses. The missing middle would qualify for government backed loans whose repayment was contingent on graduating and earning above a certain threshold (income-contingent loans), and the wealthy would pay fees, as they are currently doing. Those students who get government-backed loans would carry little financial risk, receive subsidized interest rates and capped loan repayments that would only revert in the event that they earn above a certain threshold. The leveraging effect of using the existing financial markets and banks means that, for example, R15bn of additional revenue could stand surety for loans of up to R60bn. So while it might only be possible to raise an additional R15bn – through a 1% rise in the Skills Levy for example -, one could ensure that no students are excluded on financial grounds. This is not politically sexy or glamorous, and doesn’t have a catchy hashtag (yet) but it does grapple with the budgetary realities we face as a country.

It is not at all clear to me why the different student movements are insisting on free education for everyone (including the rich) in spite of all the evidence that this would be fiscally irresponsible and socially regressive. Subsidizing the rich wastes precious tax income that could otherwise have supported more poor and working class students. Furthermore, if we can shift the conversation from an ideological (but unworkable) “Free Education For All” to a pragmatic “Funding For All” we will be taking a big step in the right direction.

Important research inputs on #FeesMustFall

fees

I have been meaning to blog about some new research on access to higher education that was published earlier this week: “Higher Education Access and Outcomes for the 2008 Matric Cohort” (Van Broekhuizen, Van der Berg & Hofmeyr, 2016). I will only highlight some of the key points from the 122-page Working Paper which is really worth reading in its entirety. Essentially the researchers used the matric data from 2008 and followed these students (using their ID numbers) into the higher education system using data from the Higher Education Management Information System (HEMIS). Perhaps the most striking feature is that of the 100 students that started school, only 12 ever access university (9 immediately after matric and 3 later), 6 get some kind of qualification within 6 years and only 4 get a degree within 6 years.

Screen Shot 2016-09-28 at 3.10.39 PM.png

Secondly, that matrics that attend quintile 5 schools (almost all of which charge fees) are four times as likely to access university than those from the poorest 60% of schools (quintiles 1-3), all of which are no-fee schools. However, it’s encouraging to note that of those quintile 1-3 student that do qualify with a bachelor’s pass, more than 63-68% do actually access university, compared to 70% among quintile 5 students.

screen-shot-2016-09-28-at-3-12-11-pm

Much of the paper points to that fact that unequal access to university is rooted in a highly unequal schooling system where access to high-quality schooling largely depends on a family’s ability to pay school fees. If one looks at the cumulative matric average achievement by race one still finds enormous differentials. While 60% of White matric students achieved 60% or more in matric, only 5% of Black African matrics score at or above 60%. And this is only among the students that actually made it to matric which is only slightly more than half the cohort (see this paper).

screen-shot-2016-09-28-at-3-16-05-pm

The last piece of their research that I want to highlight is that the student intake at different universities is vastly different. If one looks at the matric marks of the typical student entering UCT, Stellenbosch, UP or Wits one can see below that they scored 70% or above on average. This is in stark contrast to those students entering TUT, Fort Hare, Uni-Zulu, Walter Sisulu, UWC etc., all of whom have incoming students whose average matric mark is less than 60%. At the Central University of Technology (CUT, in Free State) the average entrant scored 50% in matric.

screen-shot-2016-09-28-at-3-01-54-pm

At the beginning of last year Professor Servaas van der Berg gave a Brown-Bag Lunch Seminar at Stellenbosch University  on “The Distributional Implications of Student Fees.” I include some notable excerpts and graphs below:

“Education has a number of properties which make the analysis of the demand for it both interesting and complex. … (Education is) …a consumption good and a capital good, i.e., although much of the expenditure is justified in terms of the effects on the individual’s income in the future, many of the activities of educational institutions are primarily justifiable in terms of their immediate consumption benefits. Moreover, education affects individuals’ future incomes.” – (Stiglitz 1974: 349)

screen-shot-2016-09-29-at-1-16-04-pm

Perhaps most striking are Van der Berg’s estimates of who actually makes it to university and where they come from in the income distribution. According to these estimates, there are more students attending university from the richest 10% of the income distribution (Decile 10) than from the poorest 80% of the income distribution (Deciles 1-8 combined).

screen-shot-2016-09-29-at-1-48-06-pm

screen-shot-2016-09-29-at-1-33-47-pm

Last month Nico Cloete (from CHET) gave a lecture at SALDRU (UCT) titled: “University Fees in SA: A Story from Evidence.” I include some relevant slides from his presentation:

screen-shot-2016-09-29-at-1-47-00-pm

screen-shot-2016-09-29-at-1-47-23-pm

screen-shot-2016-09-29-at-1-47-40-pm

Anyone who wants to contribute to the debate about university fees needs to grapple with the realities presented by these three papers/presentations. At the end of the day we need to be able to answer the question of where the money will come from. A Graduate tax? Debt? The Education or Health budgets?

The most reasonable (and probably workable) solution that I have heard is that proposed by Prof Van der Berg who suggests that we should use the existing financial services infrastructure (banks) who could provide government-backed grant-loans (my terminology not SVDB’s) to students that qualify for university. It would be a grant that converts into a loan if a student successfully completes their degree and starts earning a decent income. It would still require a huge amount of government finance to provide the surety to banks for students who come from households that earn less than R500,000 (or some threshold). But, unlike with totally ‘free’ education, the students that do successfully complete their degrees would ‘pay-it-forward’ and contribute to the fund used to finance future students. boom

Also, as a side-issue, the Fees Commission needs to get a fast-tracked timetable and told to release at least a preliminary report and recommendations before the end of the year. We cannot wait until June next year. The political hot-potato would have been passed along one too many times from VCs to DHET to Treasury and eventually it will just explode. A stitch in time saves nine.

(If you have any additional research suggestions please send me an email and I’ll include them in this post)

Additional inputs from readers: 

Between the Devil and Deep Blue Sea? The Financing of Higher Education” 3×3 article by Philippe Burger – Sept 2016 (Thanks Marisa!).

Abstract: “Higher-than-inflation increases in student fees since 2009 often are blamed on declining government subsidies to universities. This is not entirely correct, if one considers real per-student subsidies. Fee increases resulted mainly from cost pressures faced by universities due to growing student numbers and a weakening rand. These pressures will not disappear. Eliminating government wastage is not a durable solution and difficult choices cannot be avoided. So, who should pay for increasing costs, students or government – or which combination of these?”

Kagisano Number 10 – Student Funding” – CHE (April 2016)

Description: The tenth issue of the CHE’s journal, Kagisano, brings together a number of papers that were presented at a CHE colloquium on student funding that was held in December 2013. The colloquium took as its point of departure the Funding chapter of South African Higher Education Reviewed, and the various papers, presented by experts who responded to a call for papers, all address in different ways the student funding crisis that reached a head with the #feesmustfall campaign in late 2015, and that continues to underlie student unrest in higher education. Different ideas on how to restructure student funding are presented, and the solutions range from the philosophical to the practical. This issue aims to contribute to the ongoing conversations, negotiations and policy-making aimed at ameliorating the intractable challenge of how to fund increasing access to higher education while ensuring that students receive a quality higher education experience.

Shaky data skews literacy results (M&G article on SACMEQ IV)

screen-shot-2016-09-25-at-11-26-28-am

(The article below was published by the Mail & Guardian on the 23rd of September 2016)

Every few years South Africa participates in international tests of reading, mathematics and science in an attempt to see what our students know and can do, and how this is changing over time. These tests are independently set and usually comparable over time. Every 4 or 5 years we test our Grade 9 students in maths and science (Timss) and our Grade 4/5 students in reading (Pirls), and every 6 years we test our Grade 6 students in reading and mathematics (Sacmeq). 2016 happens to be the year when all the results of these assessments are released to the public. The 2015 Timss and Pirls results will be released in November/December this year and the 2013 Sacmeq results were presented to Parliament earlier this month, which is what I will focus on here.

In what would have been the biggest news of the post-apartheid period – at least if it were true – Parliament heard that South Africa’s primary education system improved faster than any other education system in the history of international testing, i.e. since 1967. Our alleged improvement was more than twice as large as the fastest improving country in the world, Brazil. To be specific, South African Grade 6 students’ test scores improved by more than 0.9 standard deviations between 2007 and 2013 or the equivalent of an extra 3 full years worth of learning. To put this in perspective, this is the same as taking Thailand- or Mexico’s education system and making it equal to Finland’s or Canada’s in 6 years. It makes for a great story or a wish from a Fairy Godmother, but not for plausible results from a psychometrically-rigorous international test. Note that it is not only South Africa that experienced these colossal ‘gains’, but all Sacmeq countries, which is even more suspicious. A big part of the alleged Sacmeq improvements actually arise from different methodologies employed in 2007 and 2013, making them incomparable until they are properly equated.

The results presented to Parliament compare data from 2007 and 2013, yet the way these results were calculated in each period was not the same, and I should I know. I was appointed by Sacmeq itself earlier this year to analyse the results for the international Sacmeq report. After analysing the data I raised a number of serious technical concerns about the data that significantly affect the comparability and validity of the findings, and especially the fact that the weaker students had been excluded from the final analysis. I advised the Sacmeq Secretariat to address these concerns before any publication of the results since doing so would be misleading. Based on the subsequent response from the SACMEQ Secretariat indicating that this would not happen I explained that I could not in good conscience continue with the analysis and chose to resign on technical grounds in August this year. The issues I raised have not been addressed since the results presented to Parliament were the same as those that I identified as problematic. At the same time this was going on I emailed the Department flagging my concerns and cautioning against publishing the results.

The Department of Basic Education itself was shocked by the unprecedented improvements. In the presentation to Parliament they explain: “Given the significant improvements, the South African national research team requested SACMEQ to double check the results and were subsequently reassured on their accuracy.” This is simply not good enough.

The lack of comparability between 2007 and 2013 is so glaringly obvious one doesn’t need inside knowledge of the data to see how implausible the results are. At the same time that the student reading scores soared (rising by 0.9 standard deviations), the teacher reading scores plummeted (dropping by 0.8 standard deviations), which is extremely peculiar. If we are to believe the results, by 2013 basically all South African students could read, with illiteracy rates dropping from 27% in 2007 to 3% in 2013. This is totally at odds with the other main international test we do, Pirls in 2011, which showed that 29% of Grade 4 students were reading-illiterate and 58% could not read for meaning, confirming a host of smaller studies showing the same thing.

If we dig a little deeper, the Department’s presentation to Parliament apparently showed that the biggest improvers were Limpopo and the Eastern Cape. Go figure. These are the very same provinces that were placed under administration (Section 100) in 2011 because they were so utterly dysfunctional. To use the Minister’s own words, these are the education system’s “pockets of disaster” whose 2015 matric results were a “national catastrophe.” Yet Sacmeq would have us believe that illiteracy in Limpopo has been totally eradicated, dropping from 49% in 2007 to 5% in 2013. In stark contrast, our other major international test (Prepirls) showed that of the more than 2900 Grade 4 students that were tested in Limpopo in 2011, 50% were reading-illiterate and 83% could not read for meaning.

For those unfamiliar with the norms of psychometrics and testing, it is perhaps helpful to explain by analogy. The scale of the ‘improvements’ in test scores shown in SACMEQ 2013 is tantamount to saying that Usain Bolt and all the other athletes in the race ran the 100m in 5 seconds without ever wondering whether there was something wrong with the stopwatch. The sad thing about all of this is that it does seem that South Africa is really improving – other reliable evidence points to this – but not nearly as fast as the SACMEQ IV test scores would have us believe. According to the presentation, the Sacmeq questionnaire data also encouragingly shows that students’ access to their own textbooks increased substantially over the period from 45% to 66% for reading textbooks and from 36% to 66% for maths textbooks. This is good news.

In the latest turn of events the Department explained that apparently the results presented to Parliament were in fact “preliminary”, that an “extensive verification process” is currently underway, and that it is “fully aware of the issues raised in this regard.” Yet why then did it choose to go ahead and present questionable results to Parliament? Apparently researchers – AKA me – have “mislead the public” and my motives are “unclear.” There is nothing unclear about my motives; there is a major technical concern and the public should not be mislead into trusting these results presented to Parliament. There is also no uncertainty about whether the Sacmeq IV results should have been presented to Parliament. They should not have been presented while there is still so much uncertainty around the comparability of the results, end of story. The Department has been aware of the serious technical concerns around the results for some time now, since I emailed a number of members of the Department’s own research team many months ago drawing attention to these problems and cautioning against publishing any results until they could be rectified.

What I do not understand is why the Department would undermine their own technical credibility by presenting obviously questionable results to Parliament. Personally I would also not be surprised if the Sacmeq data – once comparable – did show an improvement in line with those of other studies. Soon we will also have the Pirls results of 2015 as another data point to verify what is going on. In South African education there is probably already a good story to tell, why muddy the waters by reporting such obviously impossible improvements based on dodgy data? The Department and Sacmeq must make sure the results of Sacmeq 2007 and 2013 are strictly comparable before reporting any further results and causing additional confusion.


Serious technical concerns about SACMEQ IV results presented to parliament

 On the 12th of September the Department of Basic Education (DBE) presented a briefing to the Basic Education Portfolio Committee on the SACMEQ IV (2013) results. This was the first time that these results were presented in a public forum, and the first time that the national average SACMEQ IV reading score (558) and the national average SACMEQ IV mathematics score (587) were presented. The presentation is publicly available here.

I have an intimate knowledge of the SACMEQ IV data given that I was appointed by the SACMEQ Secretariat to analyse the SACMEQ IV data for the international report (date of appointment: 19 April 2016, Purchase Order Number UB-P02016001112, University of Botswana). After analysing the data I raised a number of serious technical concerns arising from the data  that significantly affect the comparability and validity of the findings and advised the SACMEQ Secretariat to address these concerns before any publication of the results (letter dated 26 May 2016). I also emailed the SACMEQ Technical Advisory Committee (9 June 2016) outlining the technical issues. Only one member responded and indicated that the item-response-theory (IRT) analysis should be redone with two independent verification checks. Based on the subsequent response from the SACMEQ Secretariat indicating that this would not happen I explained that I could not in good conscience continue with the analysis and chose to resign on technical grounds (resignation letter dated 7 August 2016).

The principal grounds for my technical concerns and subsequent resignation was the non-comparability of the results between SACMEQ III and SACMEQ IV because of the different methodologies employed when calculating test scores between SACMEQ III and SACMEQ IV, and particularly the fact that weaker students had been excluded from the final results in the process. This does not seem to have been addressed since the results presented to Parliament were the same as those that I identified as problematic.

Unfortunately, the contract that I have signed with SACMEQ prevents me from publishing any results that are based on that data until the international report has been publicly released, at which time I will provide a full account of my technical concerns and reasons for the non-comparability. I have also subsequently deleted the data on SACMEQ’s request.

The Department of Basic Education is already aware of all of my concerns since I emailed a number of members of the Department’s research team drawing attention to these problems and cautioning against publishing any results until they could be rectified. It would seem that the Department has chosen to push ahead and report these problematic results to Parliament in spite of these numerous concerns.

Comments on the SACMEQ IV presentation to parliament:

  • The gains in the SACMEQ reading and mathematics scores between 2007 and 2013 are so unbelievably large that they would make South Africa the fastest improving education system in the world, together with Country 2 and Country 7 (names of other countries were excluded in the presentation to parliament. These countries improved by more than 0.9 standard deviations or 0,13 standard deviations per year. The improvement from 495 to 587 is an 18,5% improvement in test scores (or 2,7% improvement per year). A 2012 study looking at how fast education systems can improve points to Brazil which is the fastest improving education system in any testing system. Yet the SACMEQ IV results presented to parliament would have us believe that South Africa (and Country 2 and Country 7) improved at least twice as fast as Brazil, the fastest improving country. This is extremely extremely unlikely. (It is also unlikely that the teacher test scores have dropped so drastically). We know from other data (such as TIMSS 2003 and 2011) that South Africa has improved in Grade 9 mathematics but this improvement was only half as large as that reported by SACMEQ IV. South Africa’s scores may well have improved between 2007 and 2013 but we cannot say if they have improved or decreased until the results are actually comparable.
  • The fact that teacher test scores plummeted at the same time that student test scores soared should already make us very curious about the technical procedures that might lead to such a situation.

I think the best way forward is for the Department of Basic Education to issue a statement explaining whether they believe the SACMEQ III and IV results are comparable and why and whether these results were based on an earlier version of the data, one which has subsequently changed. And secondly for us to wait for the SACMEQ IV Technical report to be released by SACMEQ so that the procedures, methods and assumptions underlying the SACMEQ IV results can be scrutinised by researchers around the world. This is the reason that the TIMSS, PIRLS and PISA results are all only released at the same time as the full international report.

SACMEQ is an extremely important indicator of changes in reading and mathematics achievement over time. It’s reputation and technical credibility must be upheld for it to retain its position as the main cross-national testing system in the region. To do so, the methods and analysis must be above reproach and open to scrutiny by independent researchers.


Do you know an outlier township/rural school in KZN, LP or GP??

Color pencils representing the concept of Standing out from the crowd


So I have finally taken to crowd-sourcing in my research and I need your help!

Do you know of any ‘outlier’ or exceptional township or rural primary schools in either KZN, Limpopo or Gauteng? Schools that manage to succeed against the odds and achieve great learning outcomes.

In a new ESRC/DFID study we want to understand how these schools manage to get the results they do, and specifically to understand the school leadership and management characteristics in these schools. But first we need to identify these outlier schools. We’re trying a number of different approaches to identifying these schools and then triangulating the results.

So word or mouth or your first-hand experience with an exceptional township/rural school could really help us. If you have any suggestions please send me an email at NicholasSpaull[at]gmail.com with the name of the primary school and why you think it’s an outlier school and any contact info if you have it!

Looking forward to hearing from you!!

Nic

21st Century Skills: MakerSpace

fablab_news

If you’re interested in 21st Century Skills (like Creativity, Collaboration, Critical Thinking, Communication), you should be looking into MakerSpace which now has a branch in Durban 🙂 The aim is a kind of ‘make it yourself’ drive, and helps by providing the skills, tools and training to do it. For education this might be about 3D-printing, or how to use and program an Arduino, or Robot Making (see pamphlet below). This reminded me of Stanford’s FabLearn Labs which works on a similar logic (the photo above is of a FabLearn Lab). If your school can afford these types of courses I would strongly recommend moving in this direction…

School programmes

Screen Shot 2016-07-29 at 11.51.20 AM

You can find out more here – http://themakerspace.co.za/